
Home & Garden tracks almost exactly at the cross-industry average, with the flattest trend line of any category and a 2.17 pp spread across six months. That predictability is genuinely useful for planning, since you know what to expect from your hook rates, and surprises are unlikely in either direction.
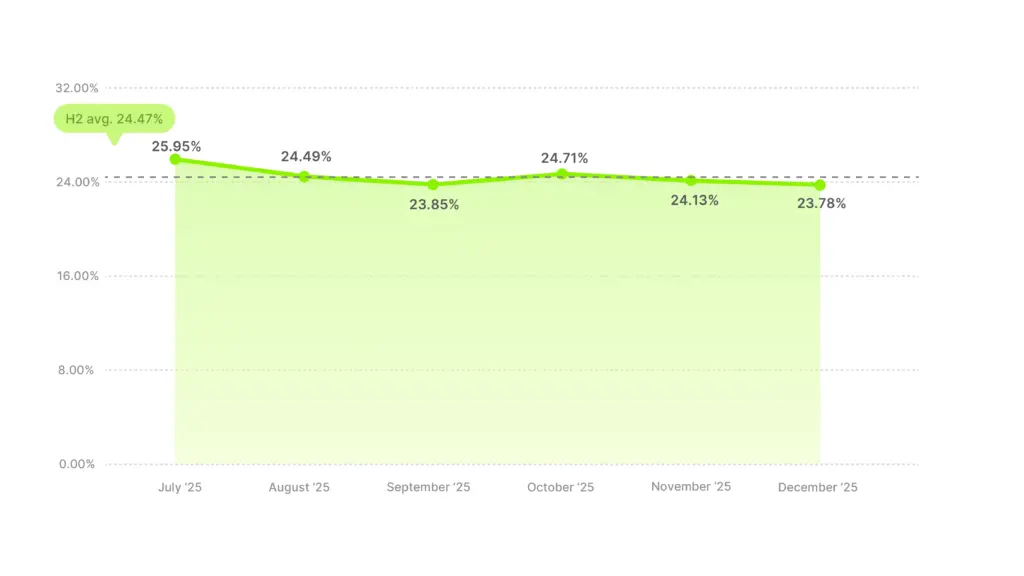
Industry hook rate average
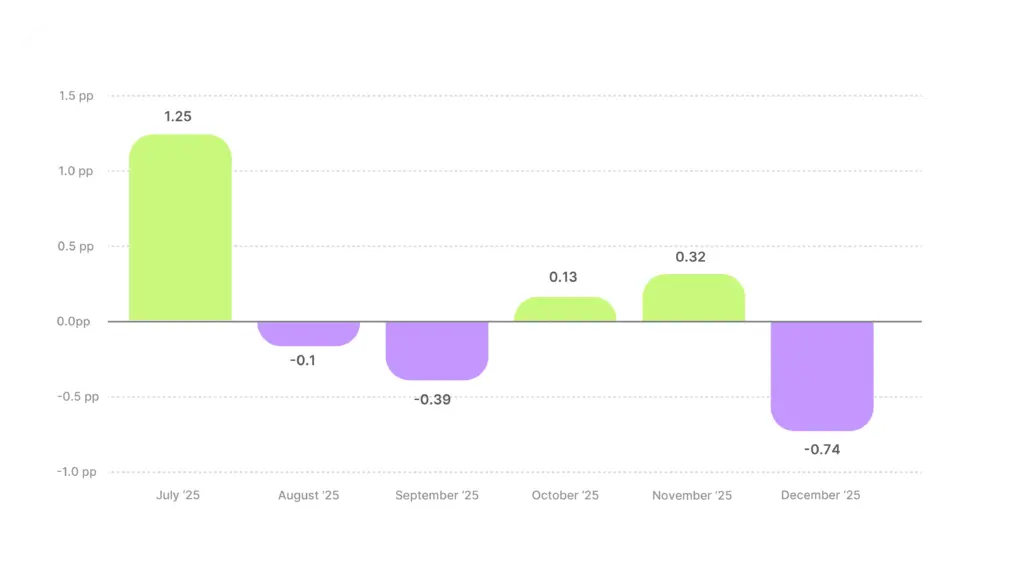
Distance from all-industry average
July’s peak makes intuitive sense, with the outdoor projects, garden season, patio setups offering many avenues for engaging creative. Summer is when this category’s content is most visually compelling, similar to Food & Beverages. The question is why the category doesn’t get a Q4 boost. Home decor, hosting prep, seasonal decorating, and giftable home products should create a tailwind in November and December. But hook rates drifted downward right through the holiday season.
One possibility is that the category is too mixed. Gardening content dragging down what home decor might be doing well on its own. Another is that the creative isn’t adapting to the seasonal shift in buyer intent. Brands still running general product content in December rather than leaning into holiday hosting (“make your home guest-ready”), seasonal transformations, or gift positioning may be missing the window.
October’s mini-bounce (+0.86 pp from September) coincided with fall decor and early holiday prep content, a small proof point that tying creative to seasonal moments works in this category, same as it did for Food & Beverages. The challenge is sustaining that approach through the rest of Q4 instead of letting hooks drift back to generic product content.


