
What the data told us
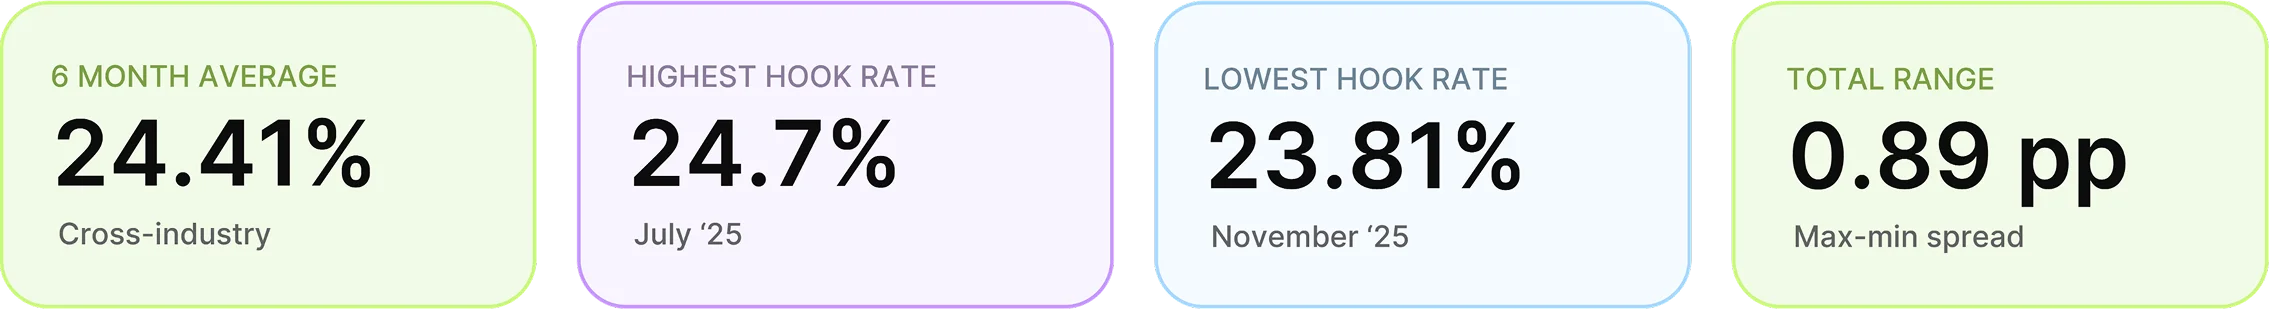
1. Hook rates barely moved all half. The overall average ranged from 23.81% to 24.70% across six months. Less than one percentage point of variation. If your hook rate dropped in H2, it was your creative, not the market.
2. Industry matters more than seasonality. The gap between the best and worst performing industries (8.5 pp) dwarfed the month-to-month variation in the overall average (0.89 pp). Your vertical determines your baseline more than the time of year.
3. Health & Beauty operates in a different tier. At 28.34%, Health & Beauty led by nearly 4 pp. December hit 30.56%, the only time any category broke 30% all half.
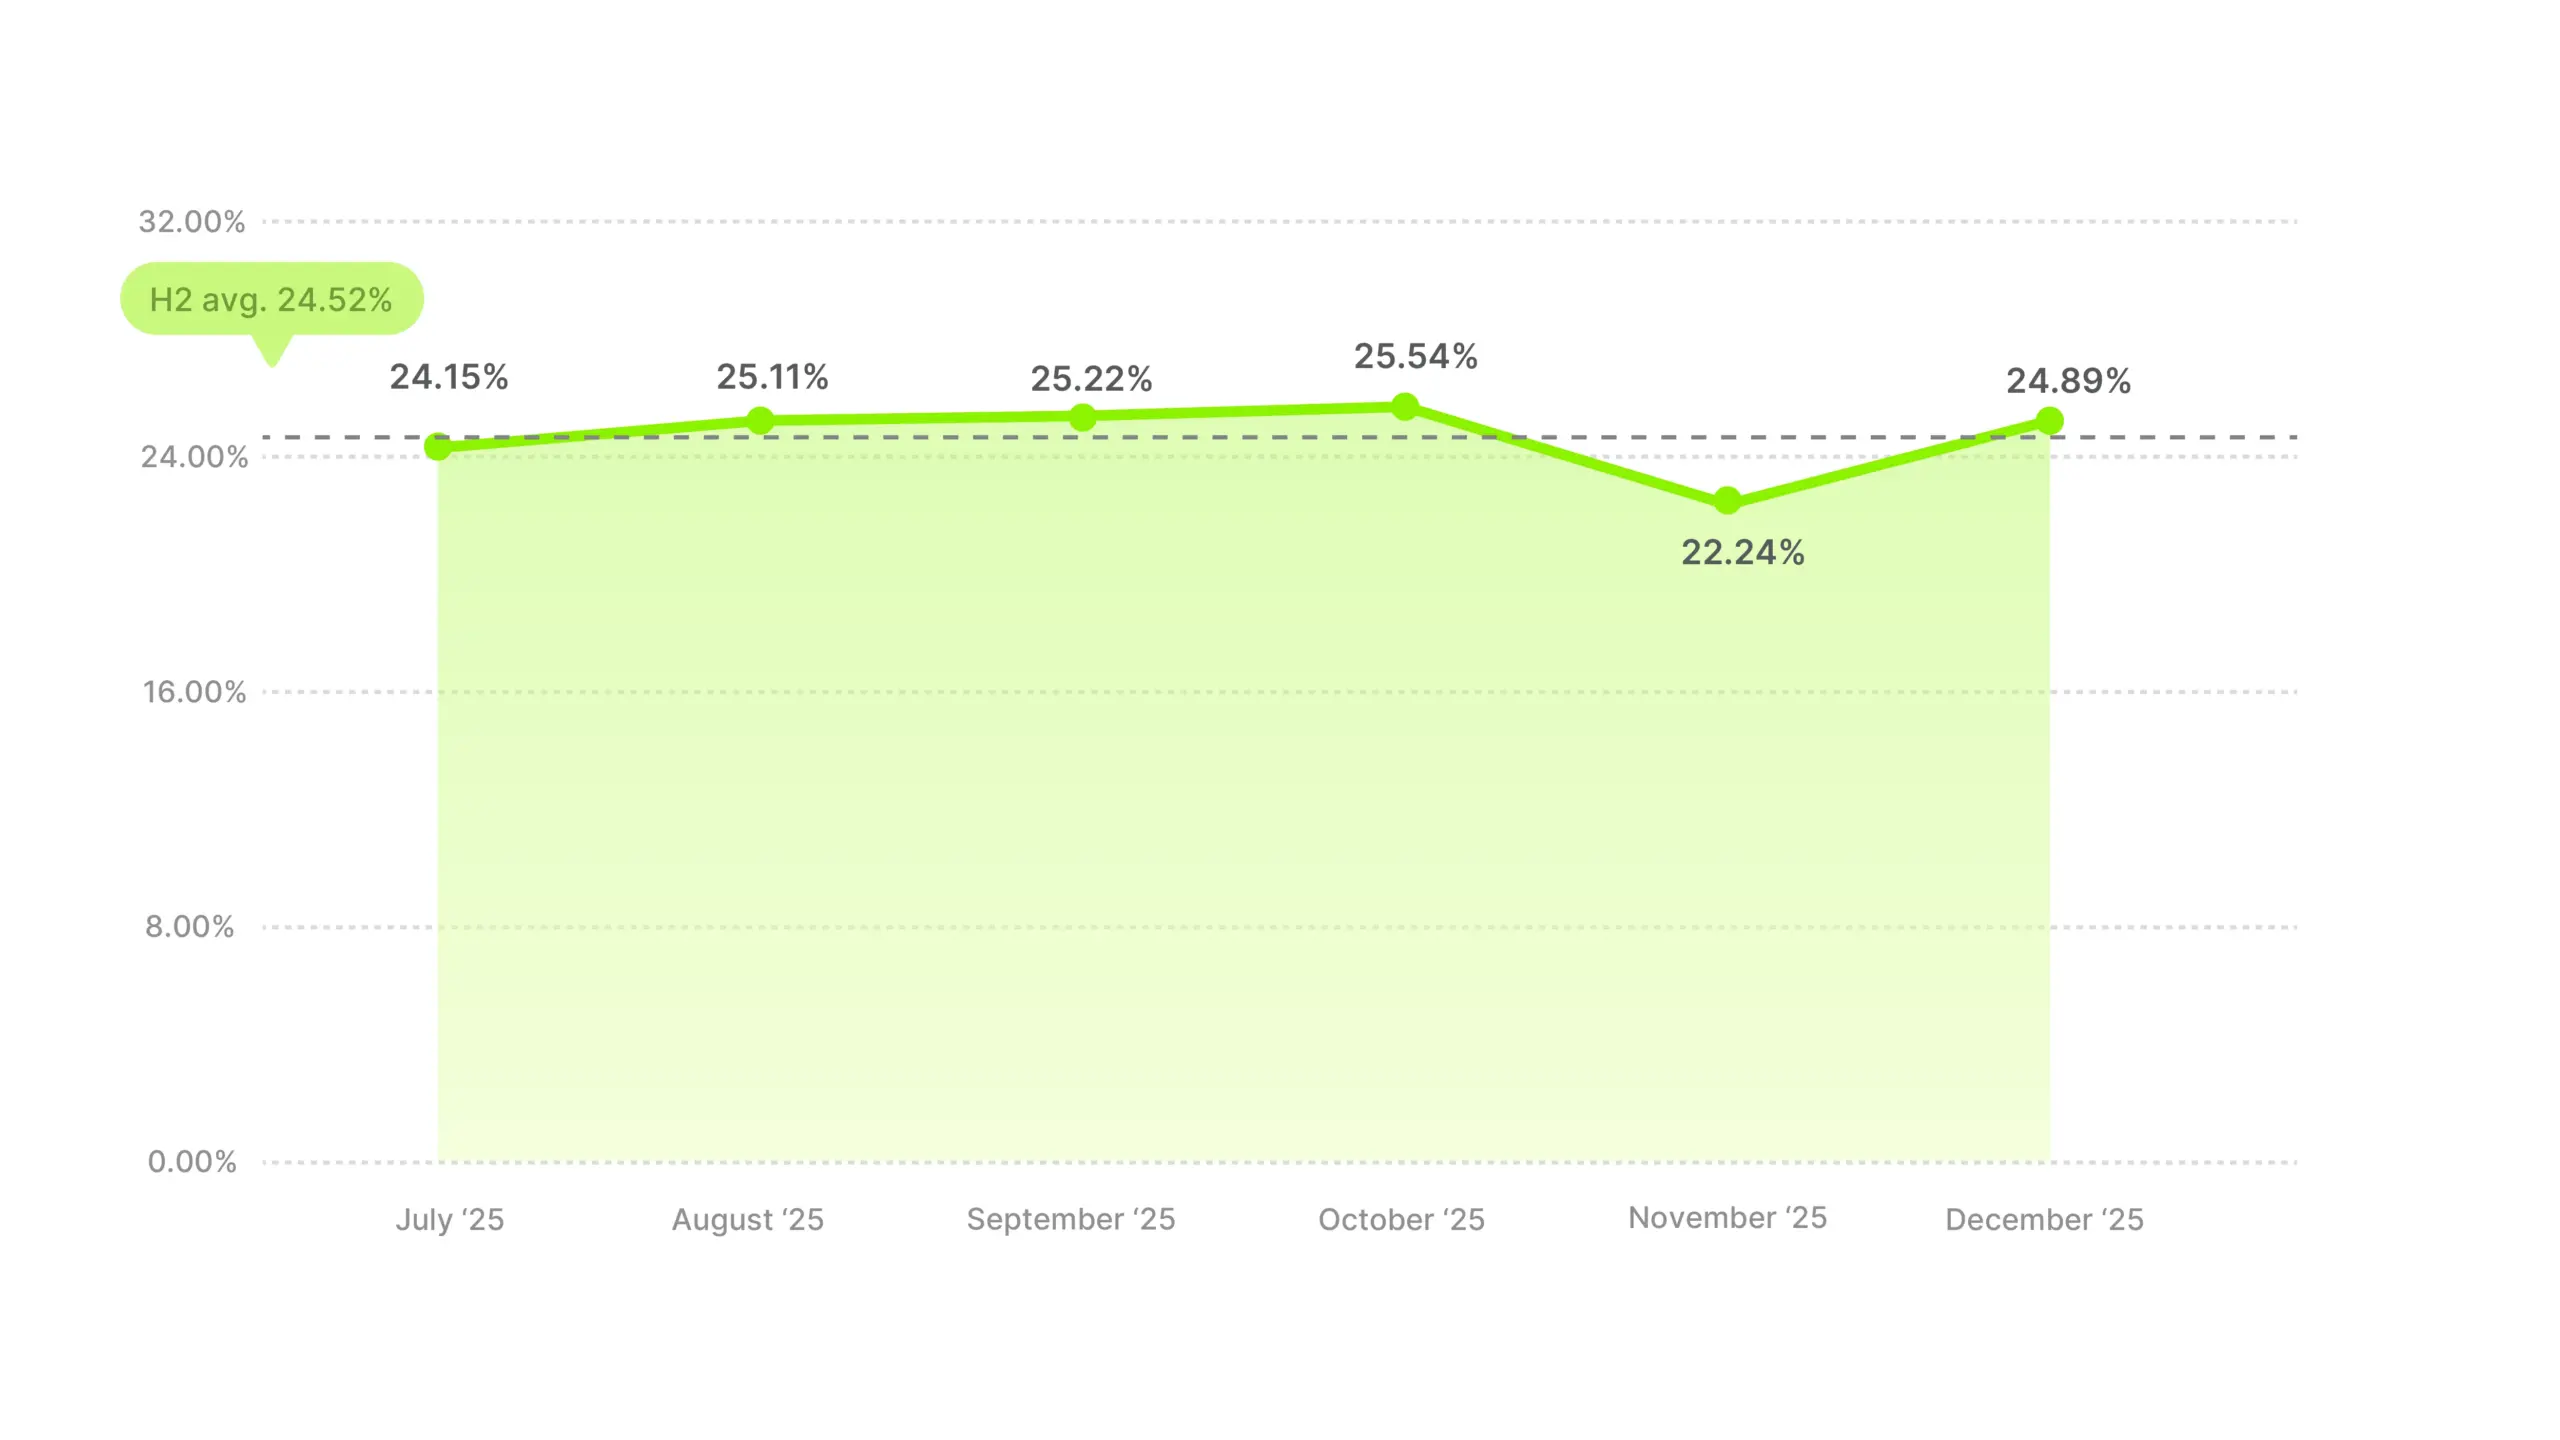
Overall hook rate trend, H2 2025
According to our data, cross-industry hook rate held within a narrow band for the entire H2 period. For a metric aggregated across thousands of advertisers and 14 industries, that kind of consistency points to a stable baseline. Roughly one in four viewers stuck around past the first few seconds of a video ad throughout H2, and that ratio didn’t meaningfully change regardless of what else was happening in the market.
The month-by-month pattern followed a shallow W: a gradual decline from July into September, a partial recovery in October, a sharper November dip, and a December bounce back to near the H2 high.
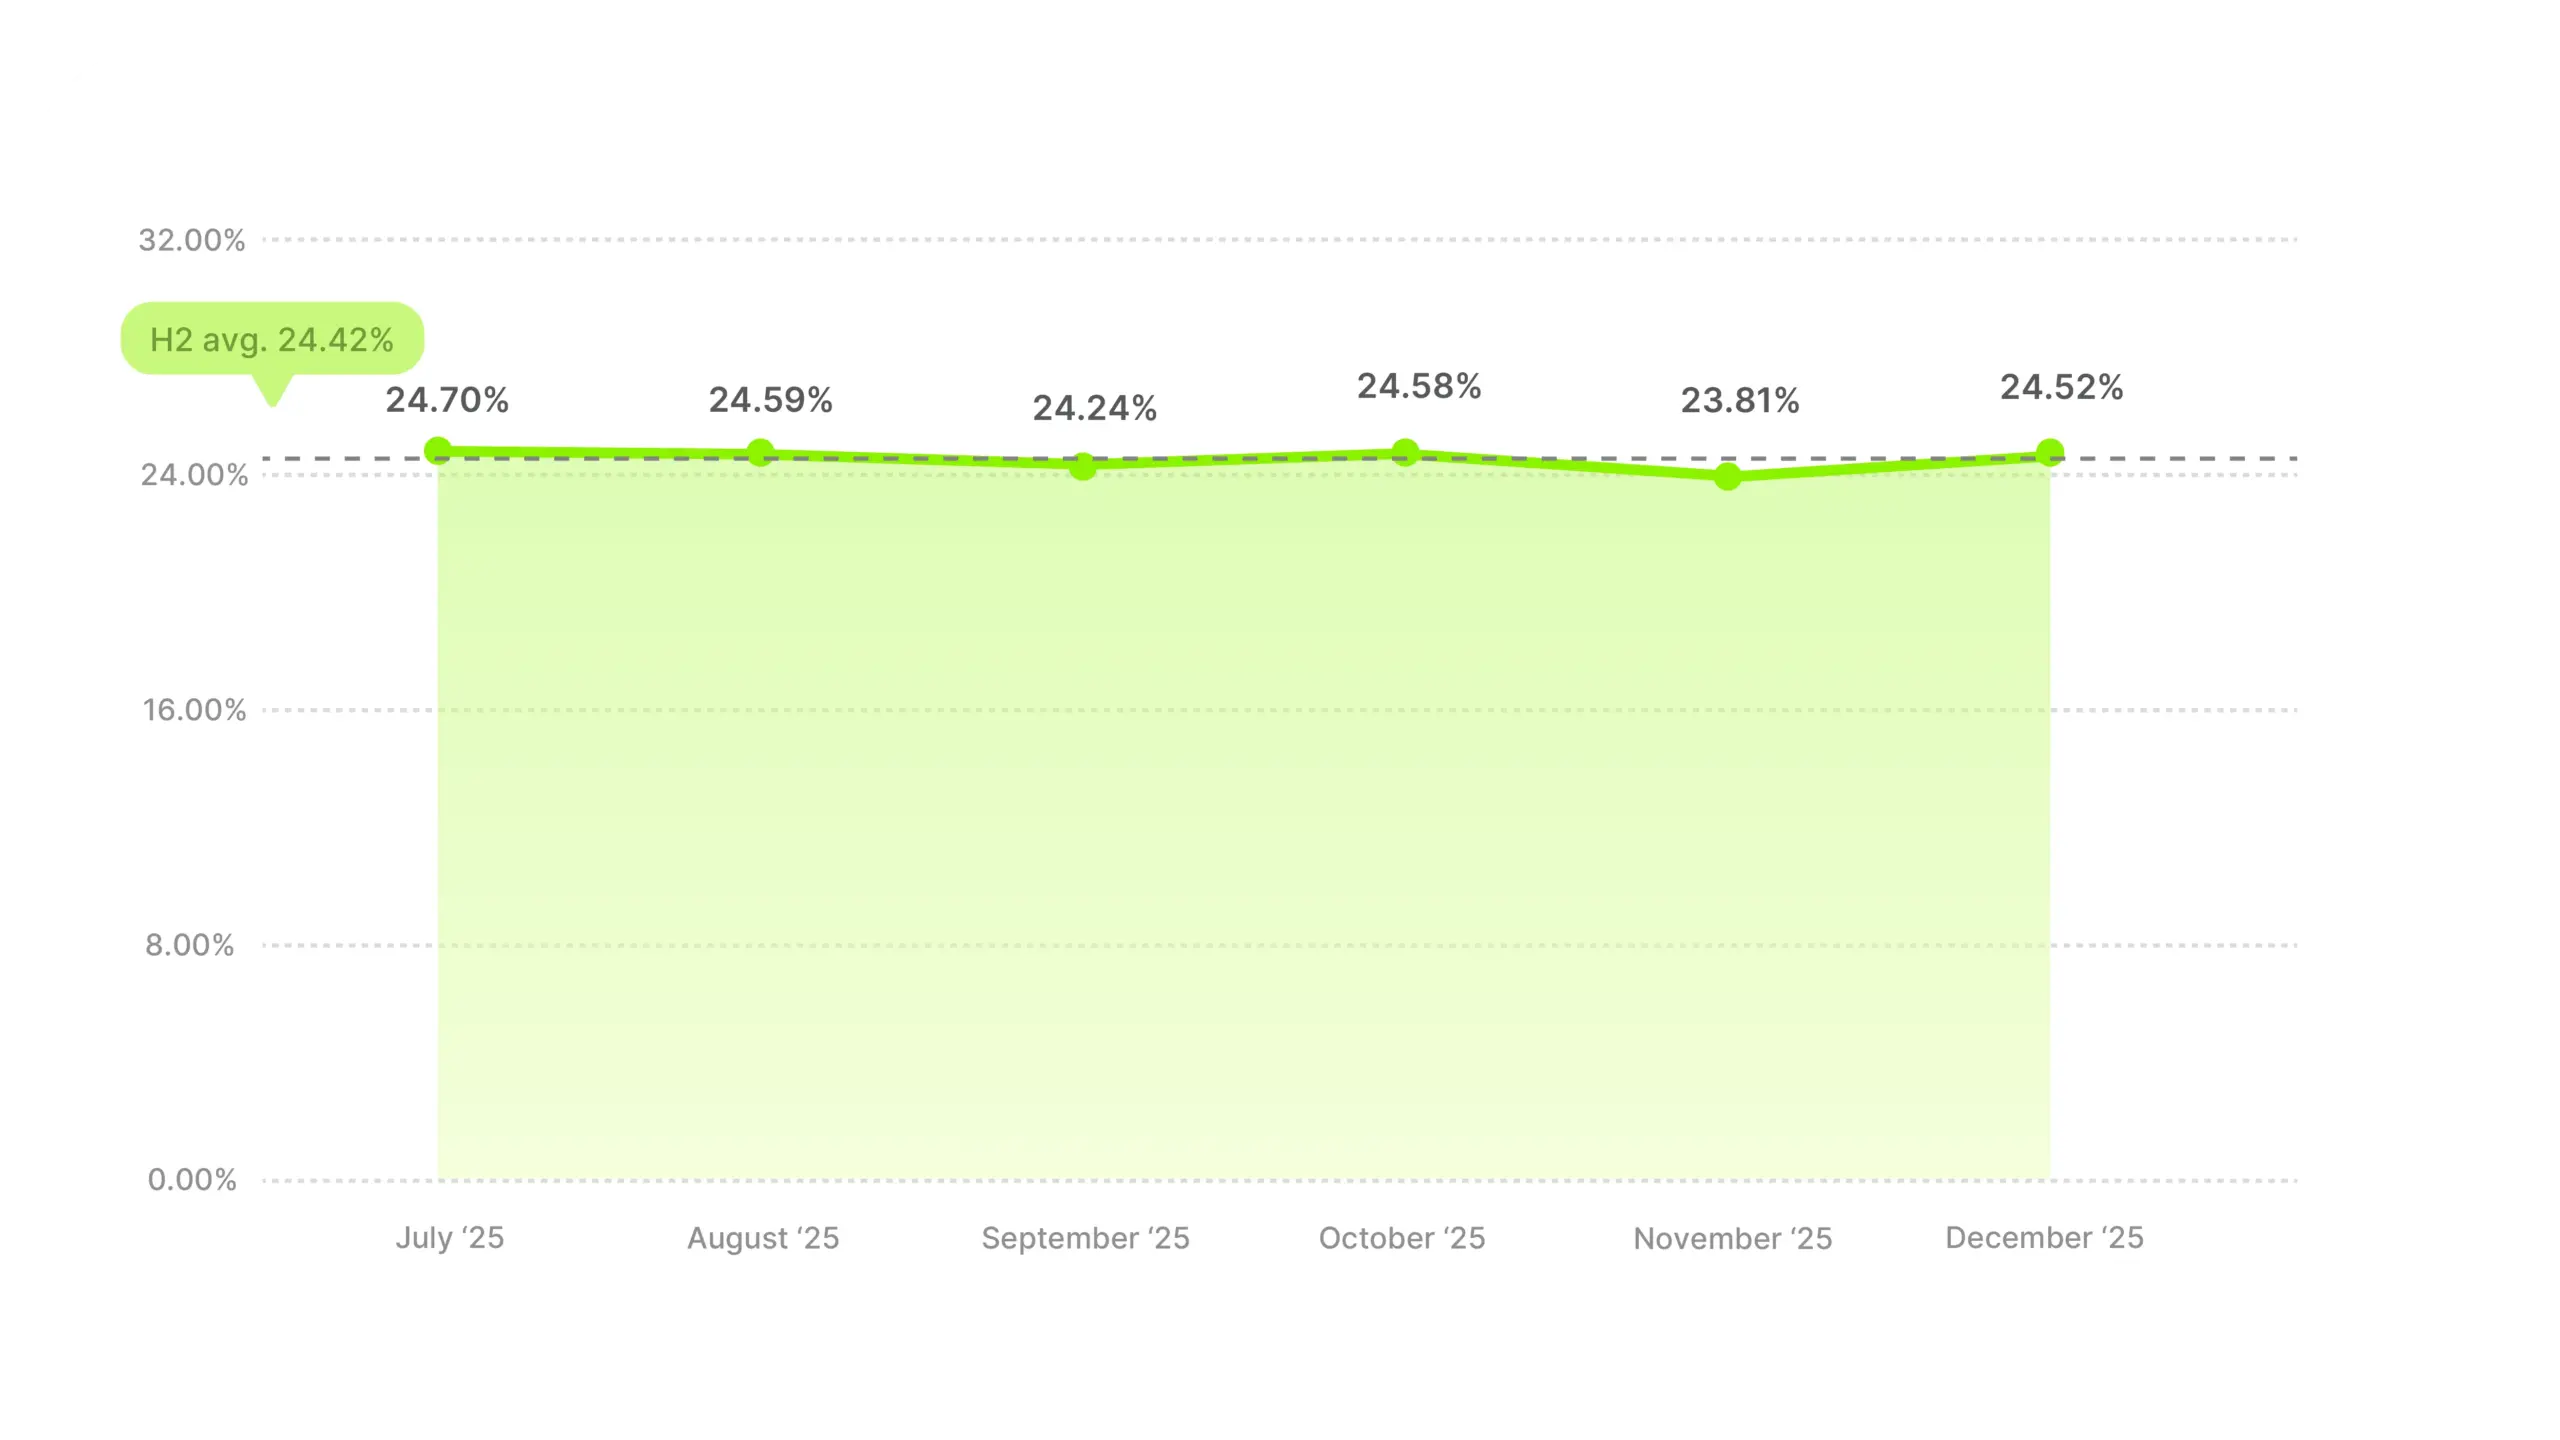
November’s 23.81% gets attention because it’s Black Friday month, but when you look at the full six months, it’s hard to call it a real dip. The overall trend across H2 is remarkably flat, no sharp drops or increases, just a narrow band that the average never really left. Some individual categories felt November more than others, Baby & Toddler dropped over 3 pp and Electronics hit its lowest point, and those stories are worth digging into in the category sections below. But the market as a whole barely registered a change, which means that if your hook rate fell off a cliff in November, it’s probably your creative.
Don’t write off December. Hook rates came back to 24.52% after November’s dip, landing right at the H2 average, which means the month performed about as well as any other in our dataset. If you’re a brand that tends to go dark after Black Friday and wait for January, the data says the audience didn’t leave when you did.
Use ~24.4% as your H2 2025 baseline. If your video ads hooked roughly one in four viewers during this period, you were tracking with the cross-industry average. That gives you a concrete number to benchmark against heading into H1 2026. But the cross-industry number only gets you so far. The real benchmarks are in the industry breakdowns.
Hook rate benchmarks by industry
The cross-industry average of 24.4% in our dataset is useful as a starting point, but it masks an 8.5 percentage point spread between the best and worst performing verticals. That gap is nearly 10x the month-to-month variation in the overall trend, which tells you something important: what industry you’re in shapes your hook rate baseline far more than what month it is.
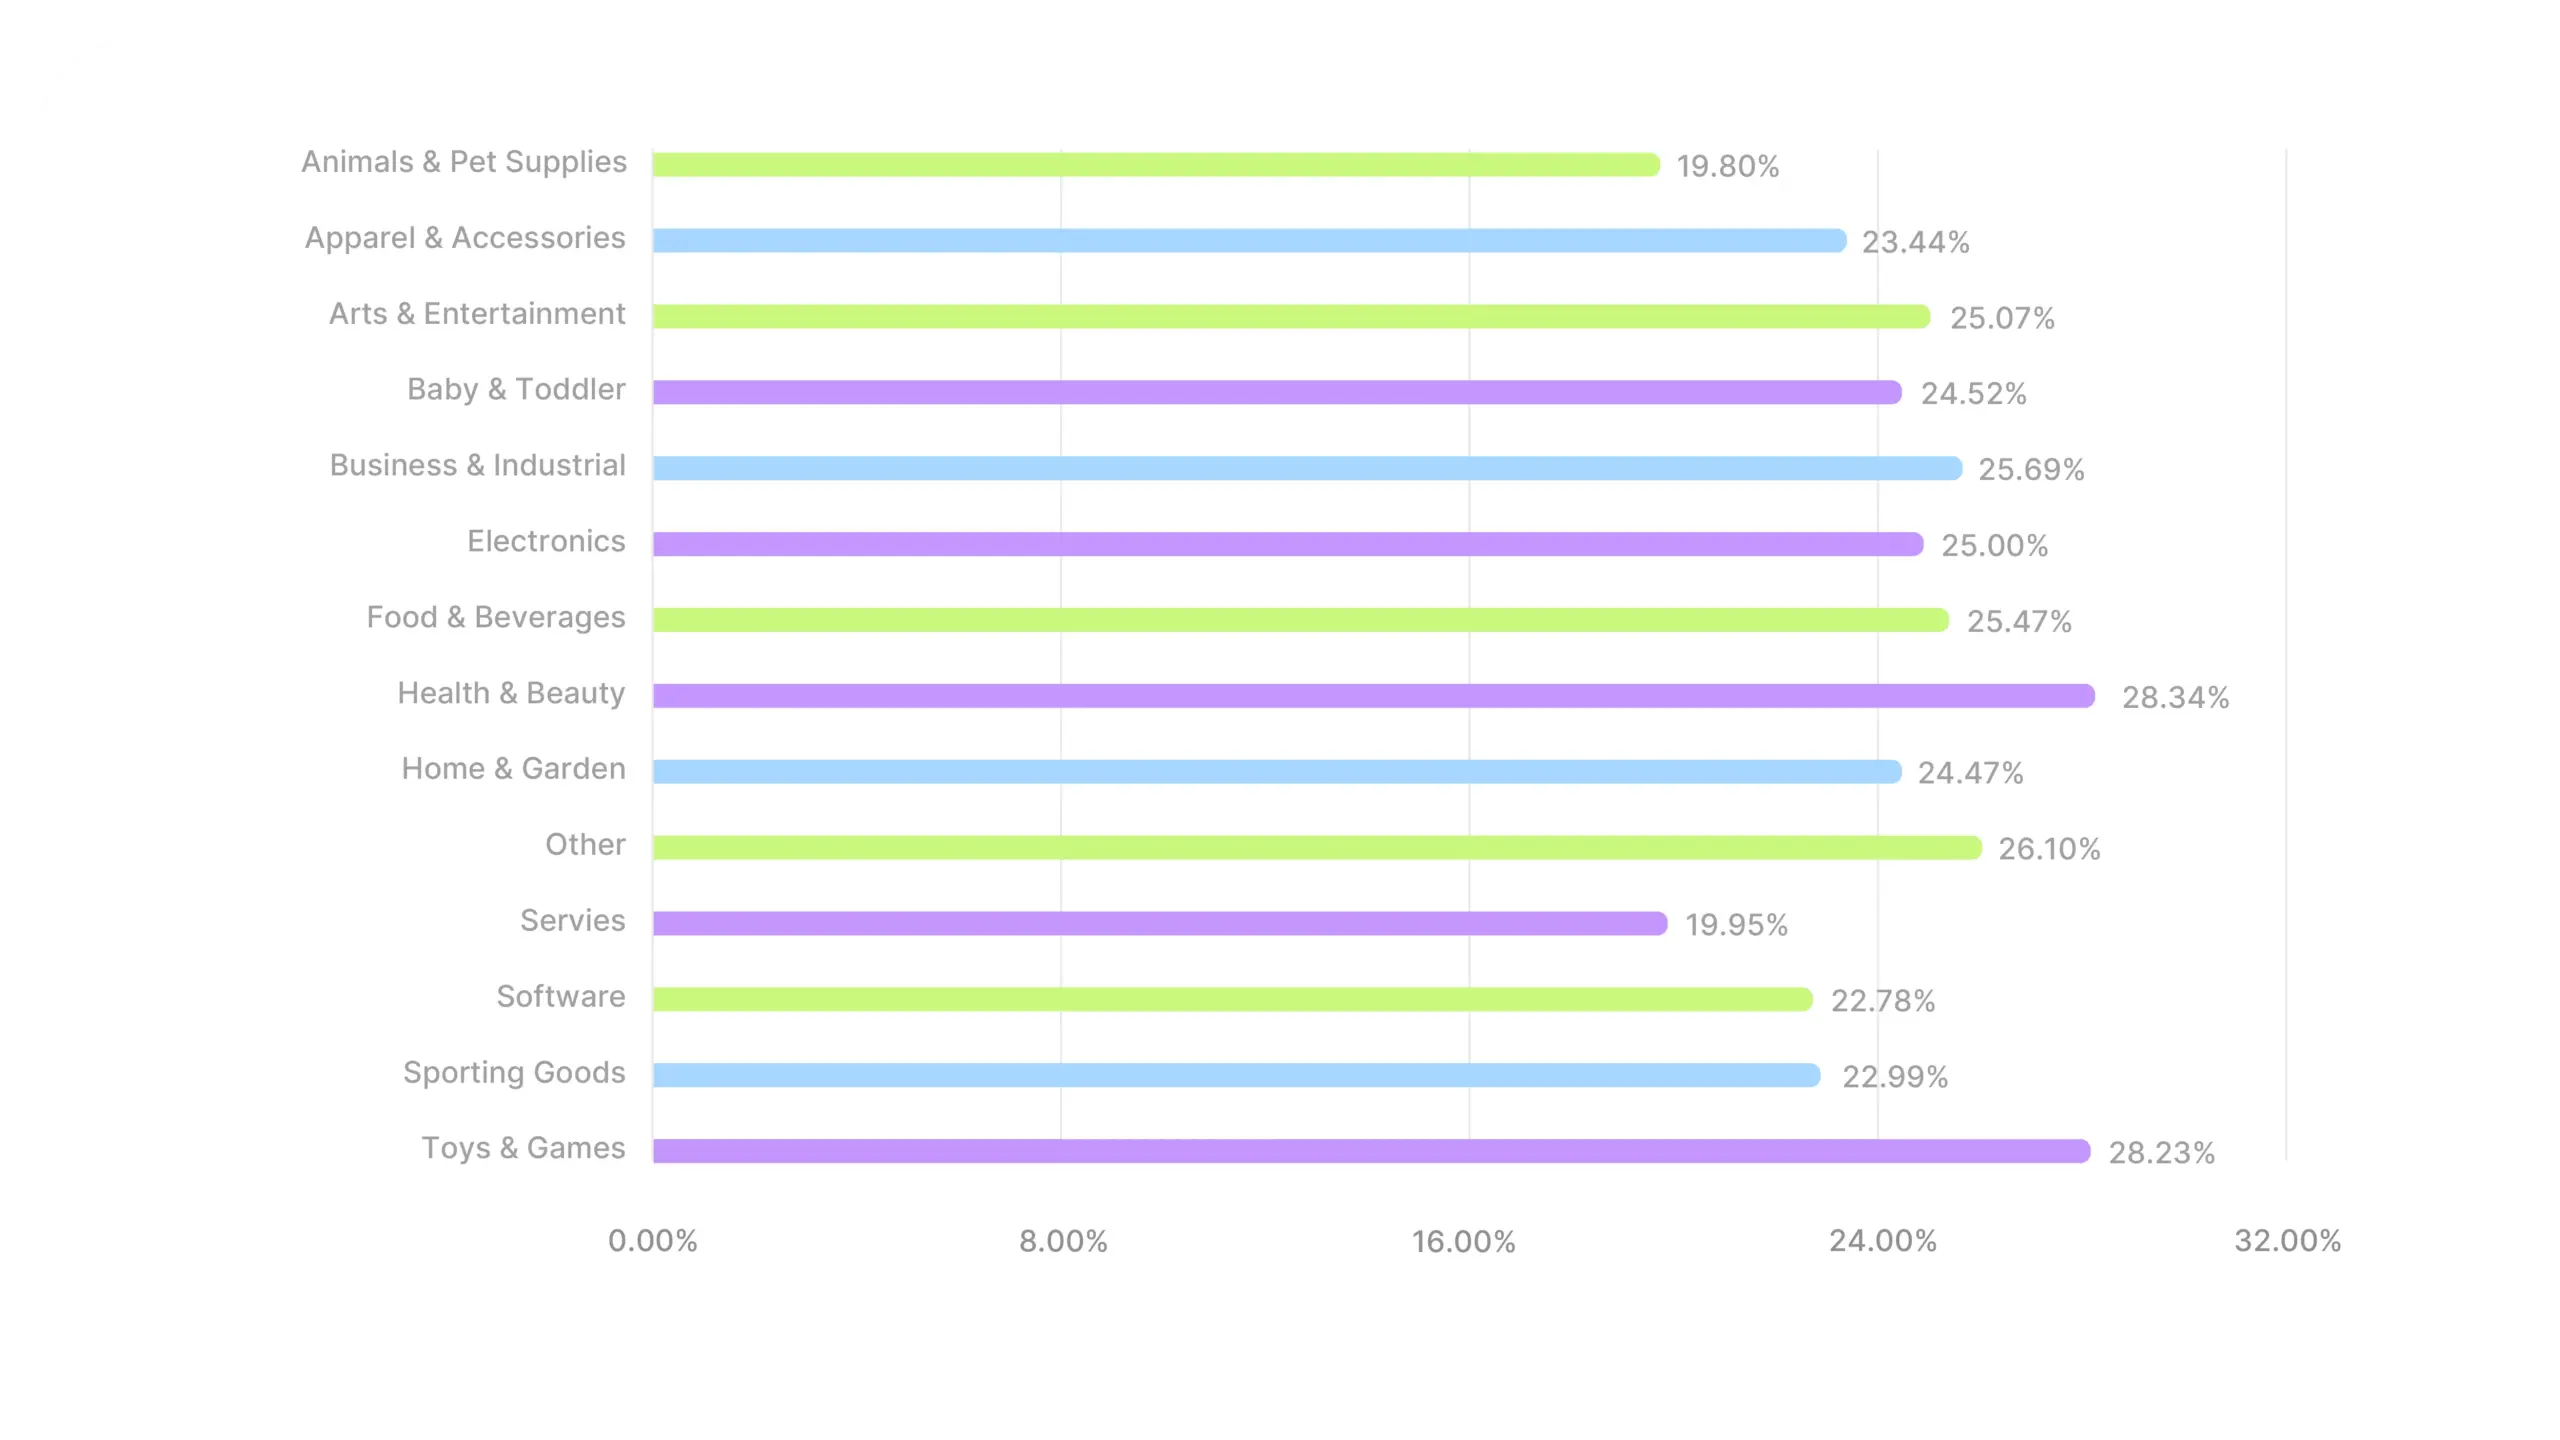
Nine of the thirteen industries fall within roughly 2 pp of the average. The middle of the pack is tight, which makes the outliers more meaningful: Health & Beauty and Toys & Games at the top, Services and Animals & Pet Supplies at the bottom. If you’re in one of those four categories, the cross-industry benchmark doesn’t apply to you; use your own industry’s number.
The categories with the highest hook rates share a common trait: their products can be showcased visually in the first two seconds of a video. A beauty transformation, a toy being played with, food being prepared. Categories that struggle to show their value instantly (Services, Software) sit at the bottom.
That’s a creative format insight worth taking seriously, even outside those specific verticals. It also doesn’t mean lower-performing categories can’t produce strong results with video ads; they just need to work harder to front-load value in a less visually obvious way.
Industry deep dives
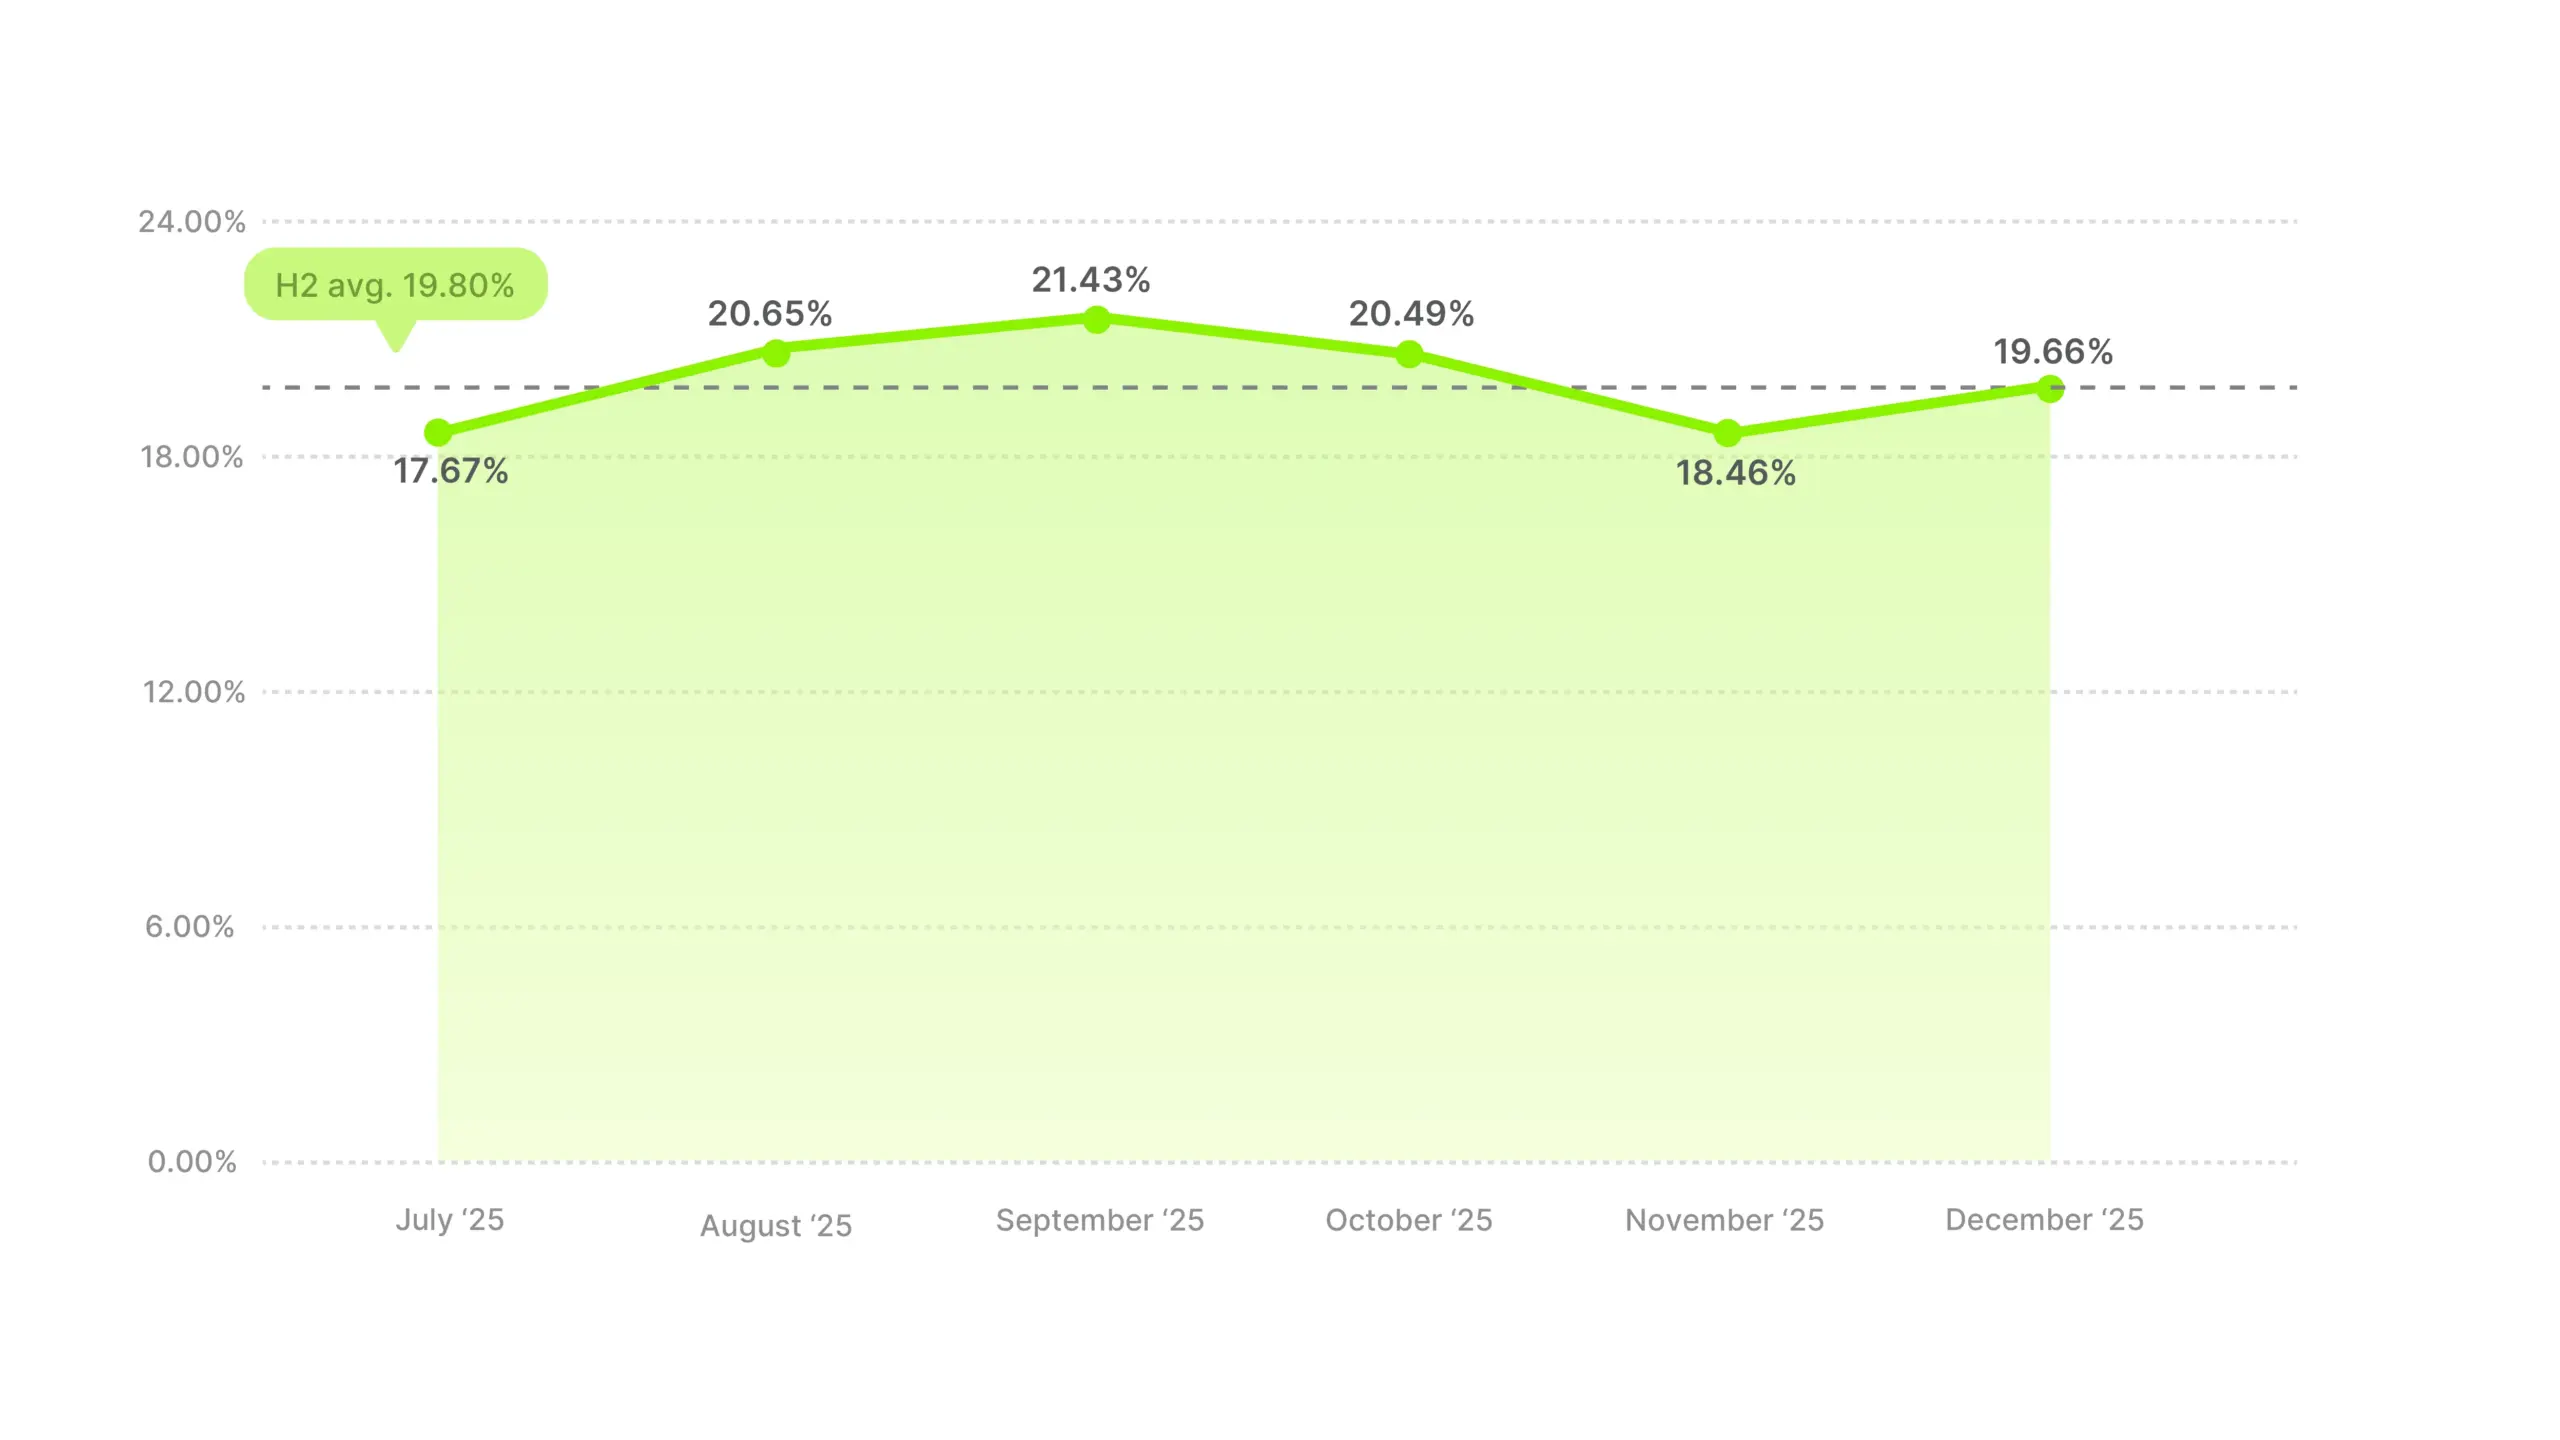
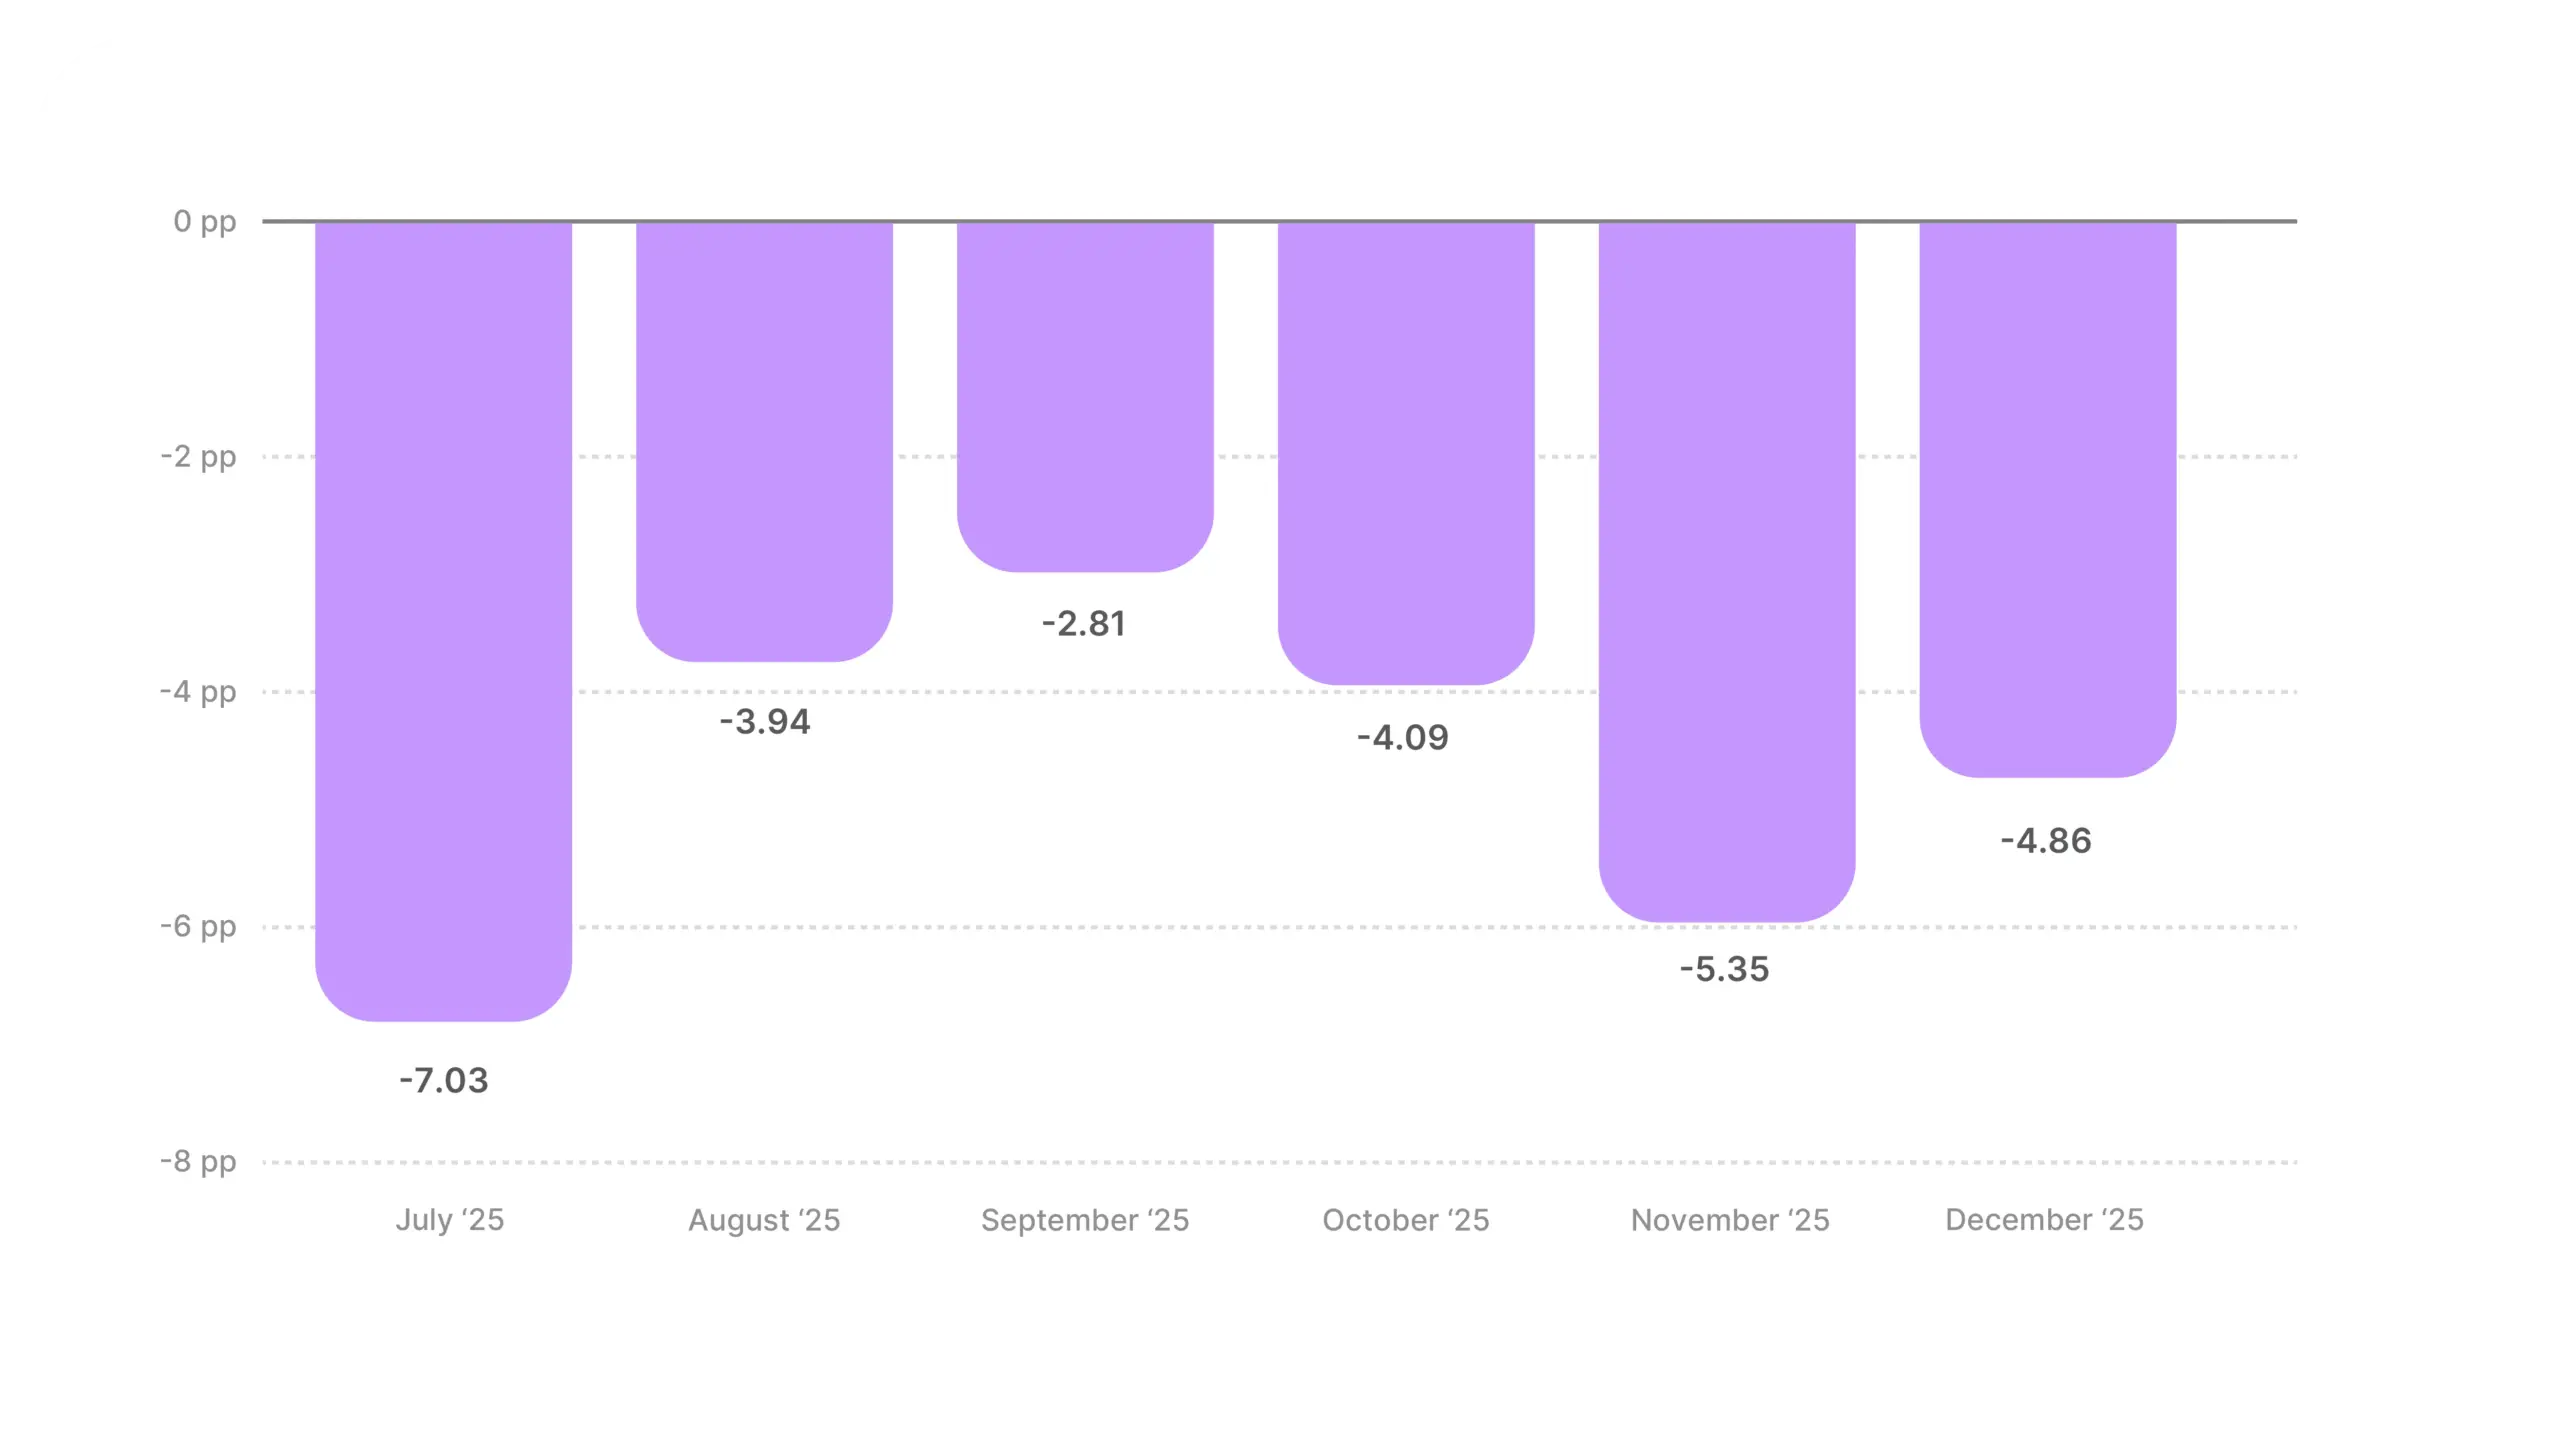
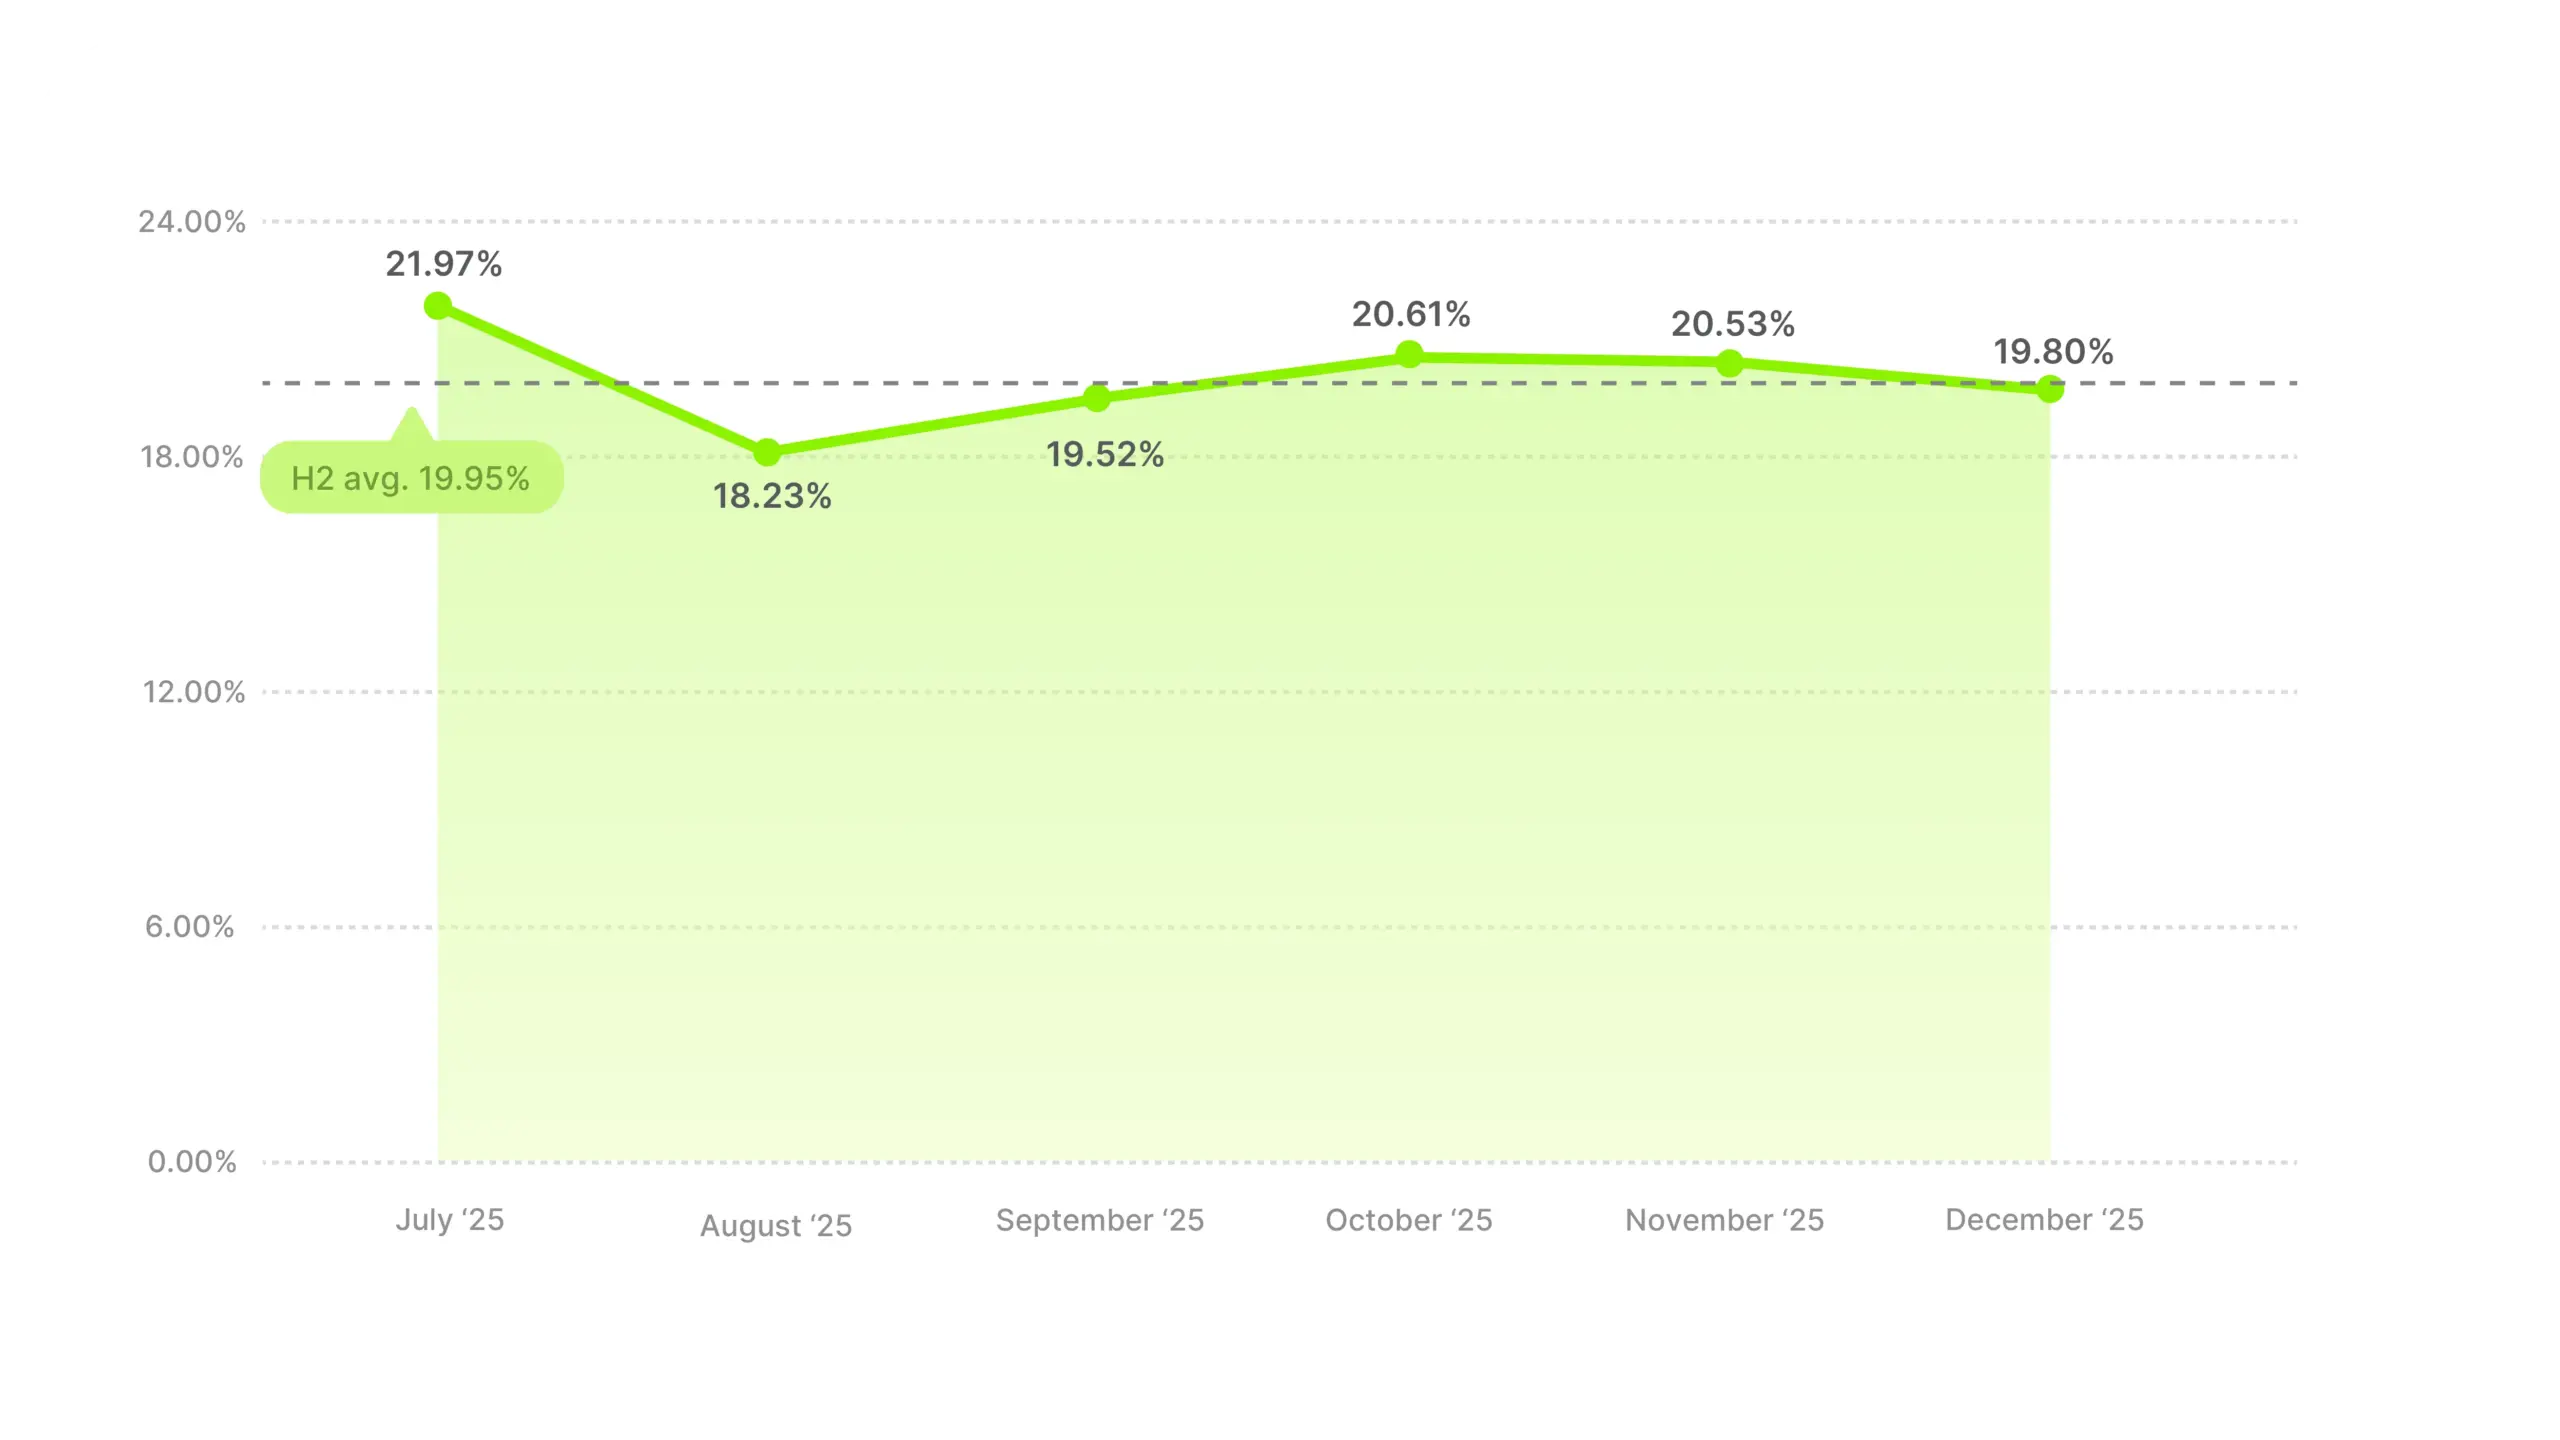
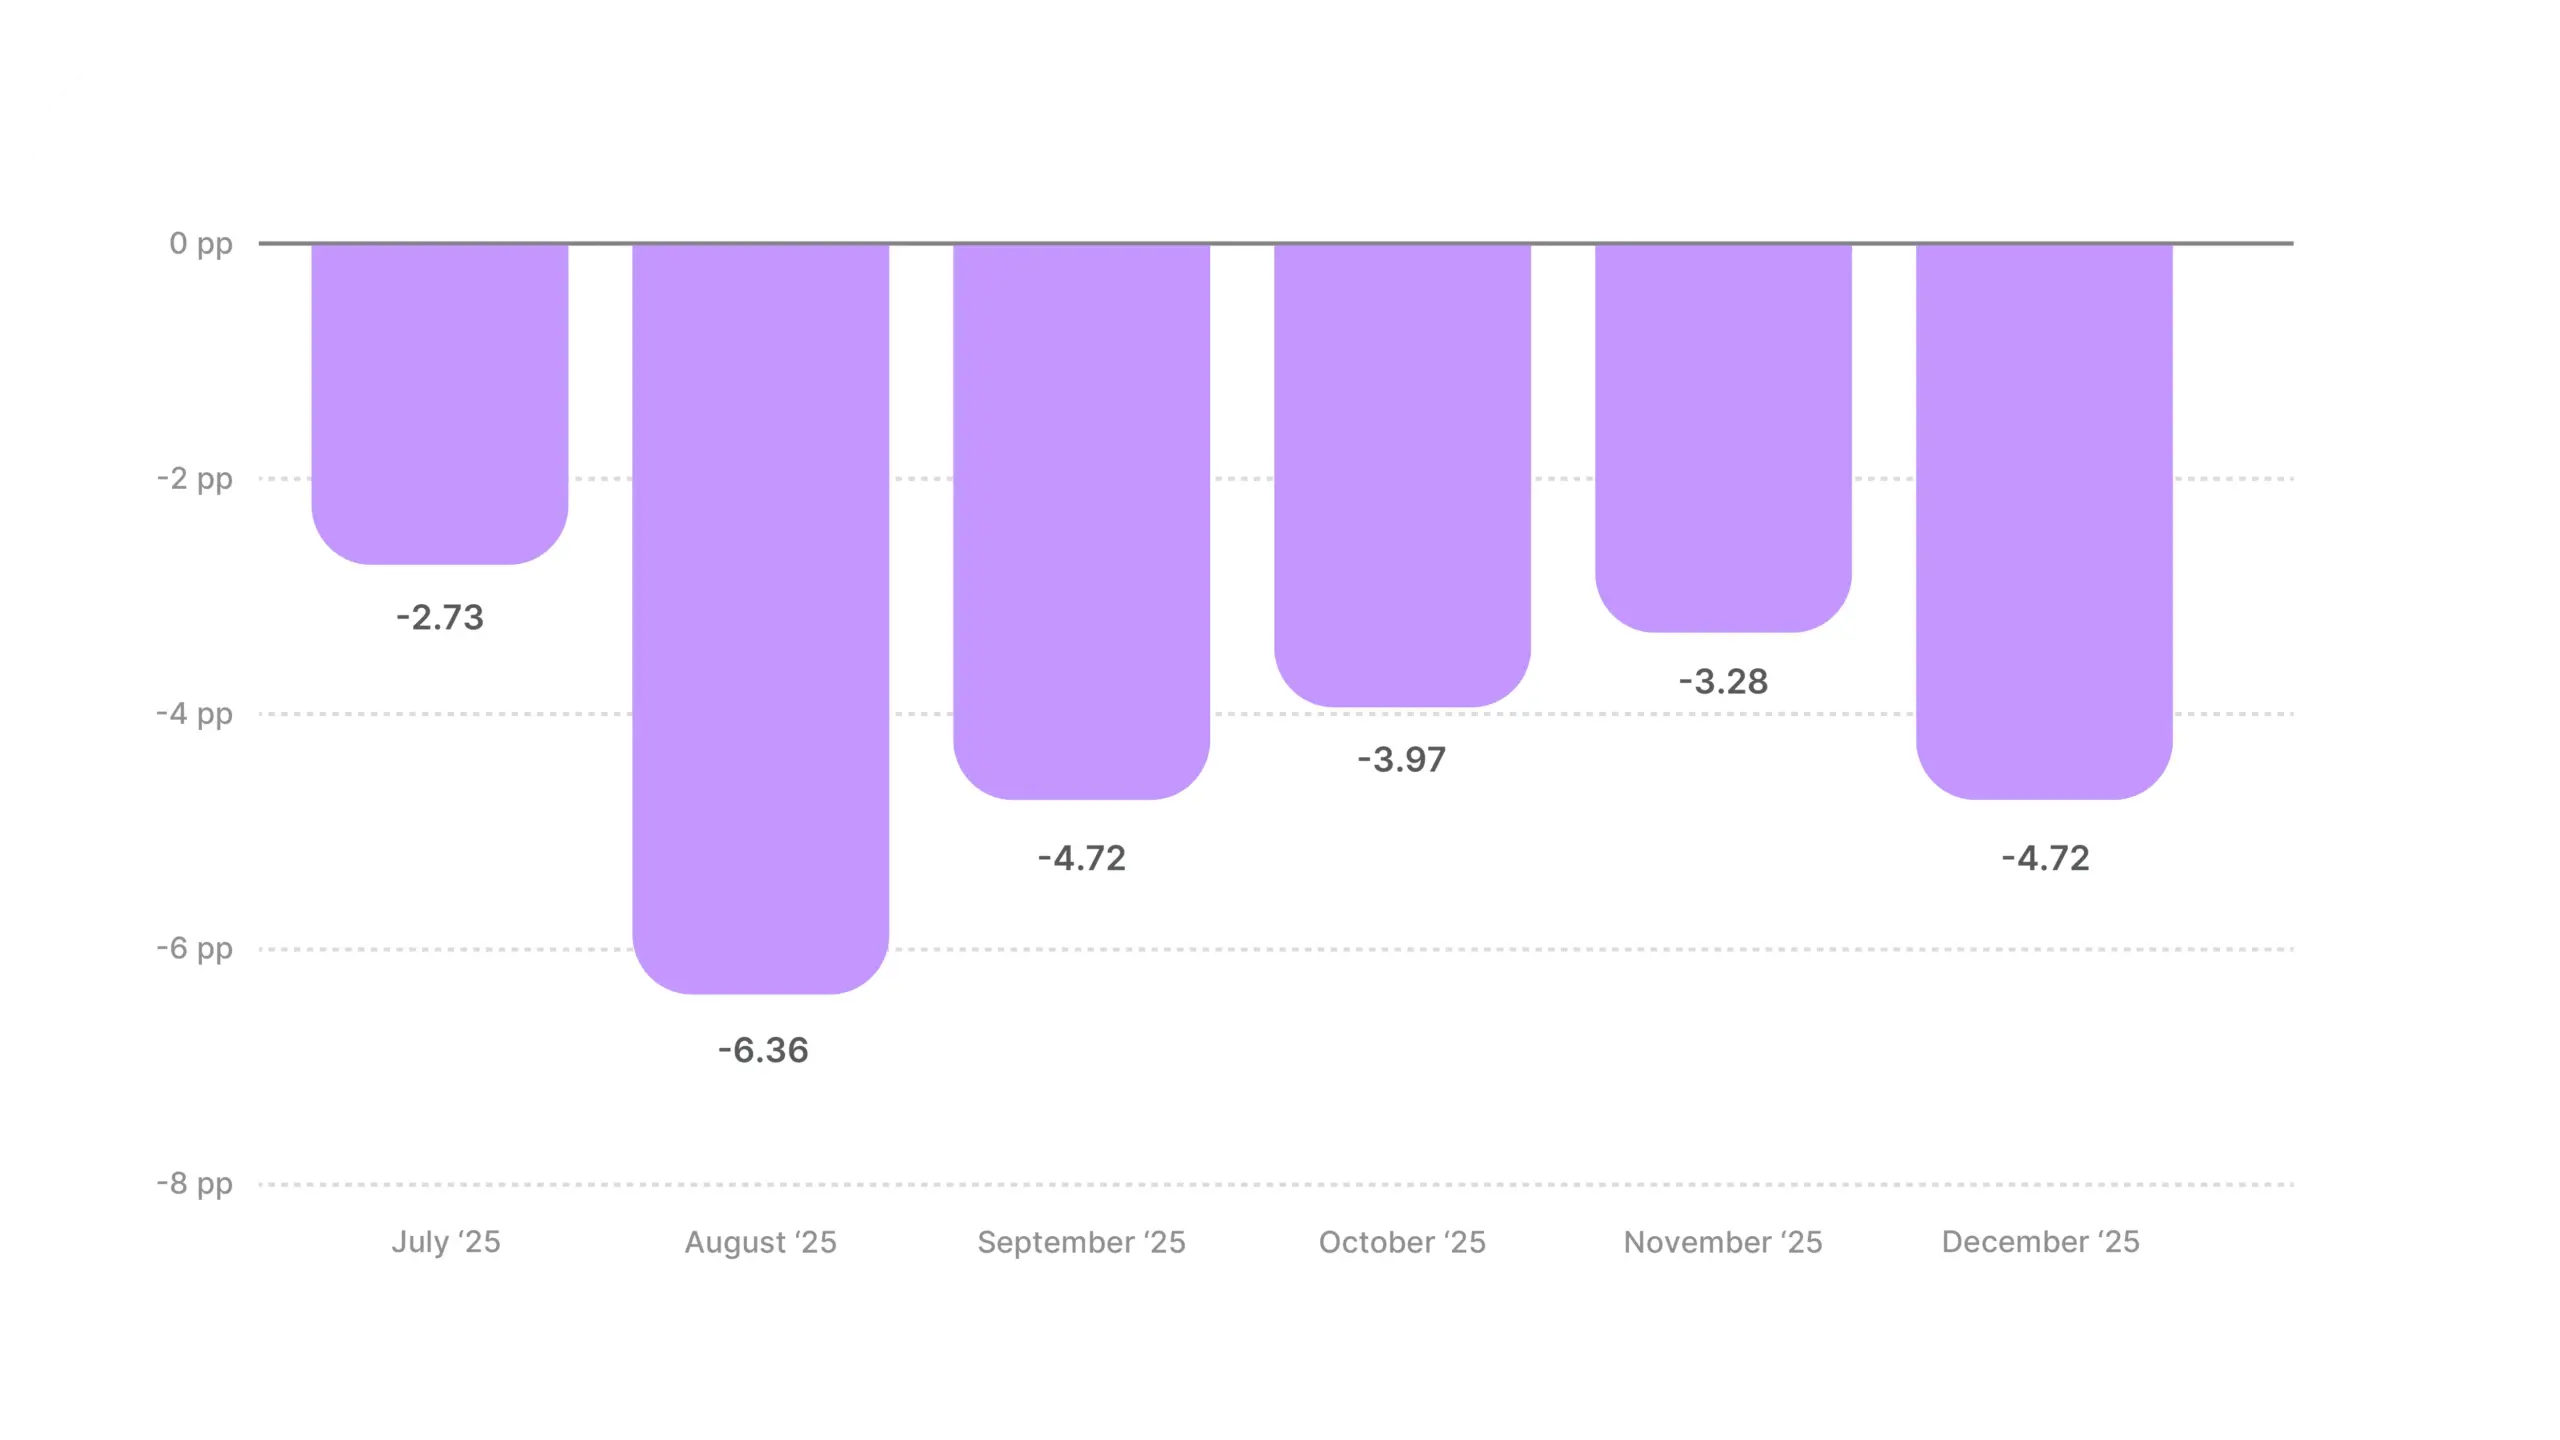
Animals & Pet Supplies has the lowest hook rate in the dataset, sitting roughly 5 pp below the cross-industry average in every single month. This isn’t a “some months are bad” situation. It’s a category-level challenge.
Industry hook rate average
Distance from all-industry average
The July-to-September climb is worth noting. Hook rates rose nearly 4 pp in two months (17.67% to 21.43%). Something worked during that period, whether it was creative experimentation, seasonal pet content, new strong advertisers entering the market. Understanding what drove that improvement matters, because the gains didn’t stick. October through November gave it all back.
Pet videos are some of the most reliably viral organic content on every platform, so the gap between how well pet content performs organically and how poorly it hooks in paid ads is worth investigating. If your brand is consistently above 20%, you’re already outperforming the category.
Apparel sits just under a full percentage point below the cross-industry average, which is a surprising underperformance for one of the most inherently visual product categories. But the real story is the seasonal trend, because it runs completely counter to the overall market.
Industry hook rate average
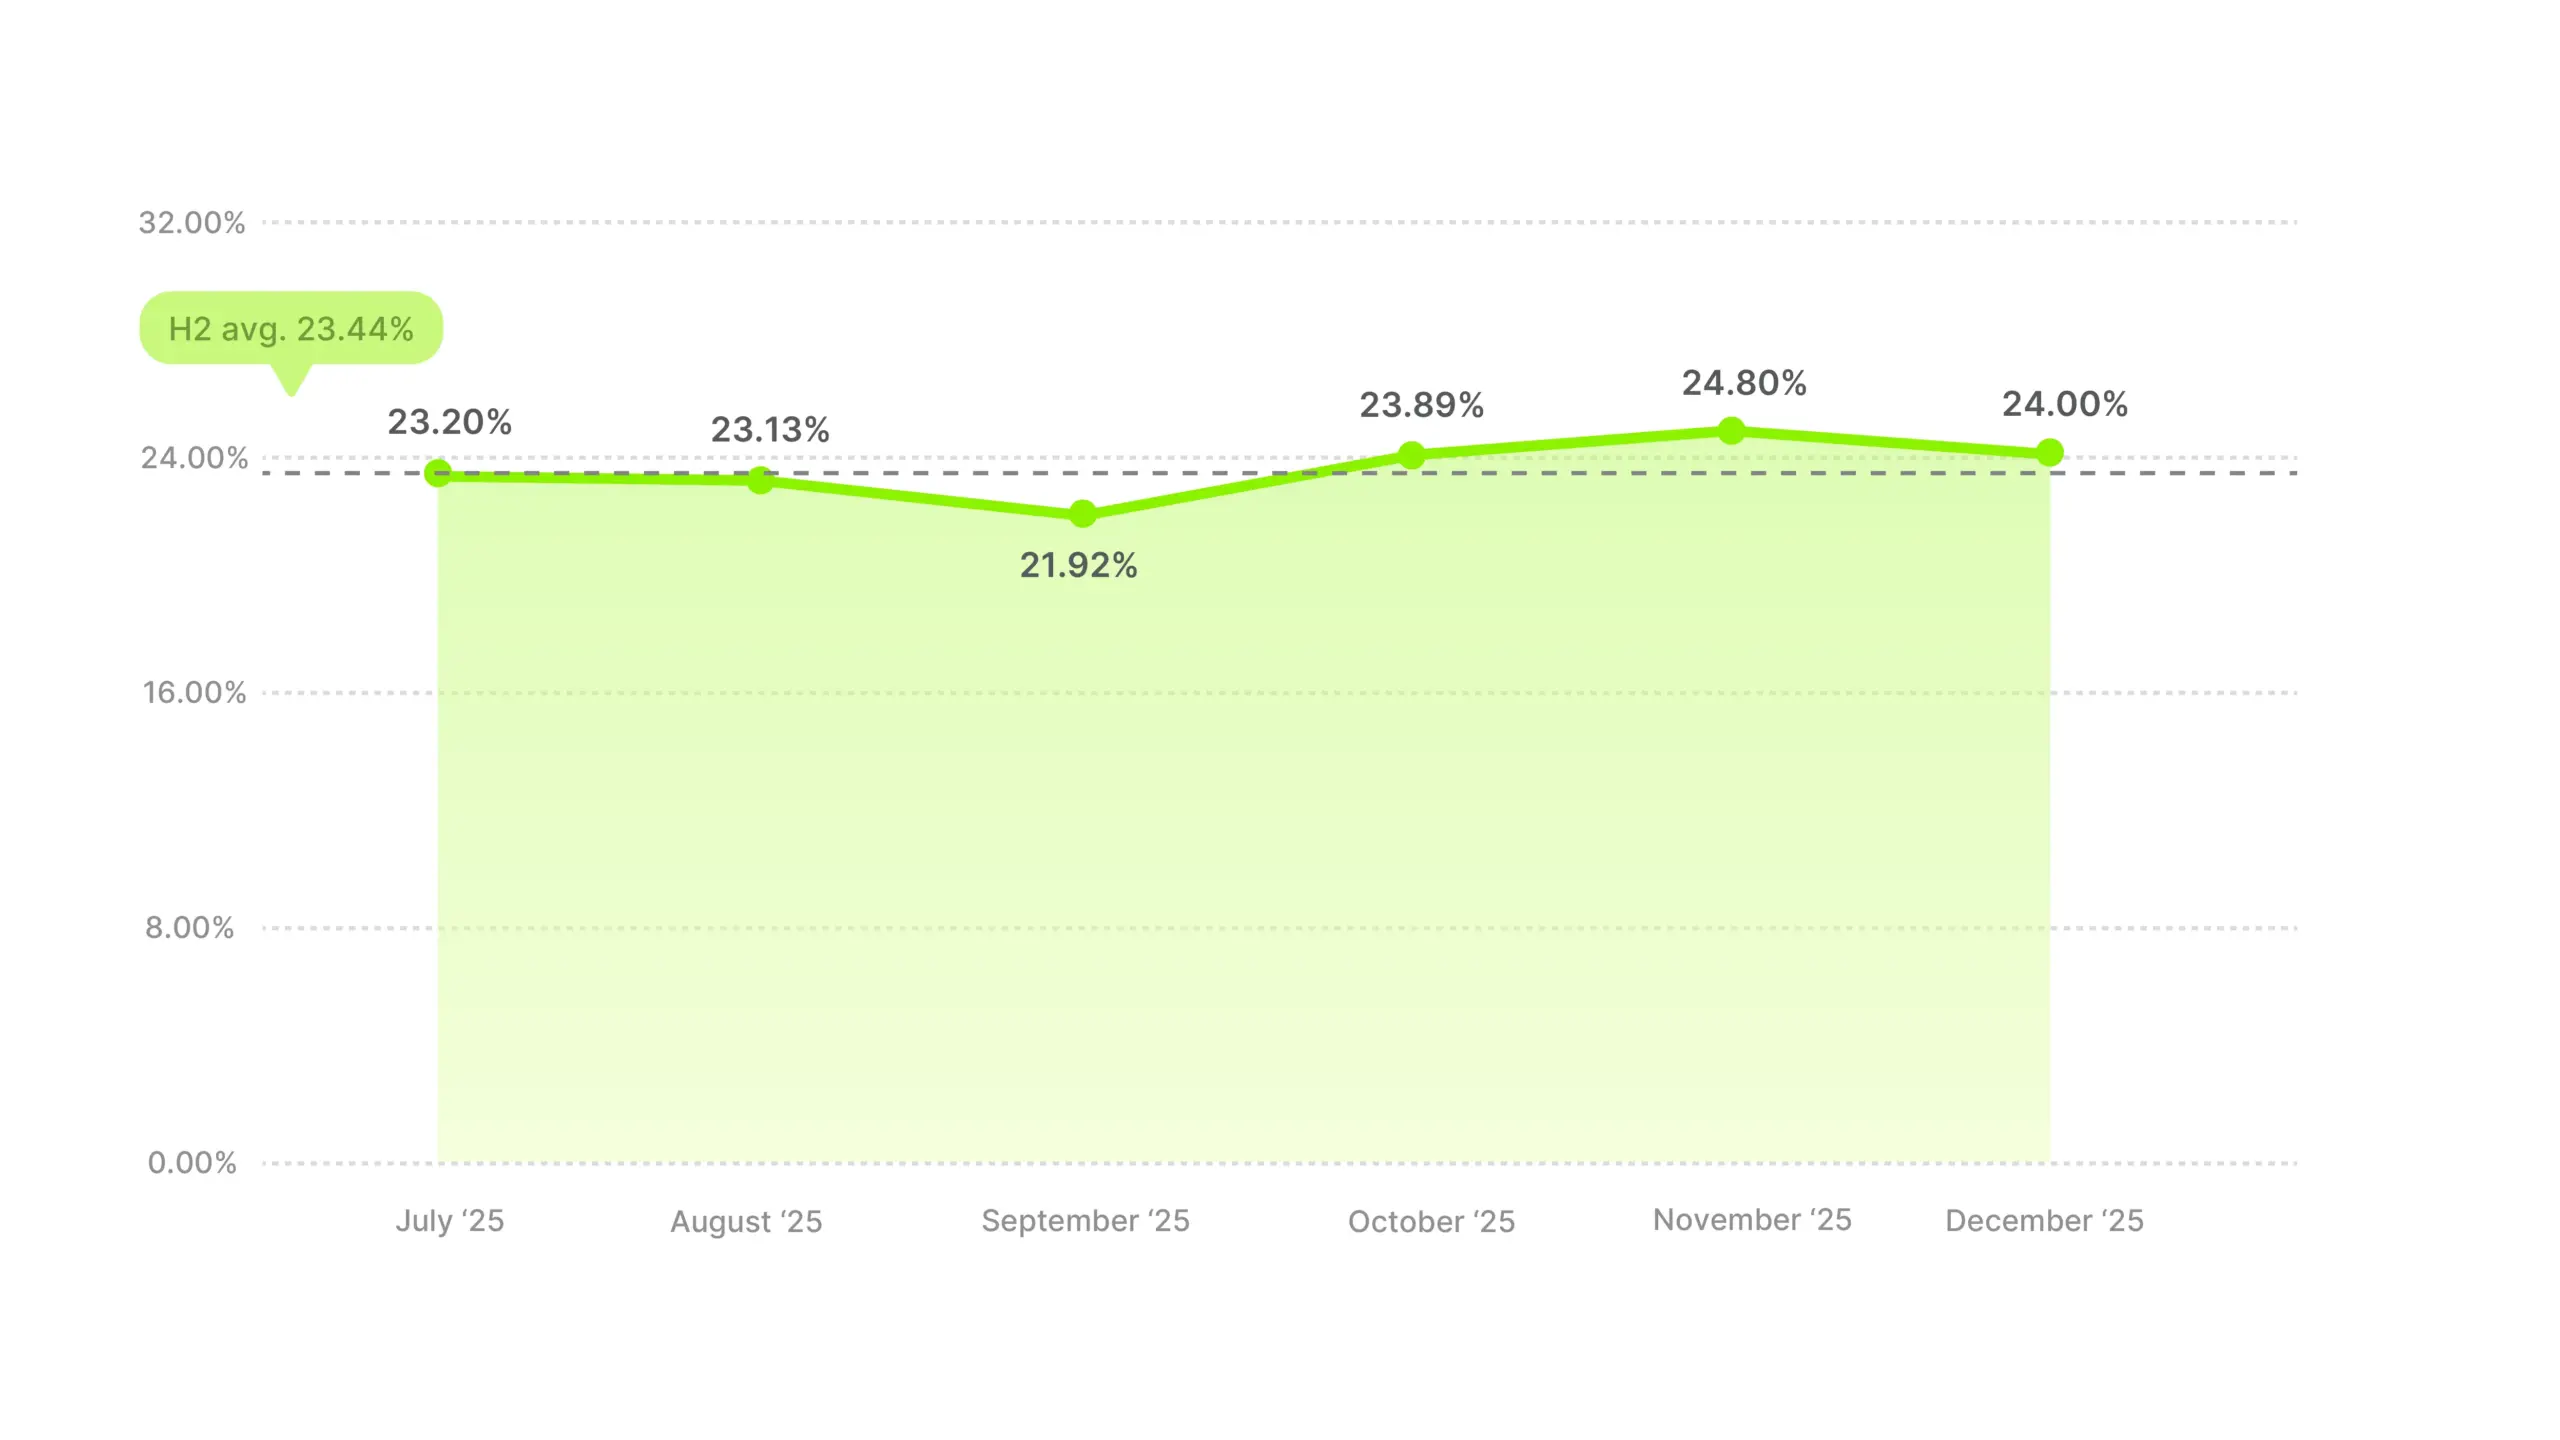
Distance from all-industry average
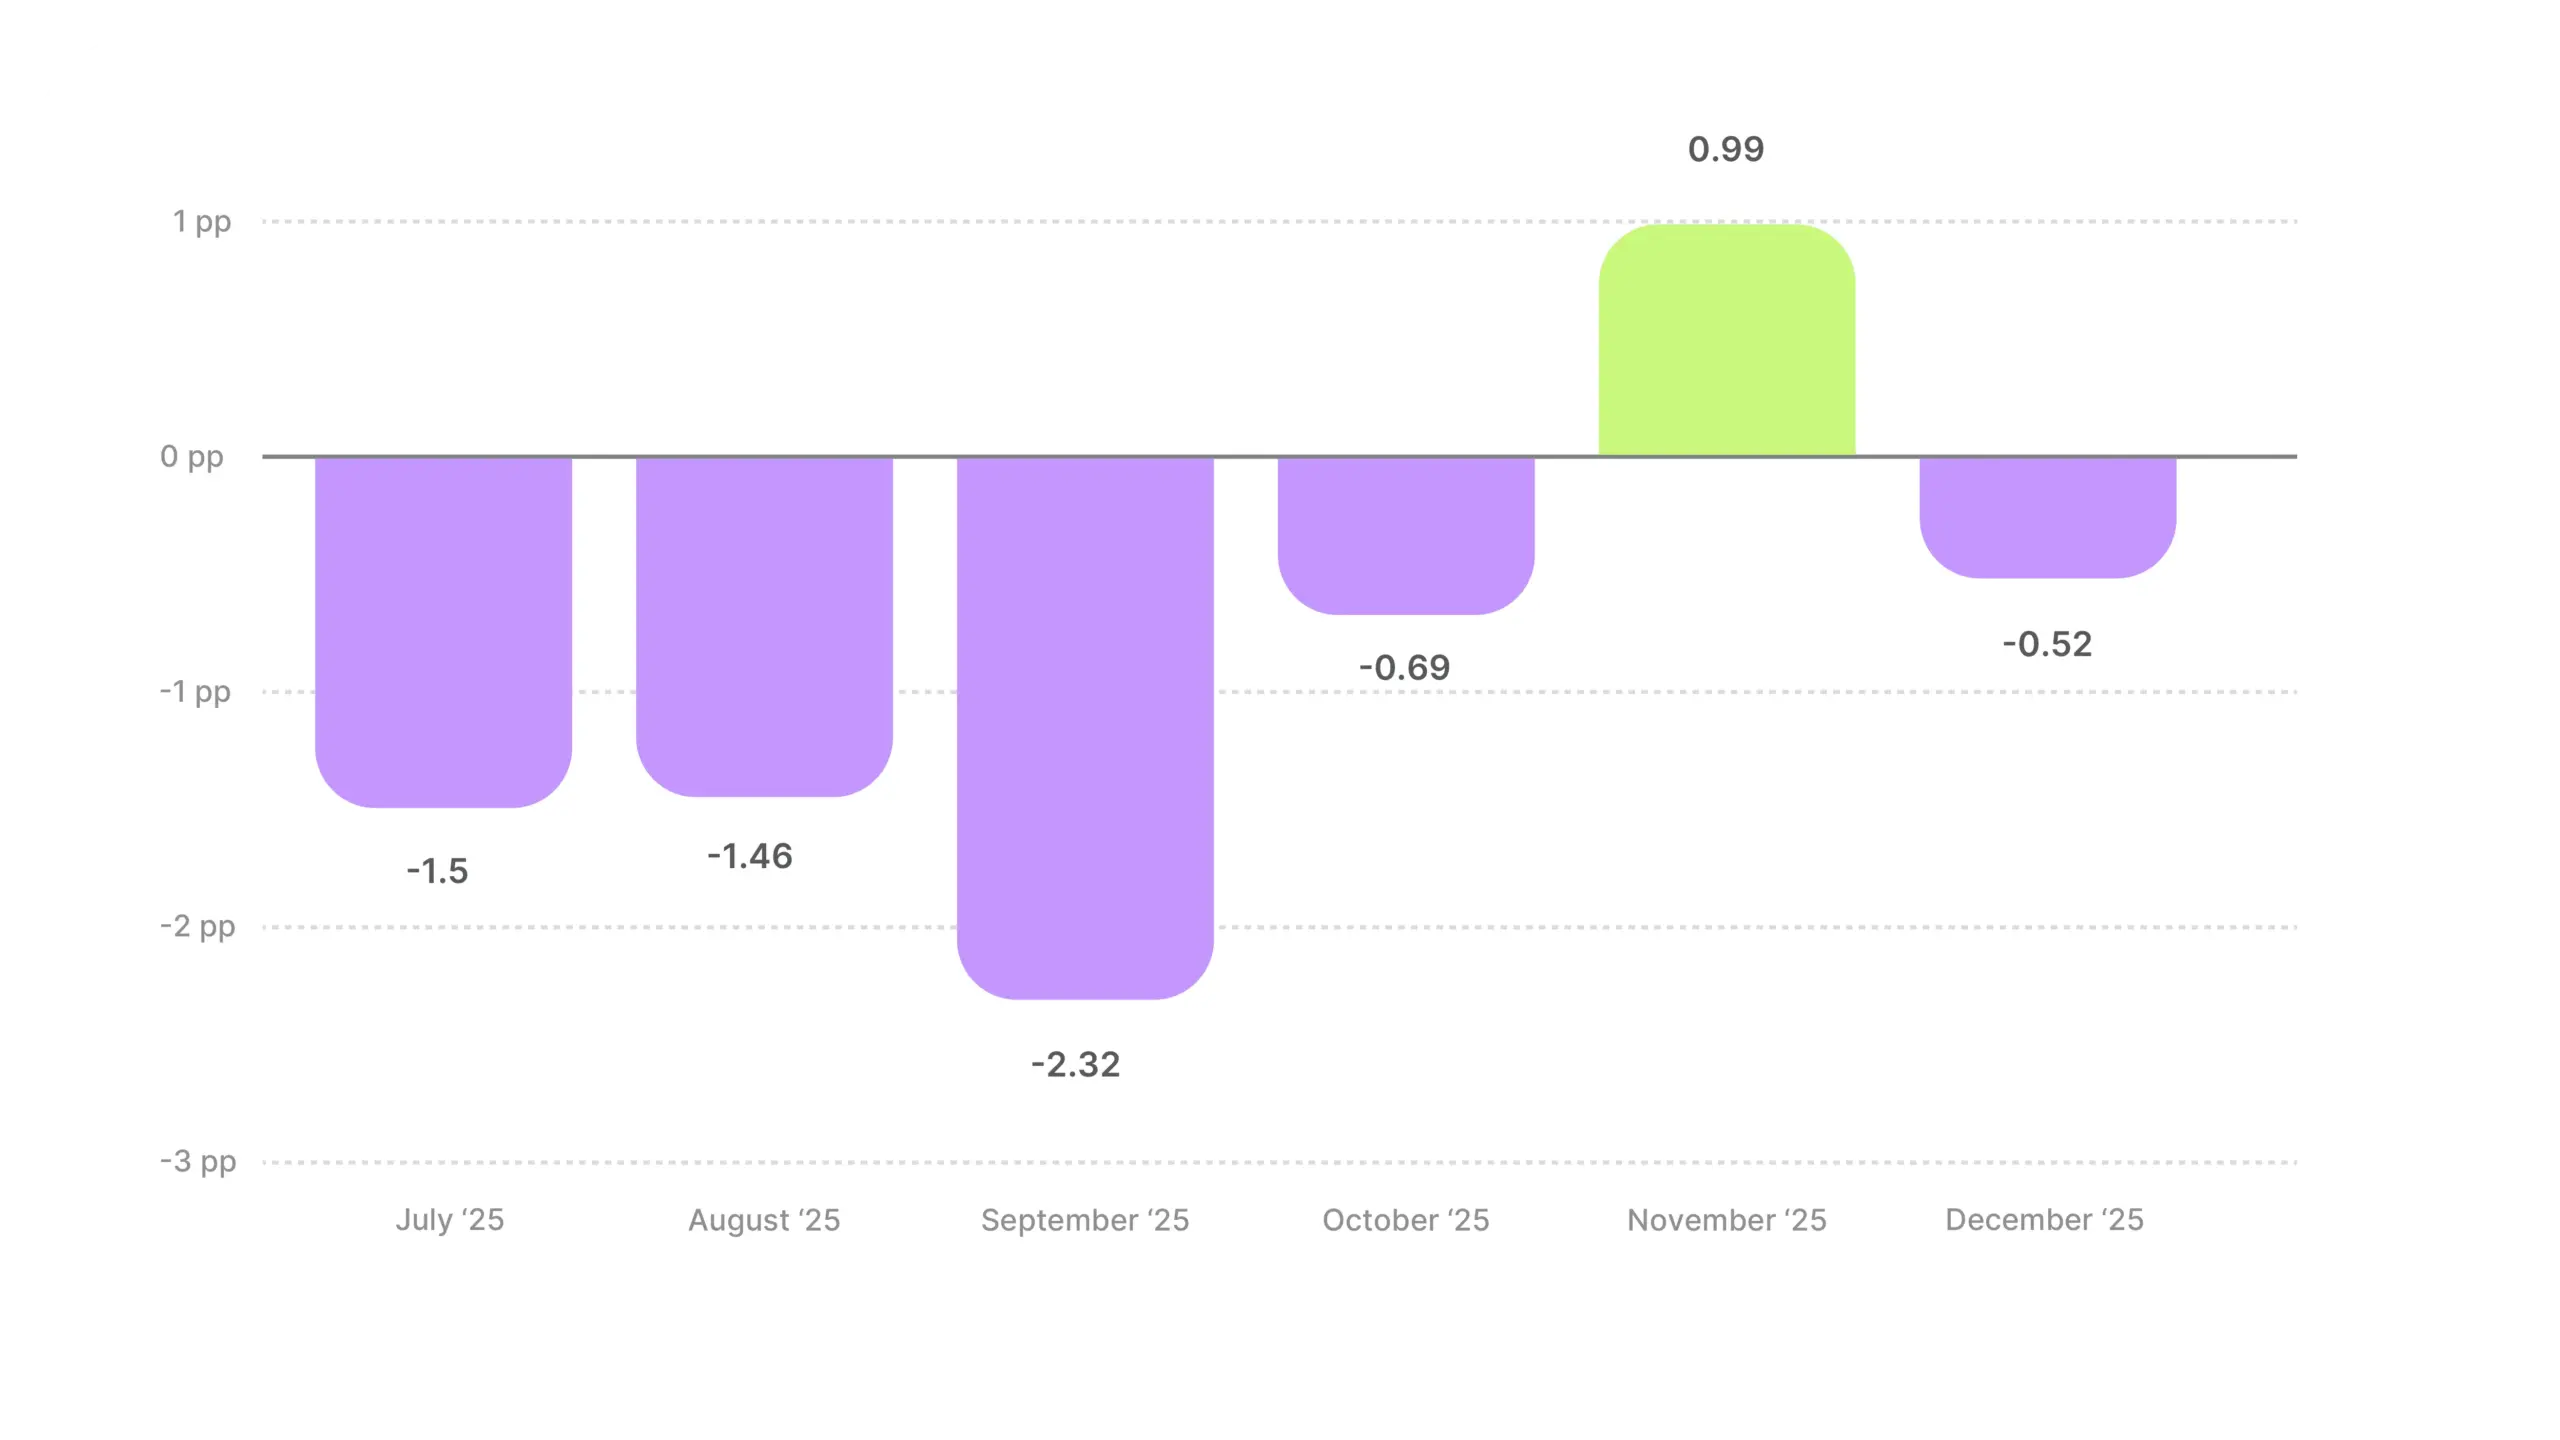
While the overall market dipped in November, Apparel peaked. A 2.88 pp climb from the September low to the November high is the kind of seasonal swing most categories don’t experience. Holiday shopping intent appears to do what creative alone couldn’t: prime the audience to stop and look at clothes.
That November peak is your biggest strategic advantage. Double down on video creative for November. Your hooks work hardest when the audience is meeting you halfway with purchase intent. Fancy new clothes for parties, holiday outfit planning, the “what am I wearing to…” mindset.
September’s dip to 21.92% is the biggest single-month drop in this category. Could be that fall collections are out but the mindset hasn’t shifted yet. Creative that bridges the seasonal transition (end-of-summer clearance urgency, first-look fall teasers) could soften this dip instead of letting in-between content produce in-between performance.
Arts & Entertainment oscillated in a tight band between 24.40% and 25.67% across H2, a total swing of just 1.27 pp. The category never dipped below the cross-industry average in any month, which puts it in a comfortable position: your content has a built-in hook advantage from inherently engaging subject matter. Movie trailers, event previews, music snippets, gallery teasers.
Industry hook rate average
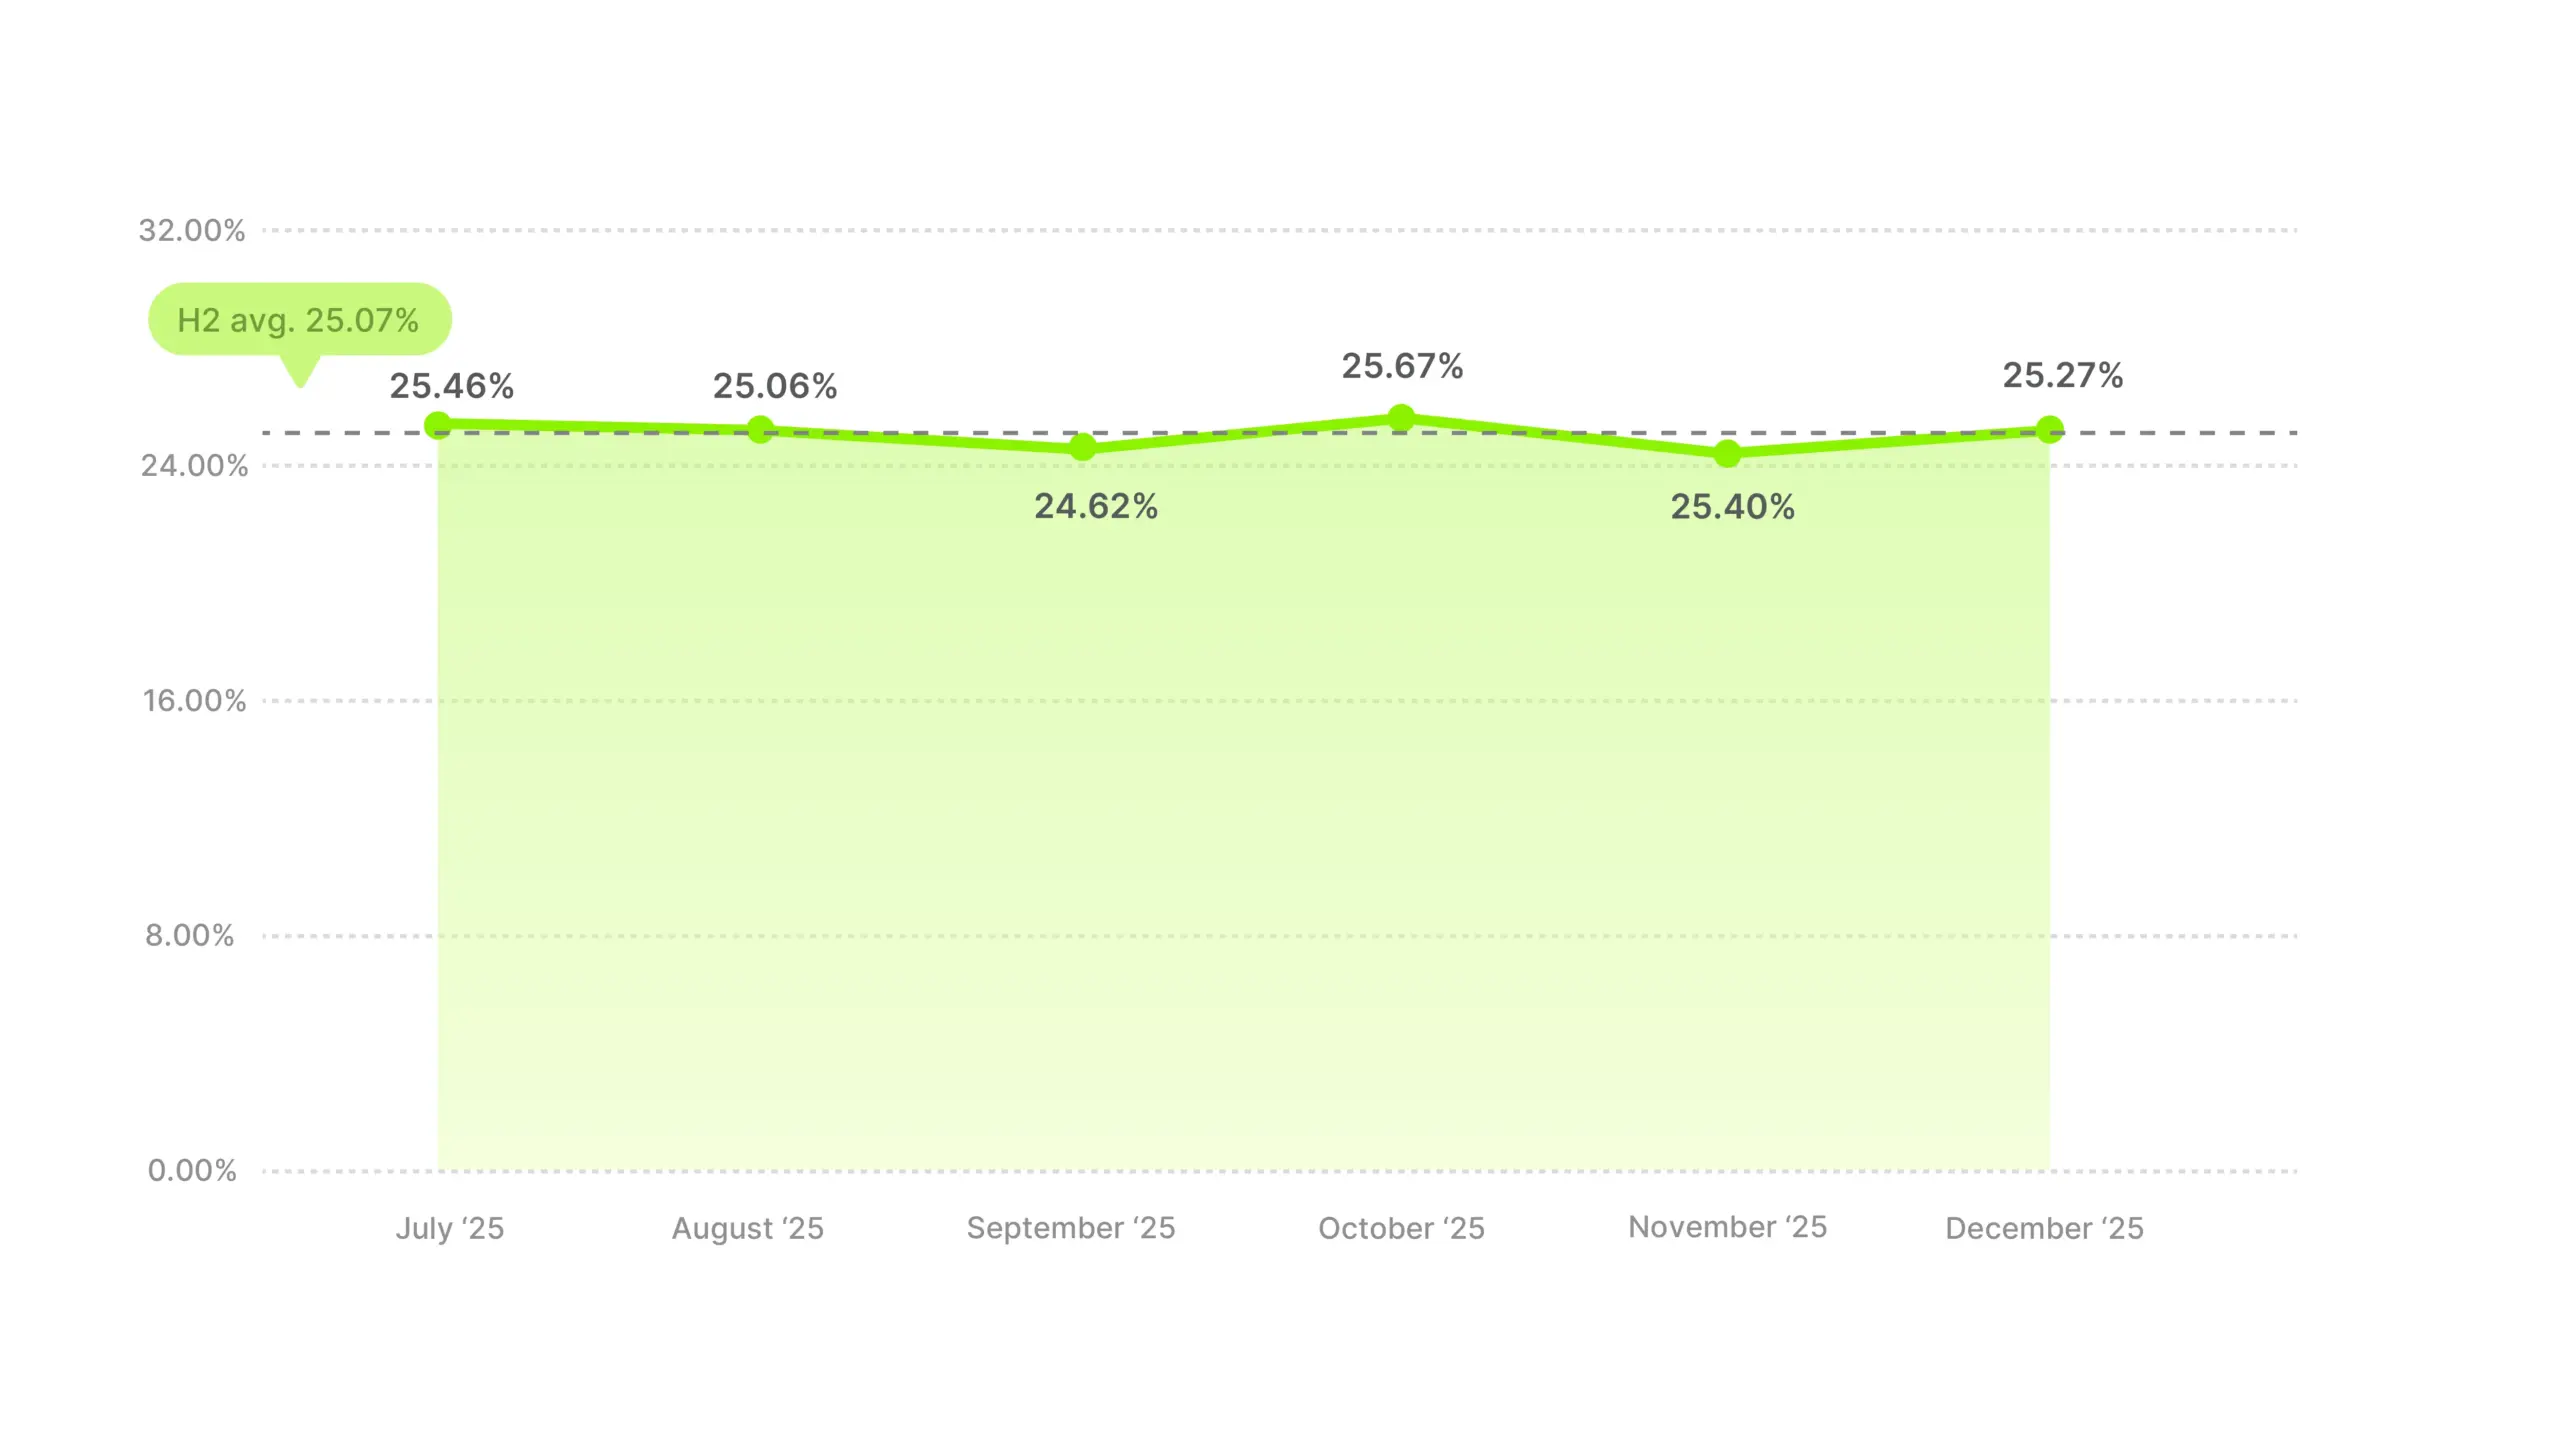
Distance from all-industry average
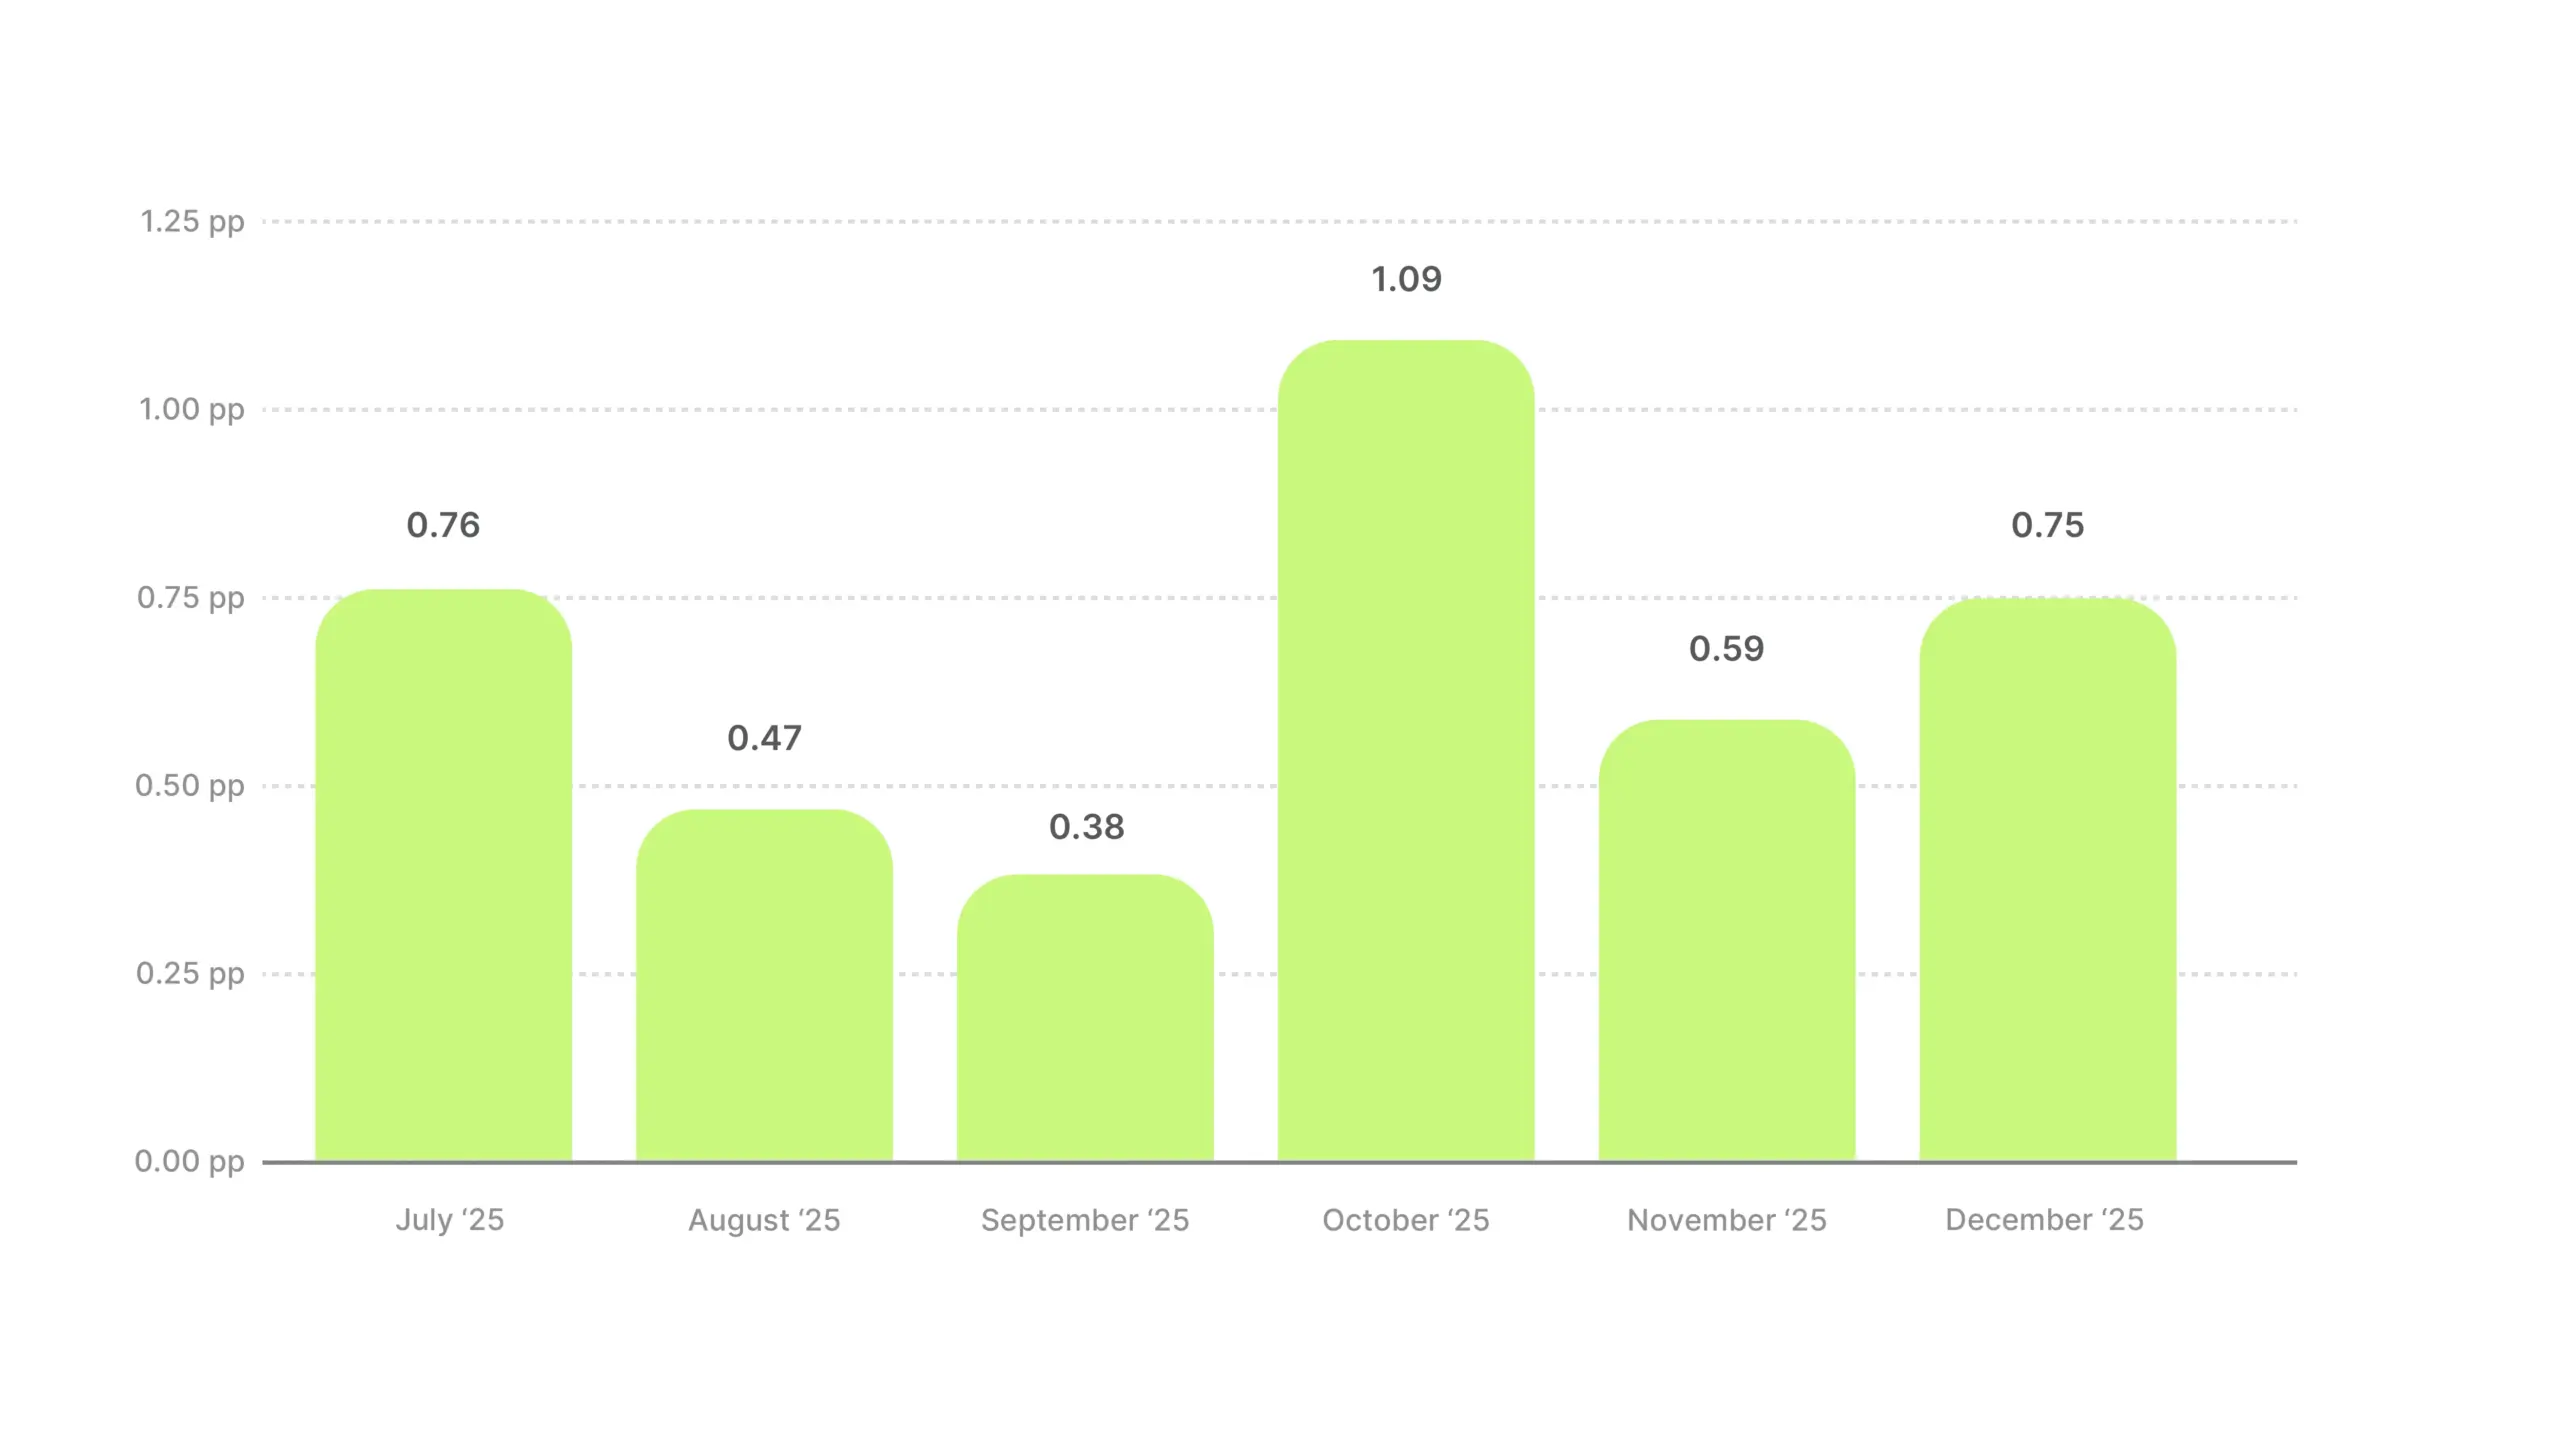
The alternating up-down pattern could reflect how entertainment content naturally cycles: a strong release month (new shows, events, album drops) boosts hook rates, followed by a quieter period before the next wave. Aligning video ad launches with content release calendars could help you ride the upswings rather than fighting against quieter stretches.
December saw the highest ad count alongside the second-highest hook rate. More advertisers entered the space without diluting attention, which suggests healthy demand absorption. For planning purposes, use 25.07% as your benchmark. Top performers in this space are likely hooking 27%+ of viewers, and that’s the tier to aim for.
Baby & Toddler tracks right at the cross-industry average, which is unremarkable at first glance. But strip out November and you’re looking at one of the most consistent performers in the dataset.
Industry hook rate average
Distance from all-industry average
From August through October, this category was consistently above the cross-industry average. Then November dropped 3.3 pp in a single month before bouncing right back in December. That sharp V is very likely environmental, not a creative quality problem.
Apparel & Accessories peaked in November while Baby & Toddler cratered, which makes more sense than it first appears. Apparel is an impulse and gifting category that benefits from Black Friday energy, people are actively looking for deals on clothes. Baby & Toddler is need-based, things like diapers, formula, essentials that people buy when they need them, not because an ad caught their eye. In a feed designed to trigger impulse purchases, need-based categories get buried.
Your baseline creative works fine most months. But November is the one month where your hook strategy probably needs to shift. Instead of promoting need-based products that people will buy regardless, lean into the giftable side of your catalog, the cute outfits, the toys, the things people actually browse for and buy on impulse during the holiday season.
B2B video hooks outperformed the market in every single month of H2. Even during the August-October soft patch, the category never dropped below the overall average. That alone challenges the narrative that B2B content can’t compete with consumer categories on social.
But the most interesting story is what happened when B2B brands pulled back.
Industry hook rate average
Distance from all-industry average
The two highest hook rate months (July and December) coincided with the strongest downstream metrics. Ad volume halved from July to December, and as it dropped, everything else improved. December delivered the most purchases and the highest purchase value from the fewest ads in the dataset. November was similar: fewest ads, lowest spend, but hook rates jumped back above 26% and purchases nearly doubled.
The brands that stayed in the game while others retreated had a cleaner feed and the creative quality to capitalize on it. While consumer categories were fighting over Black Friday attention, B2B had less intra-category competition and the hooks performed much better.
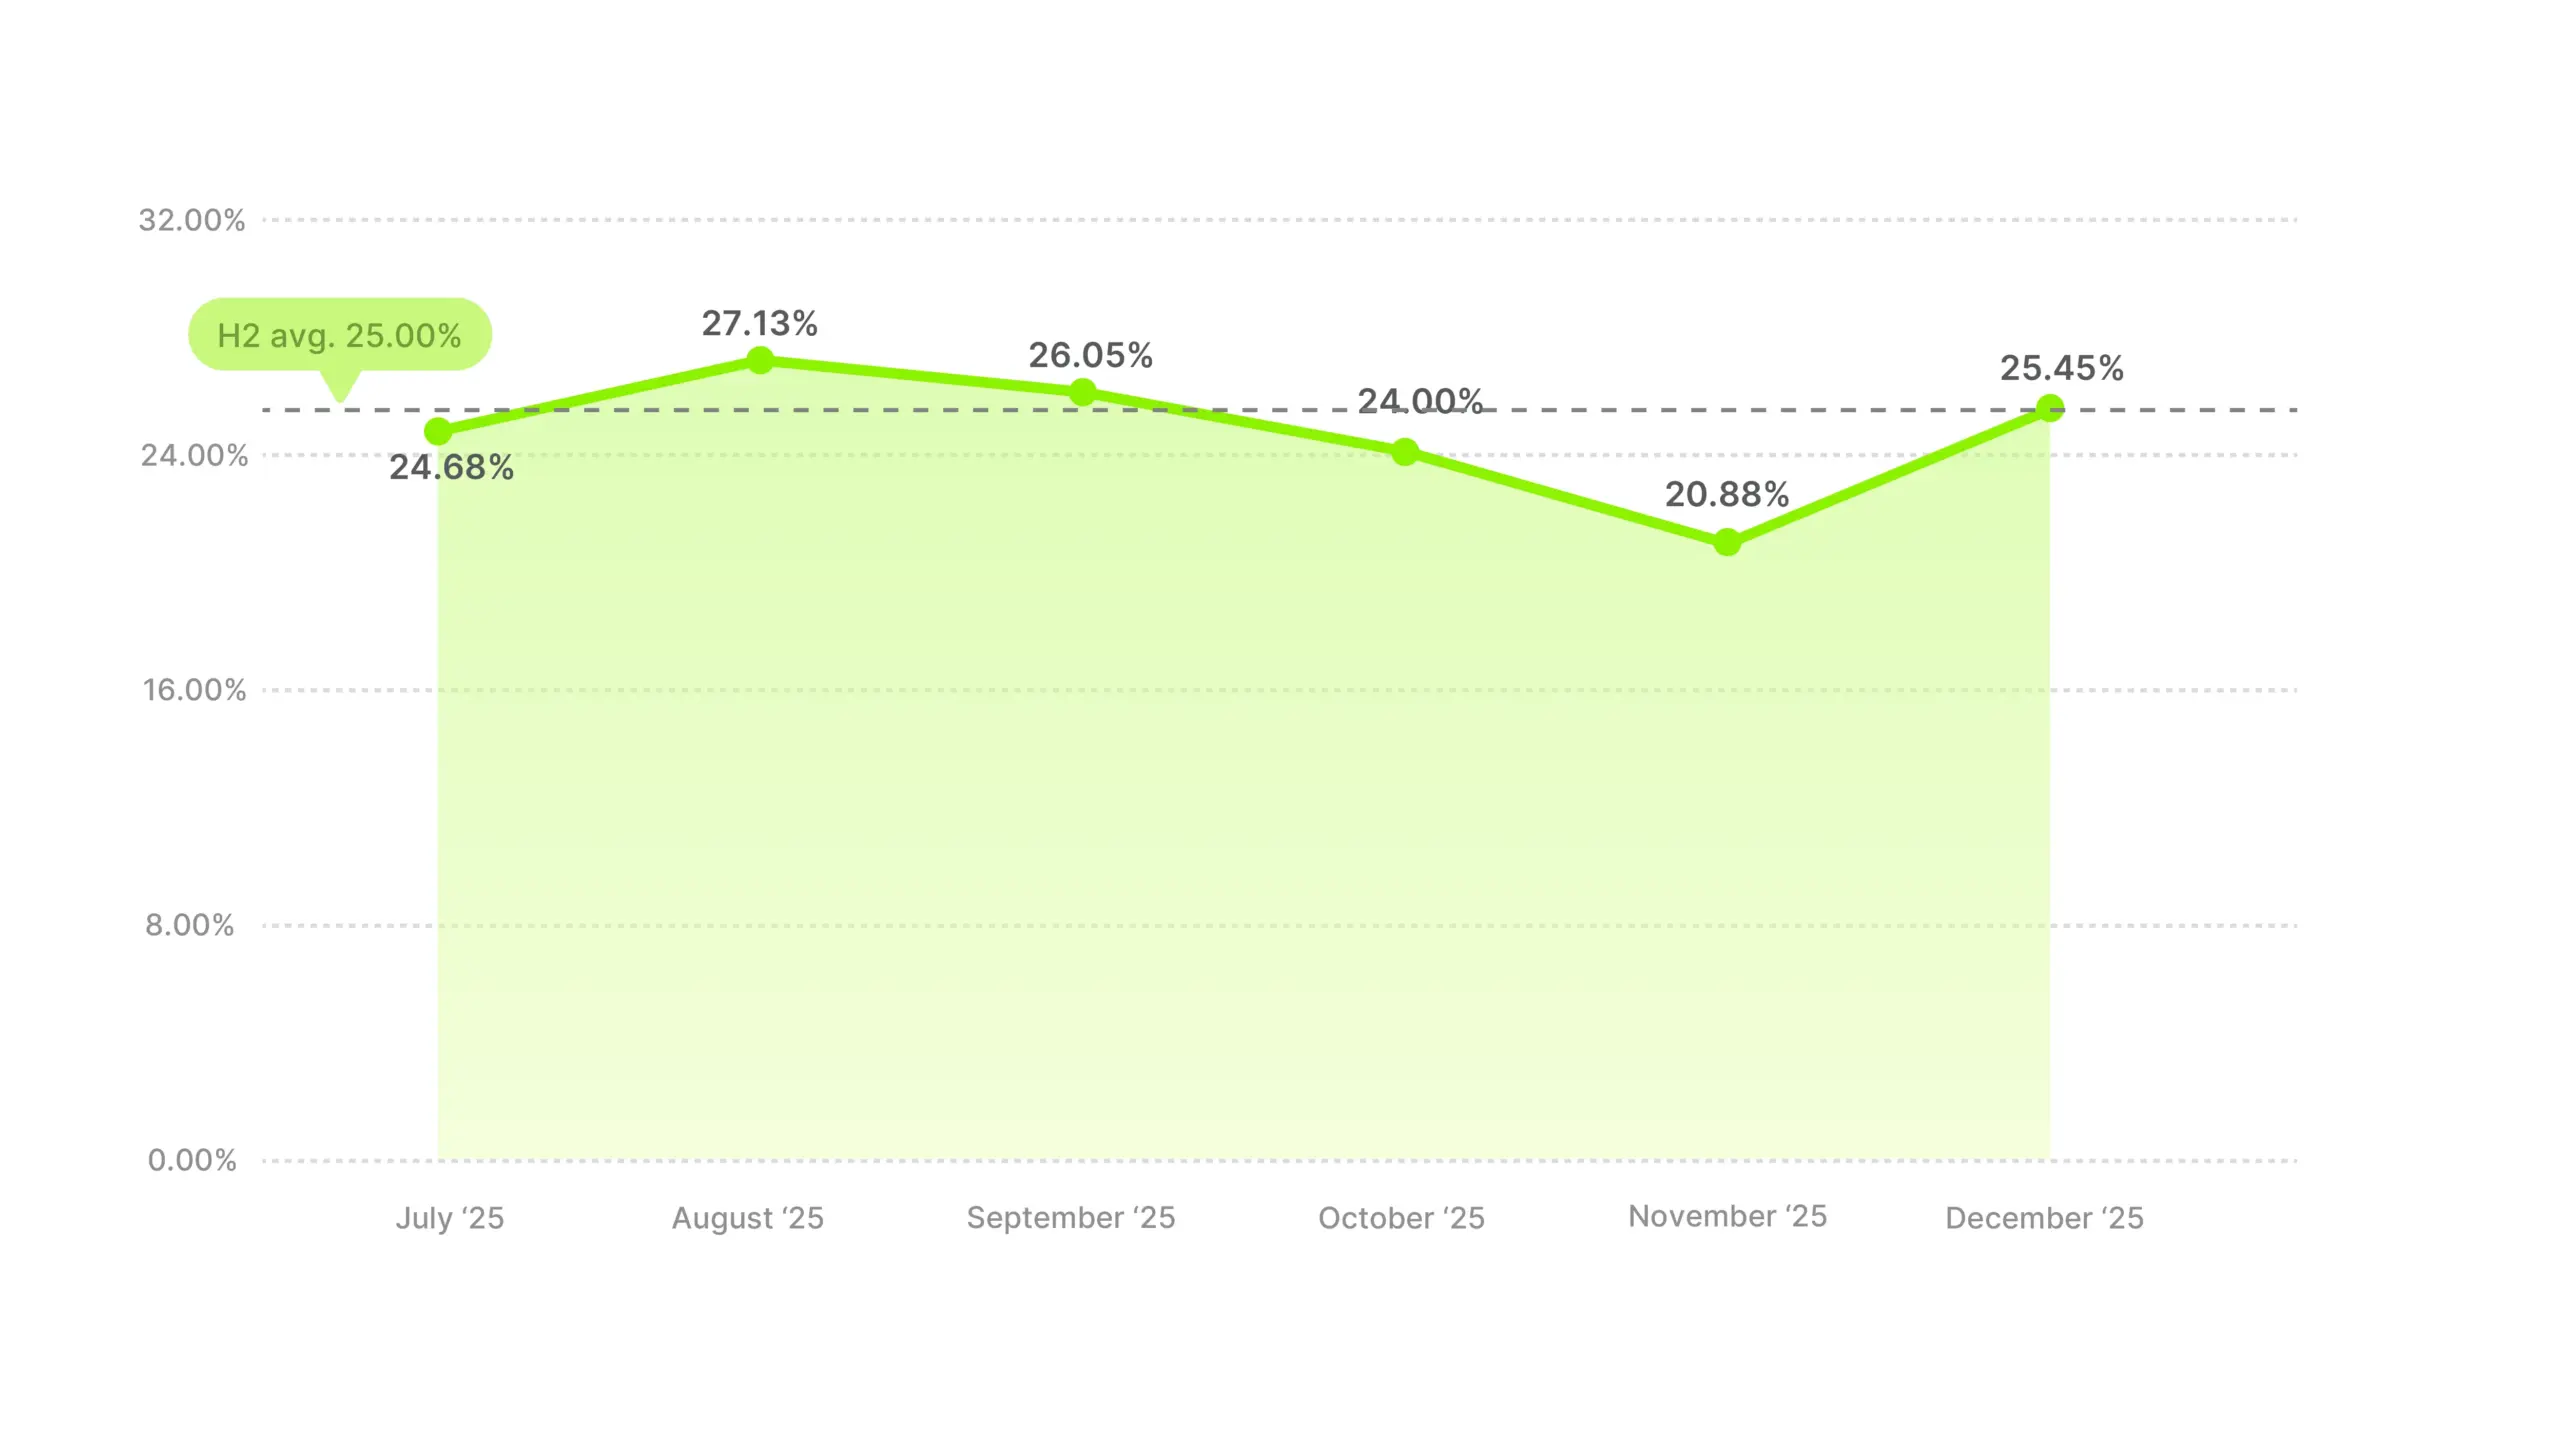
Electronics sits above the cross-industry average, but that headline number hides the widest monthly swings in the dataset. A 6.25 pp spread between the August peak (27.13%) and the November trough (20.88%) makes this the most volatile category in our H2 analysis. That said, November’s data contains the most interesting paradox in the entire report.
Industry hook rate average
Distance from all-industry average
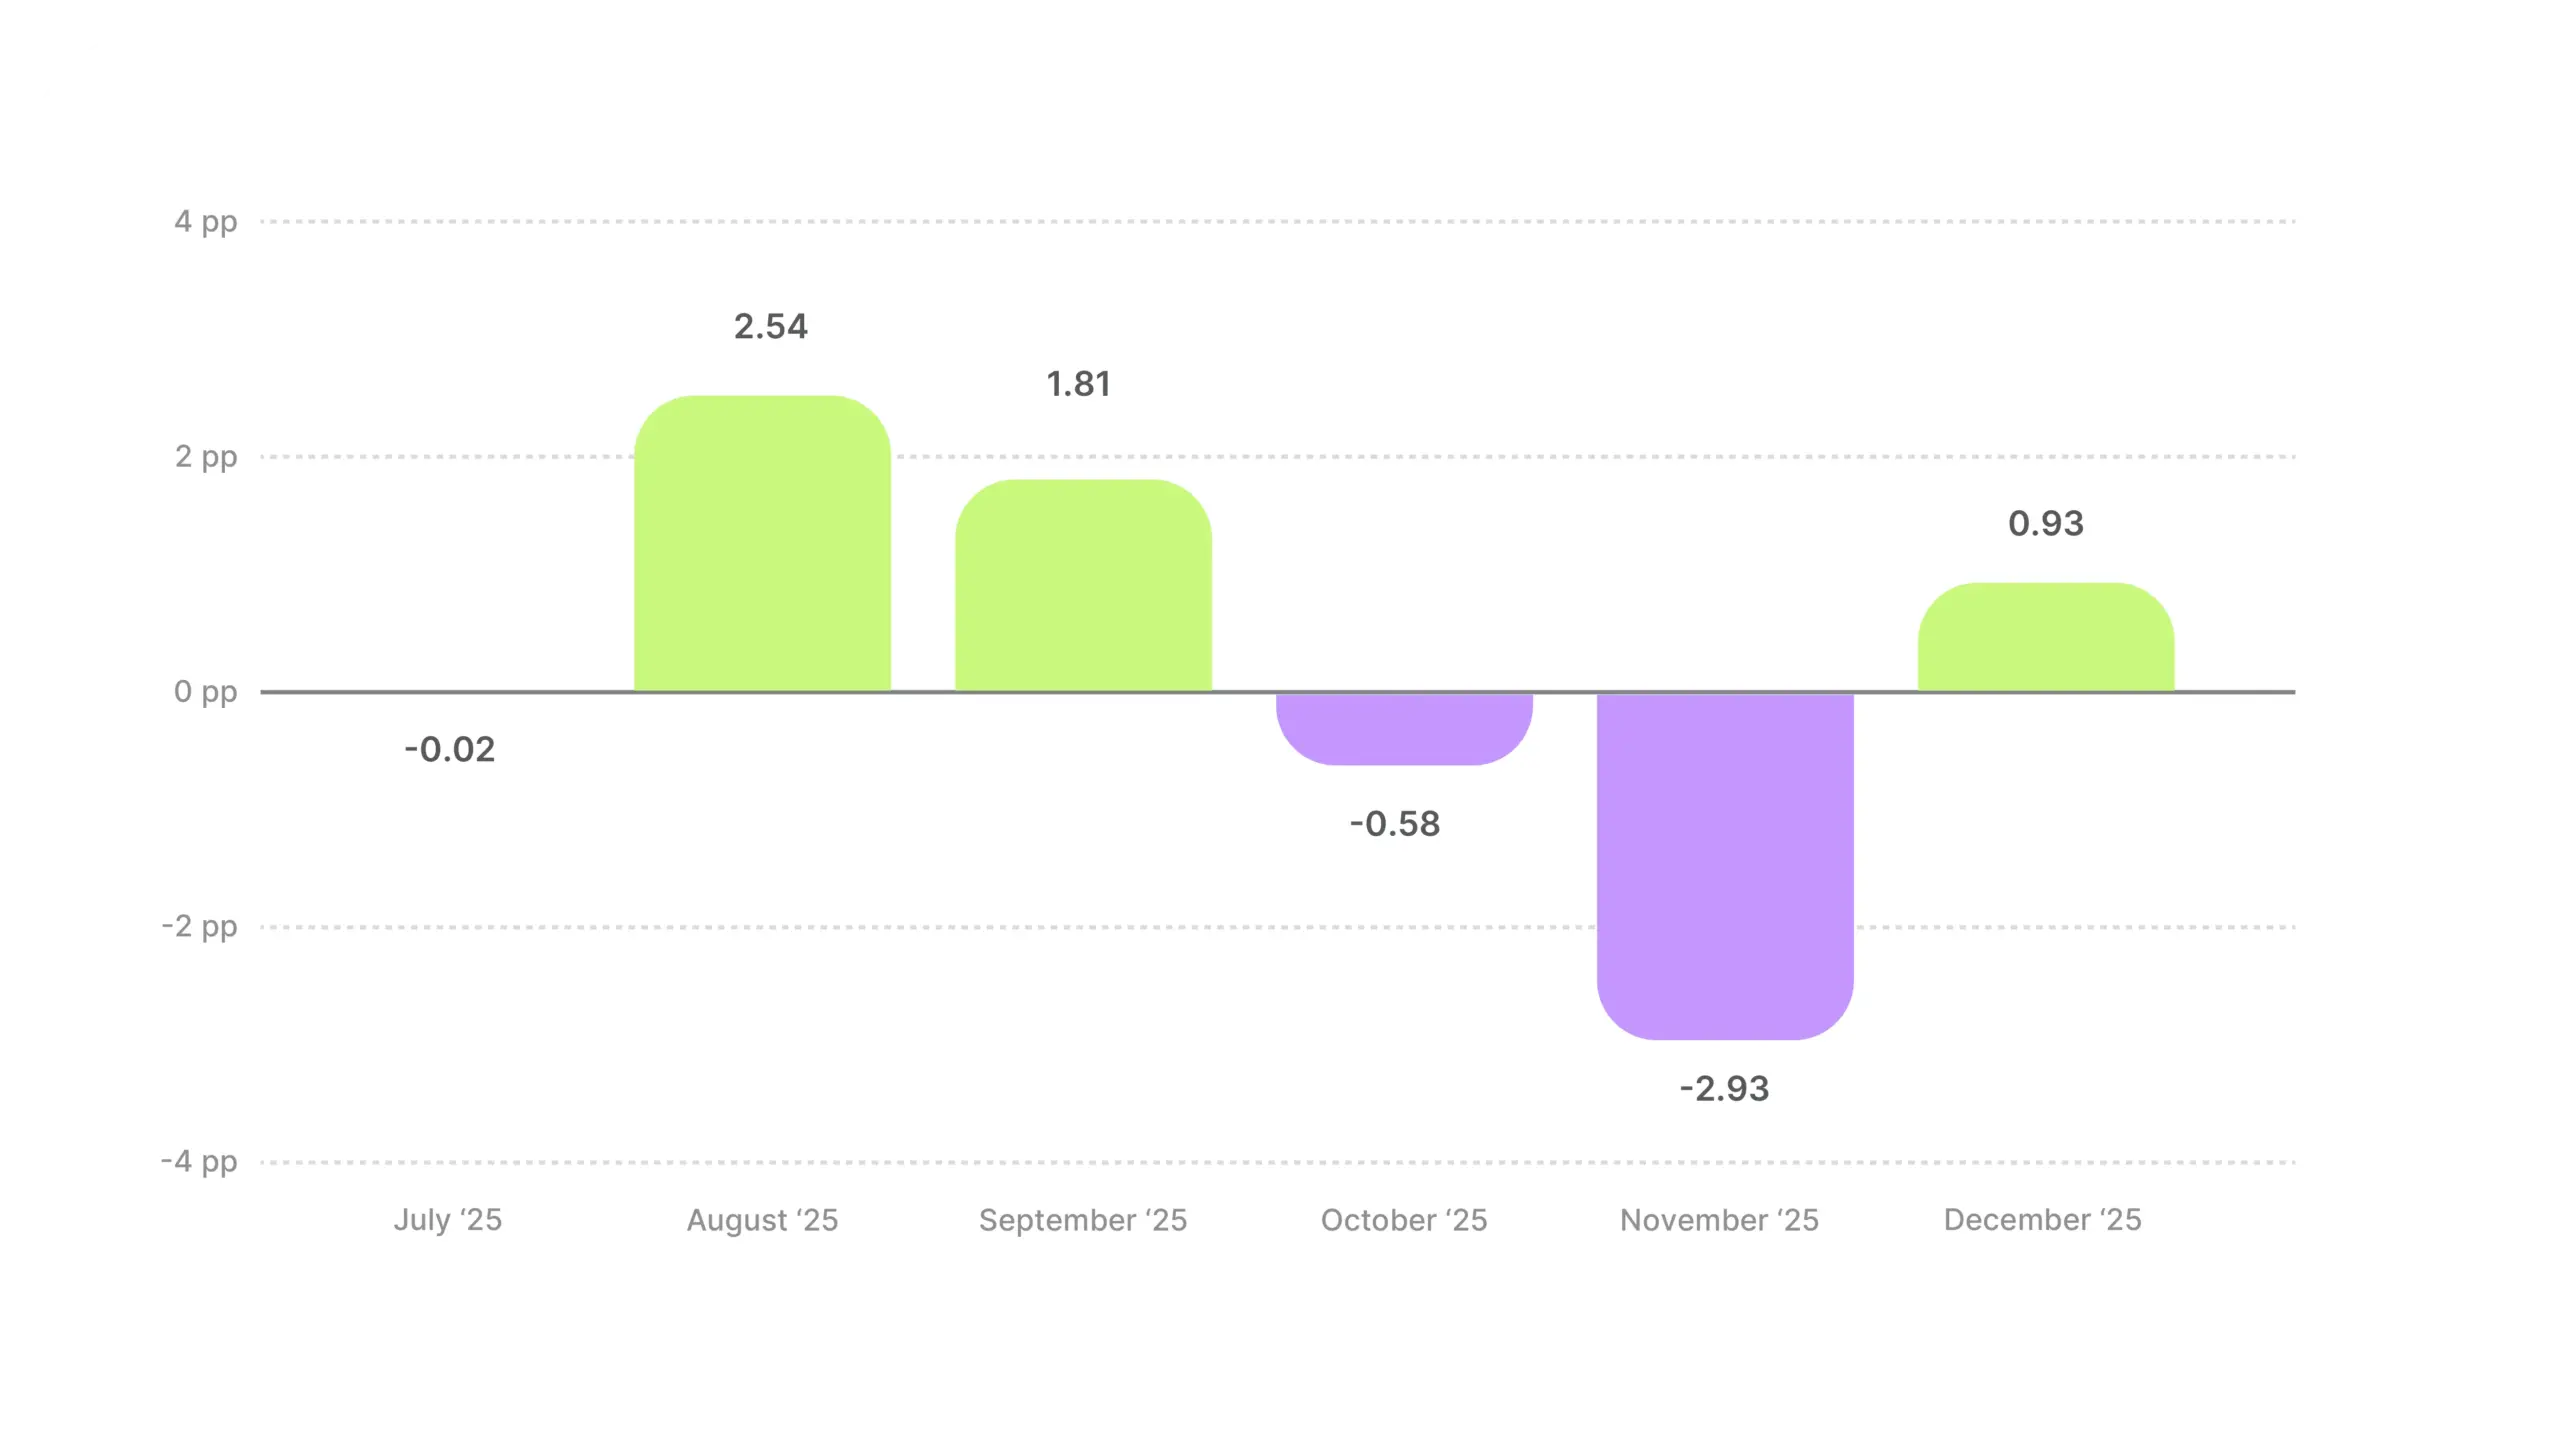
November had the lowest hook rate of any month in the category, but the feed was full of buyers. People were spending on electronics and driving sales. They just weren’t stopping to watch the ads. When every electronics ad leads with a Black Friday discount, the opening seconds blur together. The deals work once people engage, but the hooks can’t differentiate in a feed full of identical promos.
During promotional periods, your hook needs to earn attention before revealing the offer. A striking visual, a product-in-action moment, an unexpected angle. Anything that separates your first two seconds from the wall of discount ads around you. Leading with the price slash when every competitor is also leading with a price slash is the one move guaranteed not to stand out.
August’s 27.13% may be a back-to-school effect, one of the few windows outside Black Friday where electronics has concentrated purchase intent without the feed saturation. If that hypothesis holds, August deserves more creative investment than it probably gets.
Food & Beverages tells two distinct stories across H2. July and August delivered some of the strongest hooks in the dataset, powered by summer lifestyle content. From September onward, the decline was steady, and by December, hook rates had fallen below the cross-industry average for the first time.
Industry hook rate average
Distance from all-industry average
Summer is the peak season for this category, and it’s clear why. BBQ content, refreshing drinks, outdoor eating, vibrant produce is where the food and beverage creative is at its most visually compelling, driving hook rate up.
September’s drop of nearly 2 pp is the steepest single-month decline in the category. The likely culprit is the stale summer creative running into a post-summer audience mindset. Viewers have mentally moved on to fall, but the feed is still serving poolside imagery. A faster creative pivot to comfort food, warm drinks, and autumn recipes could soften this dip.
October’s recovery (+1.07 pp) supports the seasonal playbook. Halloween treats, pumpkin everything, early Thanksgiving prep. Tying creative to whatever cultural food moment comes next appears to work, and the bounce proves it.
The December decline to below the overall average is structural. Food competes poorly against gift categories for impulse attention during the holiday shopping window. Rather than pushing standard product content into a gift-focused feed, consider pivoting to gifting angles. Artisan food gift boxes, curated hampers, stocking stuffers, “for the foodie in your life.” If you can’t beat the gifting mindset, join it.
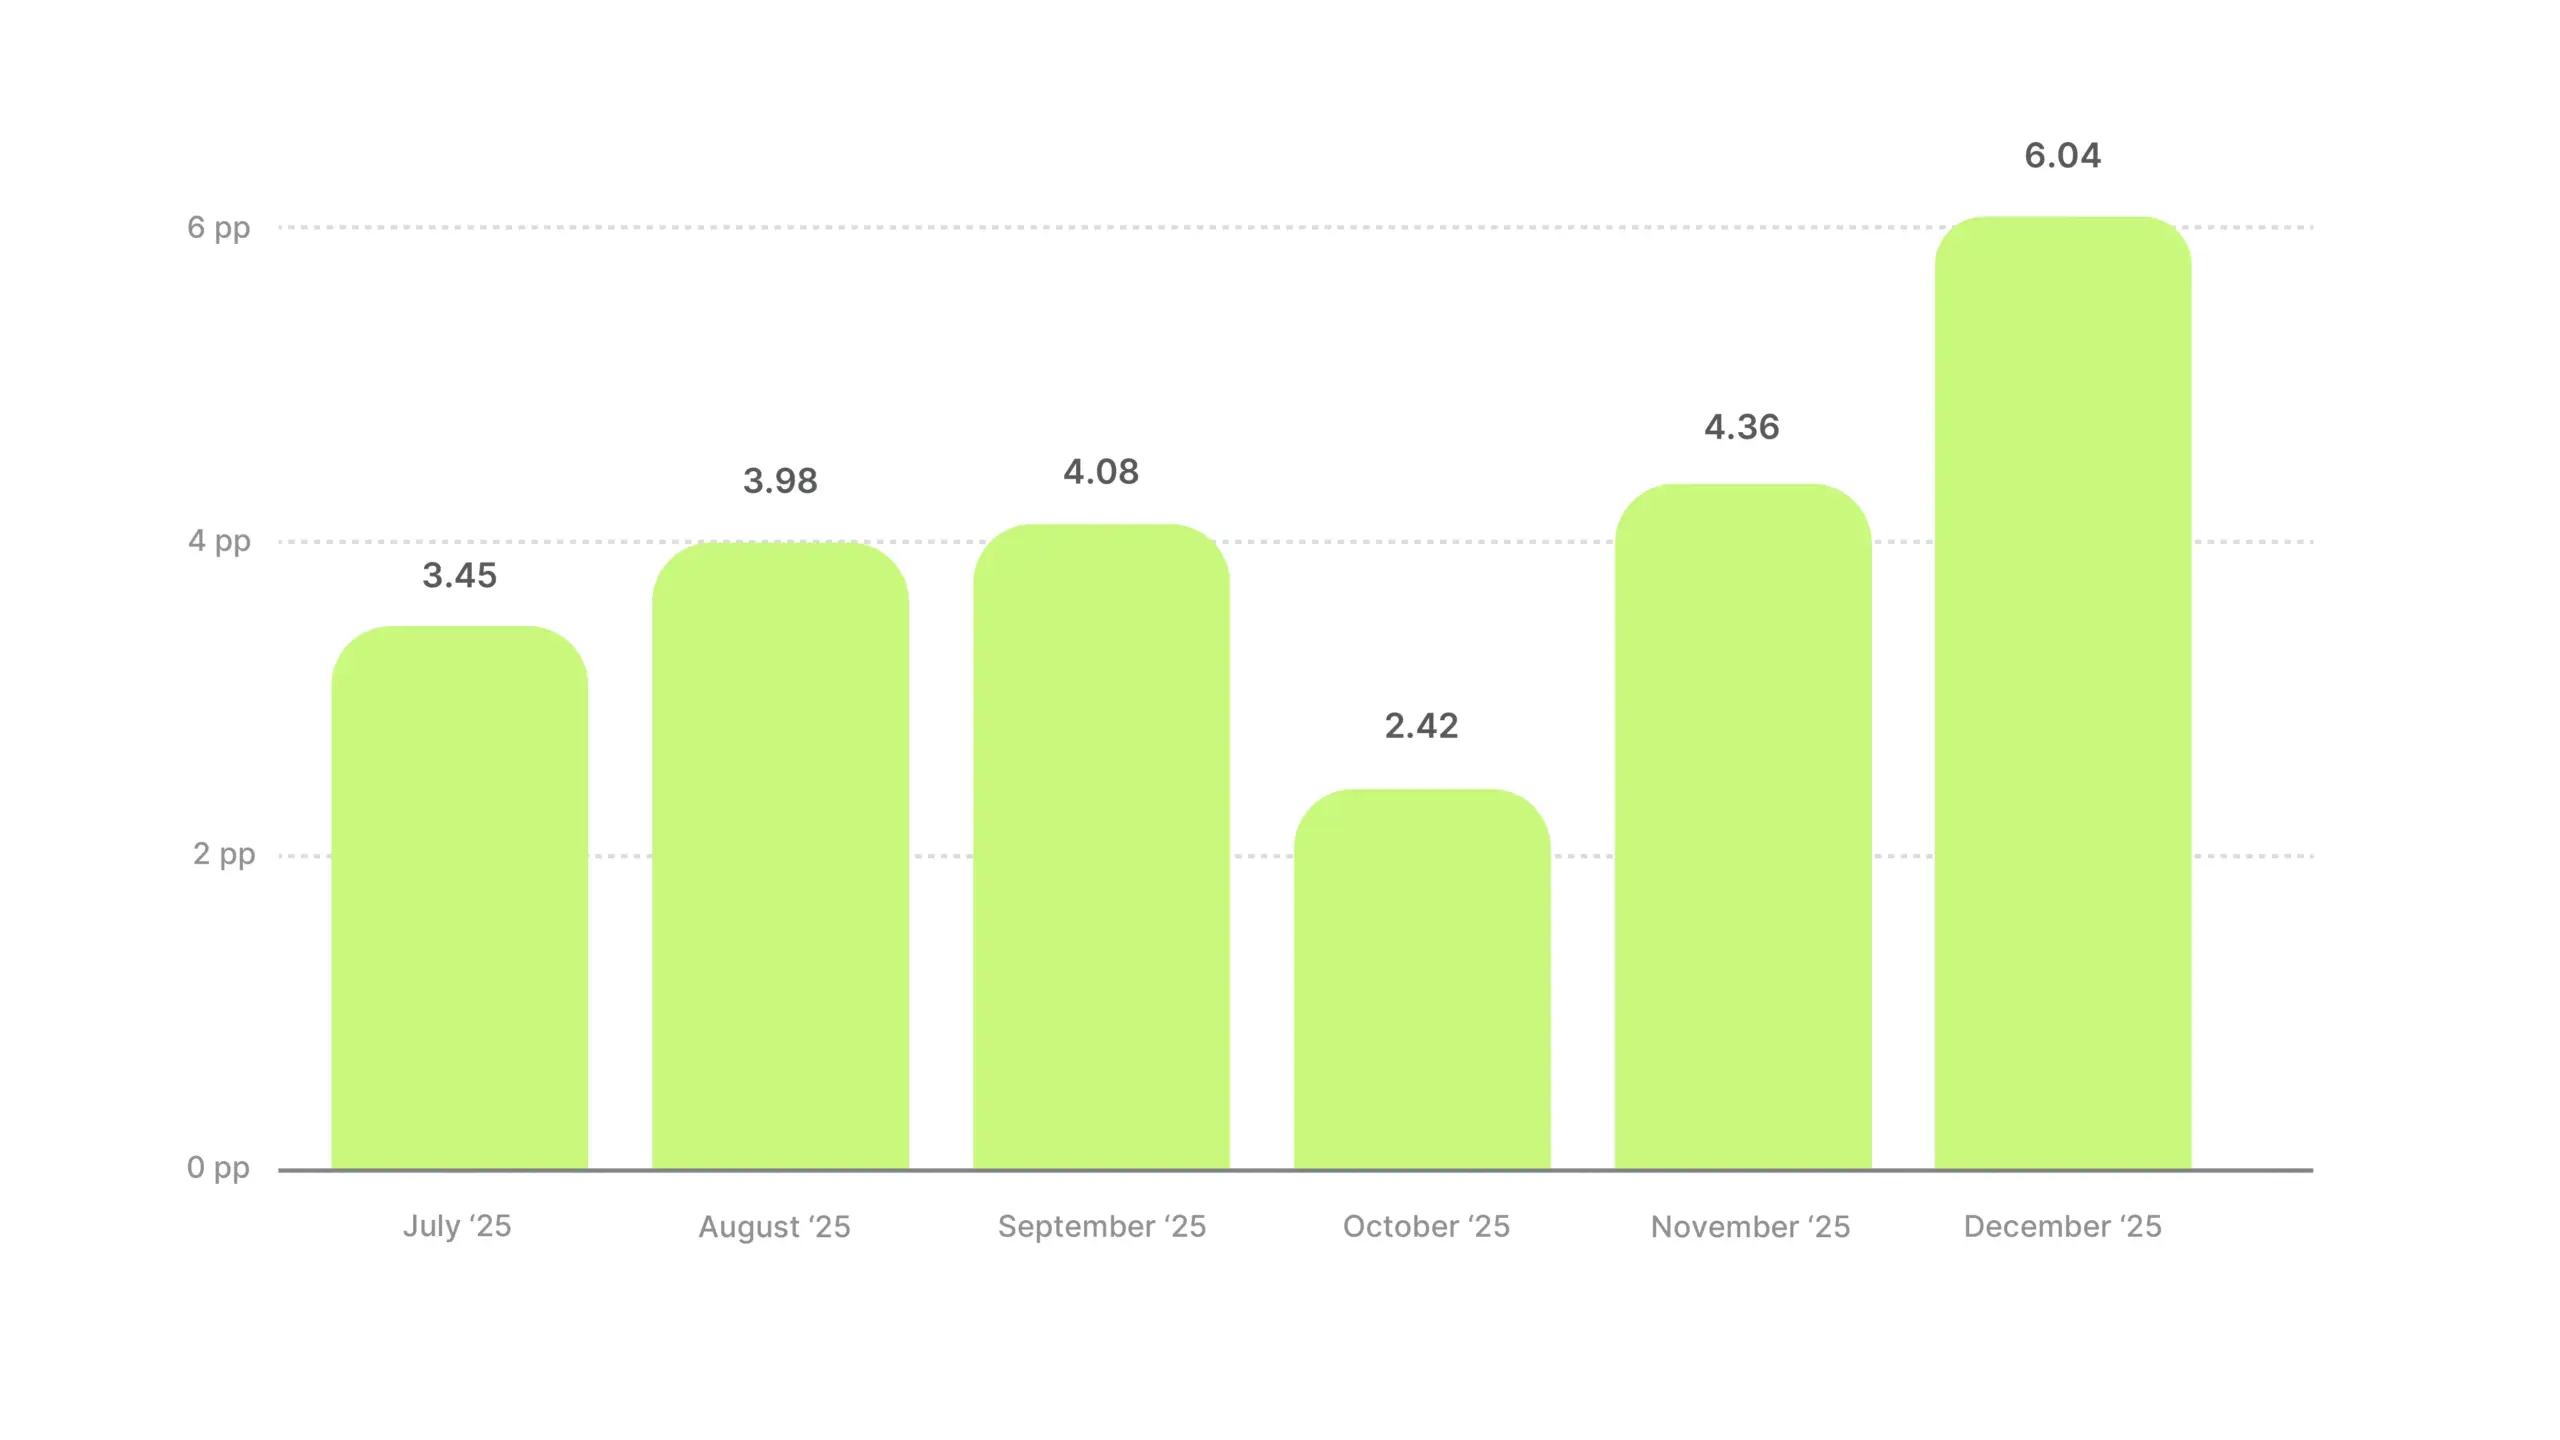
Health & Beauty didn’t just lead the rankings in H2 2025. It operated on a different scale, with nearly 4 pp above the cross-industry average in every single month. And then December happened: a 30.56% hook rate that no other category in any month came close to matching.
Industry hook rate average
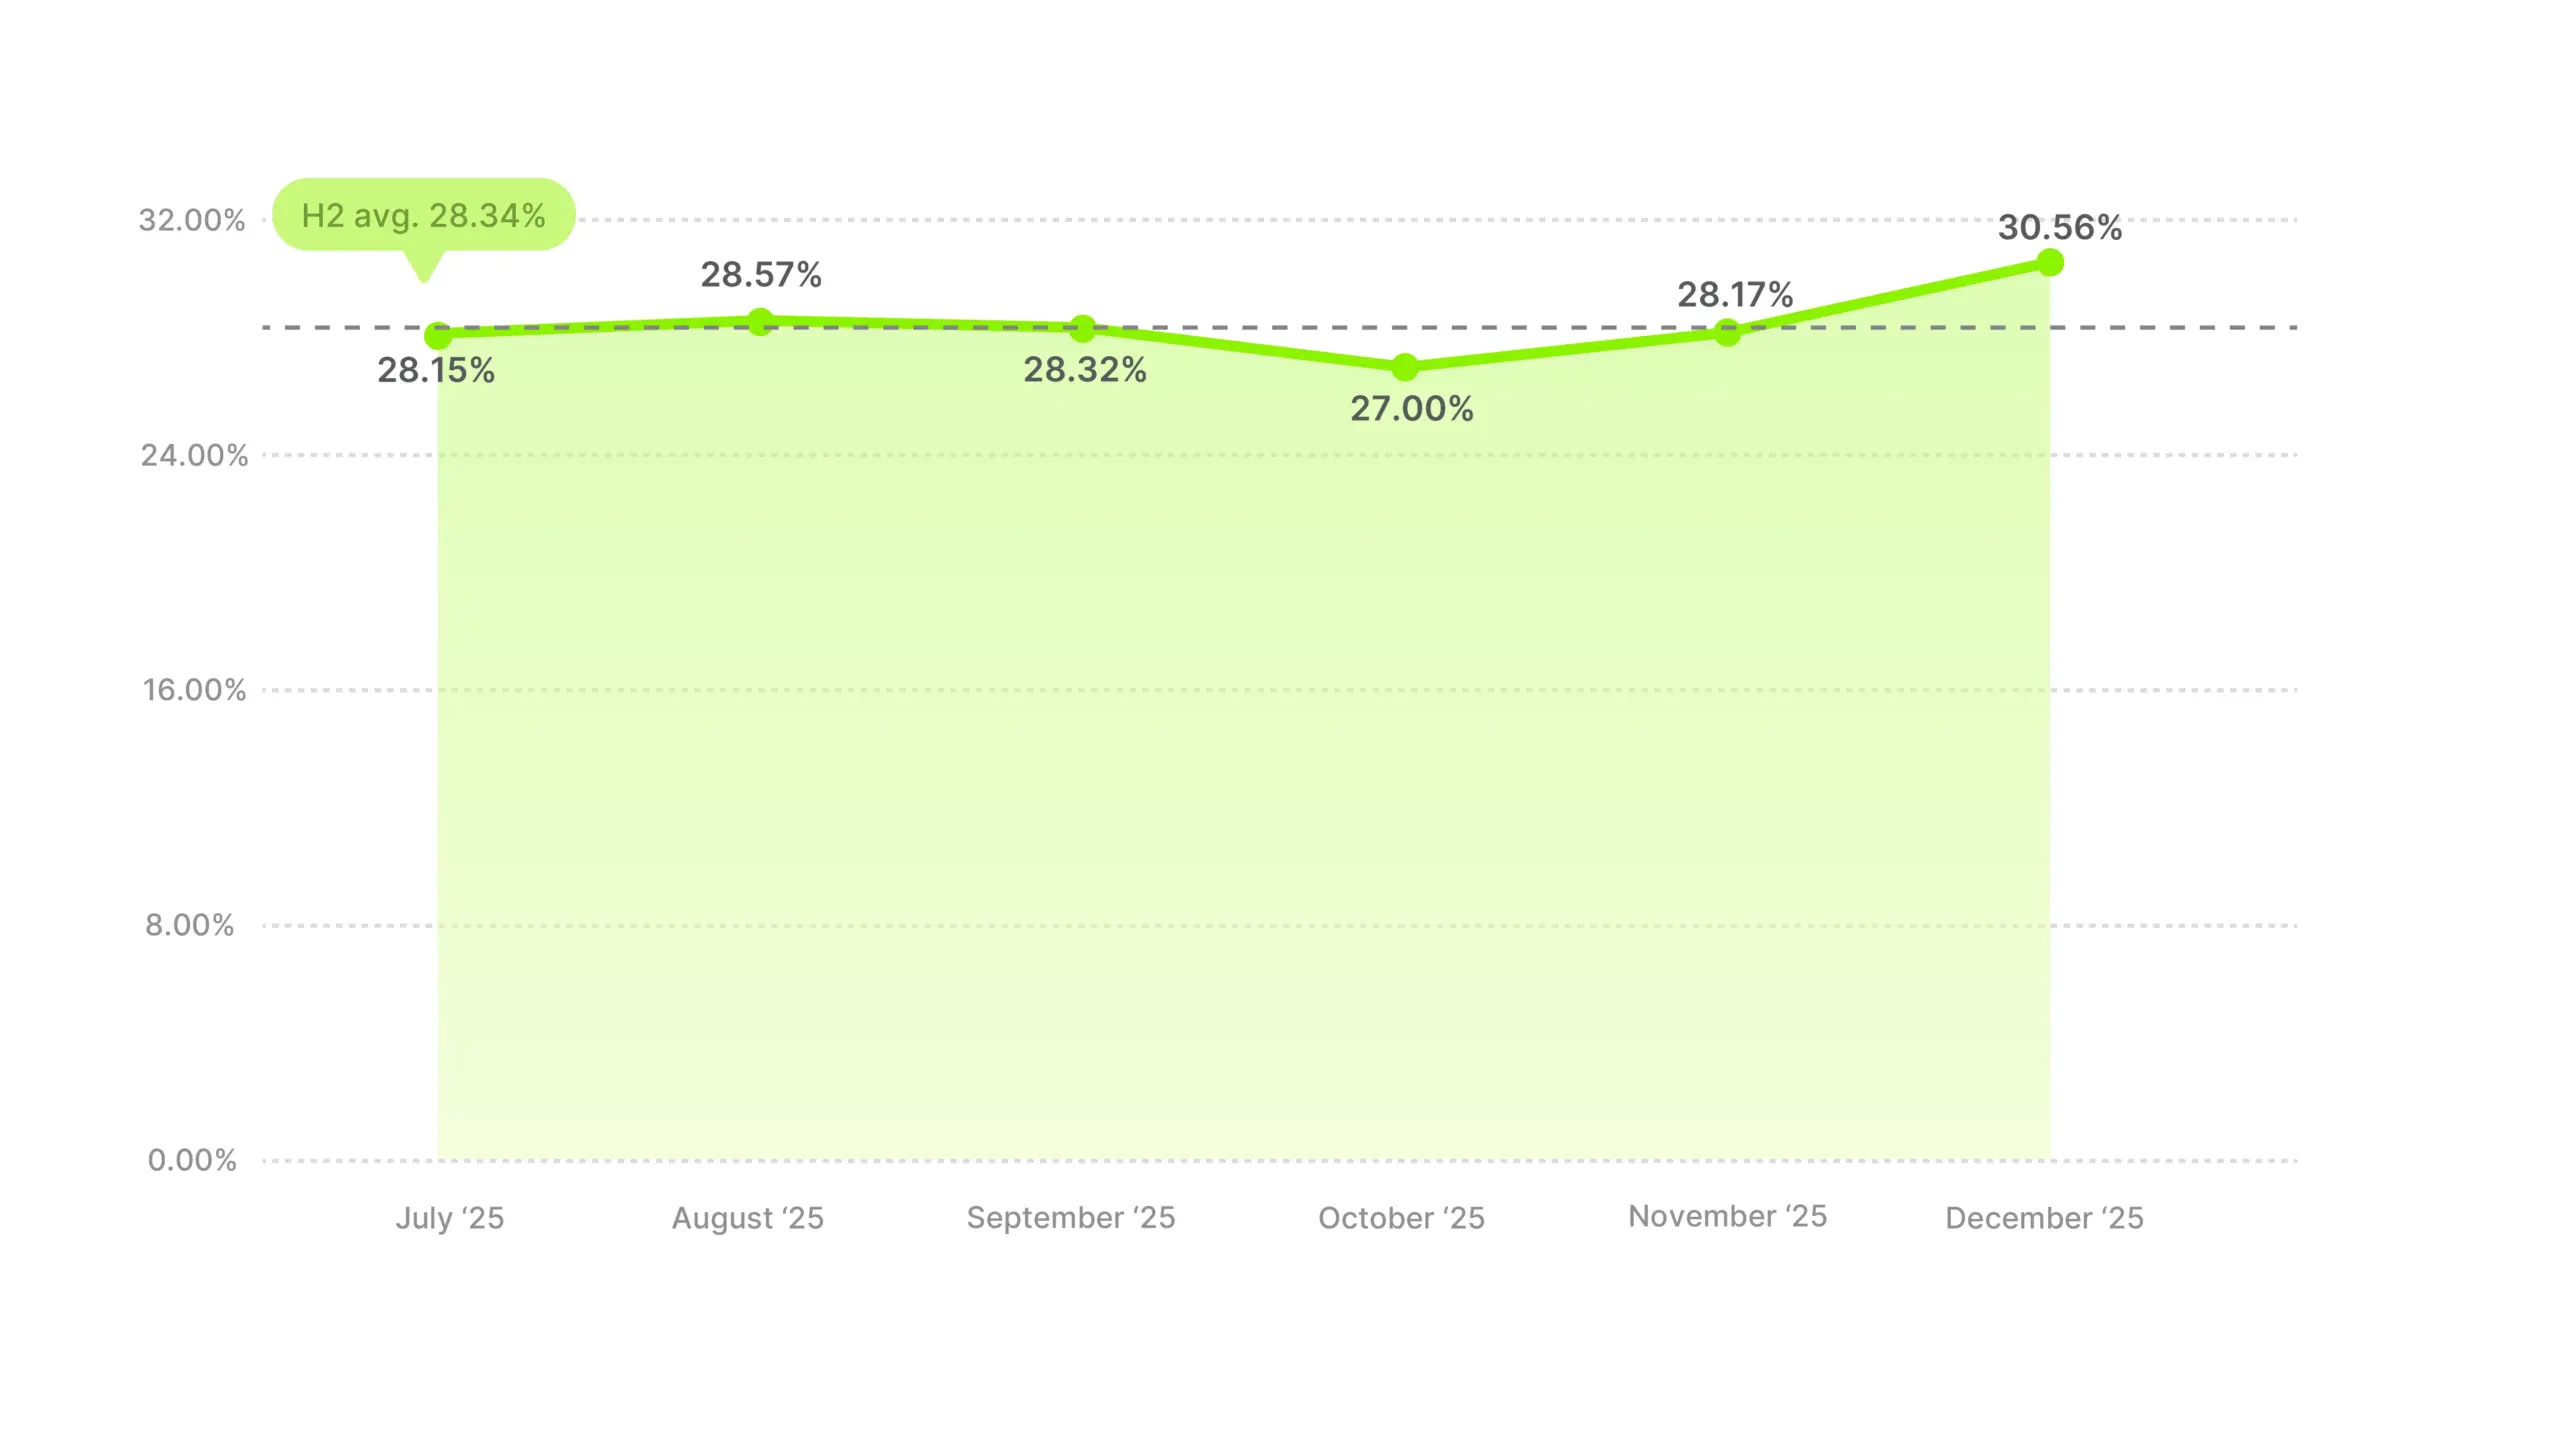
Distance from all-industry average
If you’re benchmarking against the 24.4% cross-industry average, you’re measuring against the wrong number. Hitting the overall average would actually put you nearly 4 pp behind your direct competitors. Anything below 28% is underperformance, even if it looks fine on a cross-industry scorecard.
December’s spike to 30.56% challenges the assumption that year-end is a slowdown. For Health & Beauty, the combination of gifting demand, fewer active ads (volume dropped 35% from September), and inherently giftable products created the strongest hook conditions in the entire dataset. If you’re pulling back video spend in December, this data says you’re leaving your best-performing window on the table.
October was the one soft month with the lowest hook rate (27.00%). One plausible explanation is that audiences know Black Friday beauty deals are coming and shift into a waiting mode. They’re less inclined to engage with a product they plan to buy cheaper in four weeks. If that’s the case, October creative should lean into anticipation (wishlists, teasers, “coming soon” hooks) rather than trying to fight the wait.
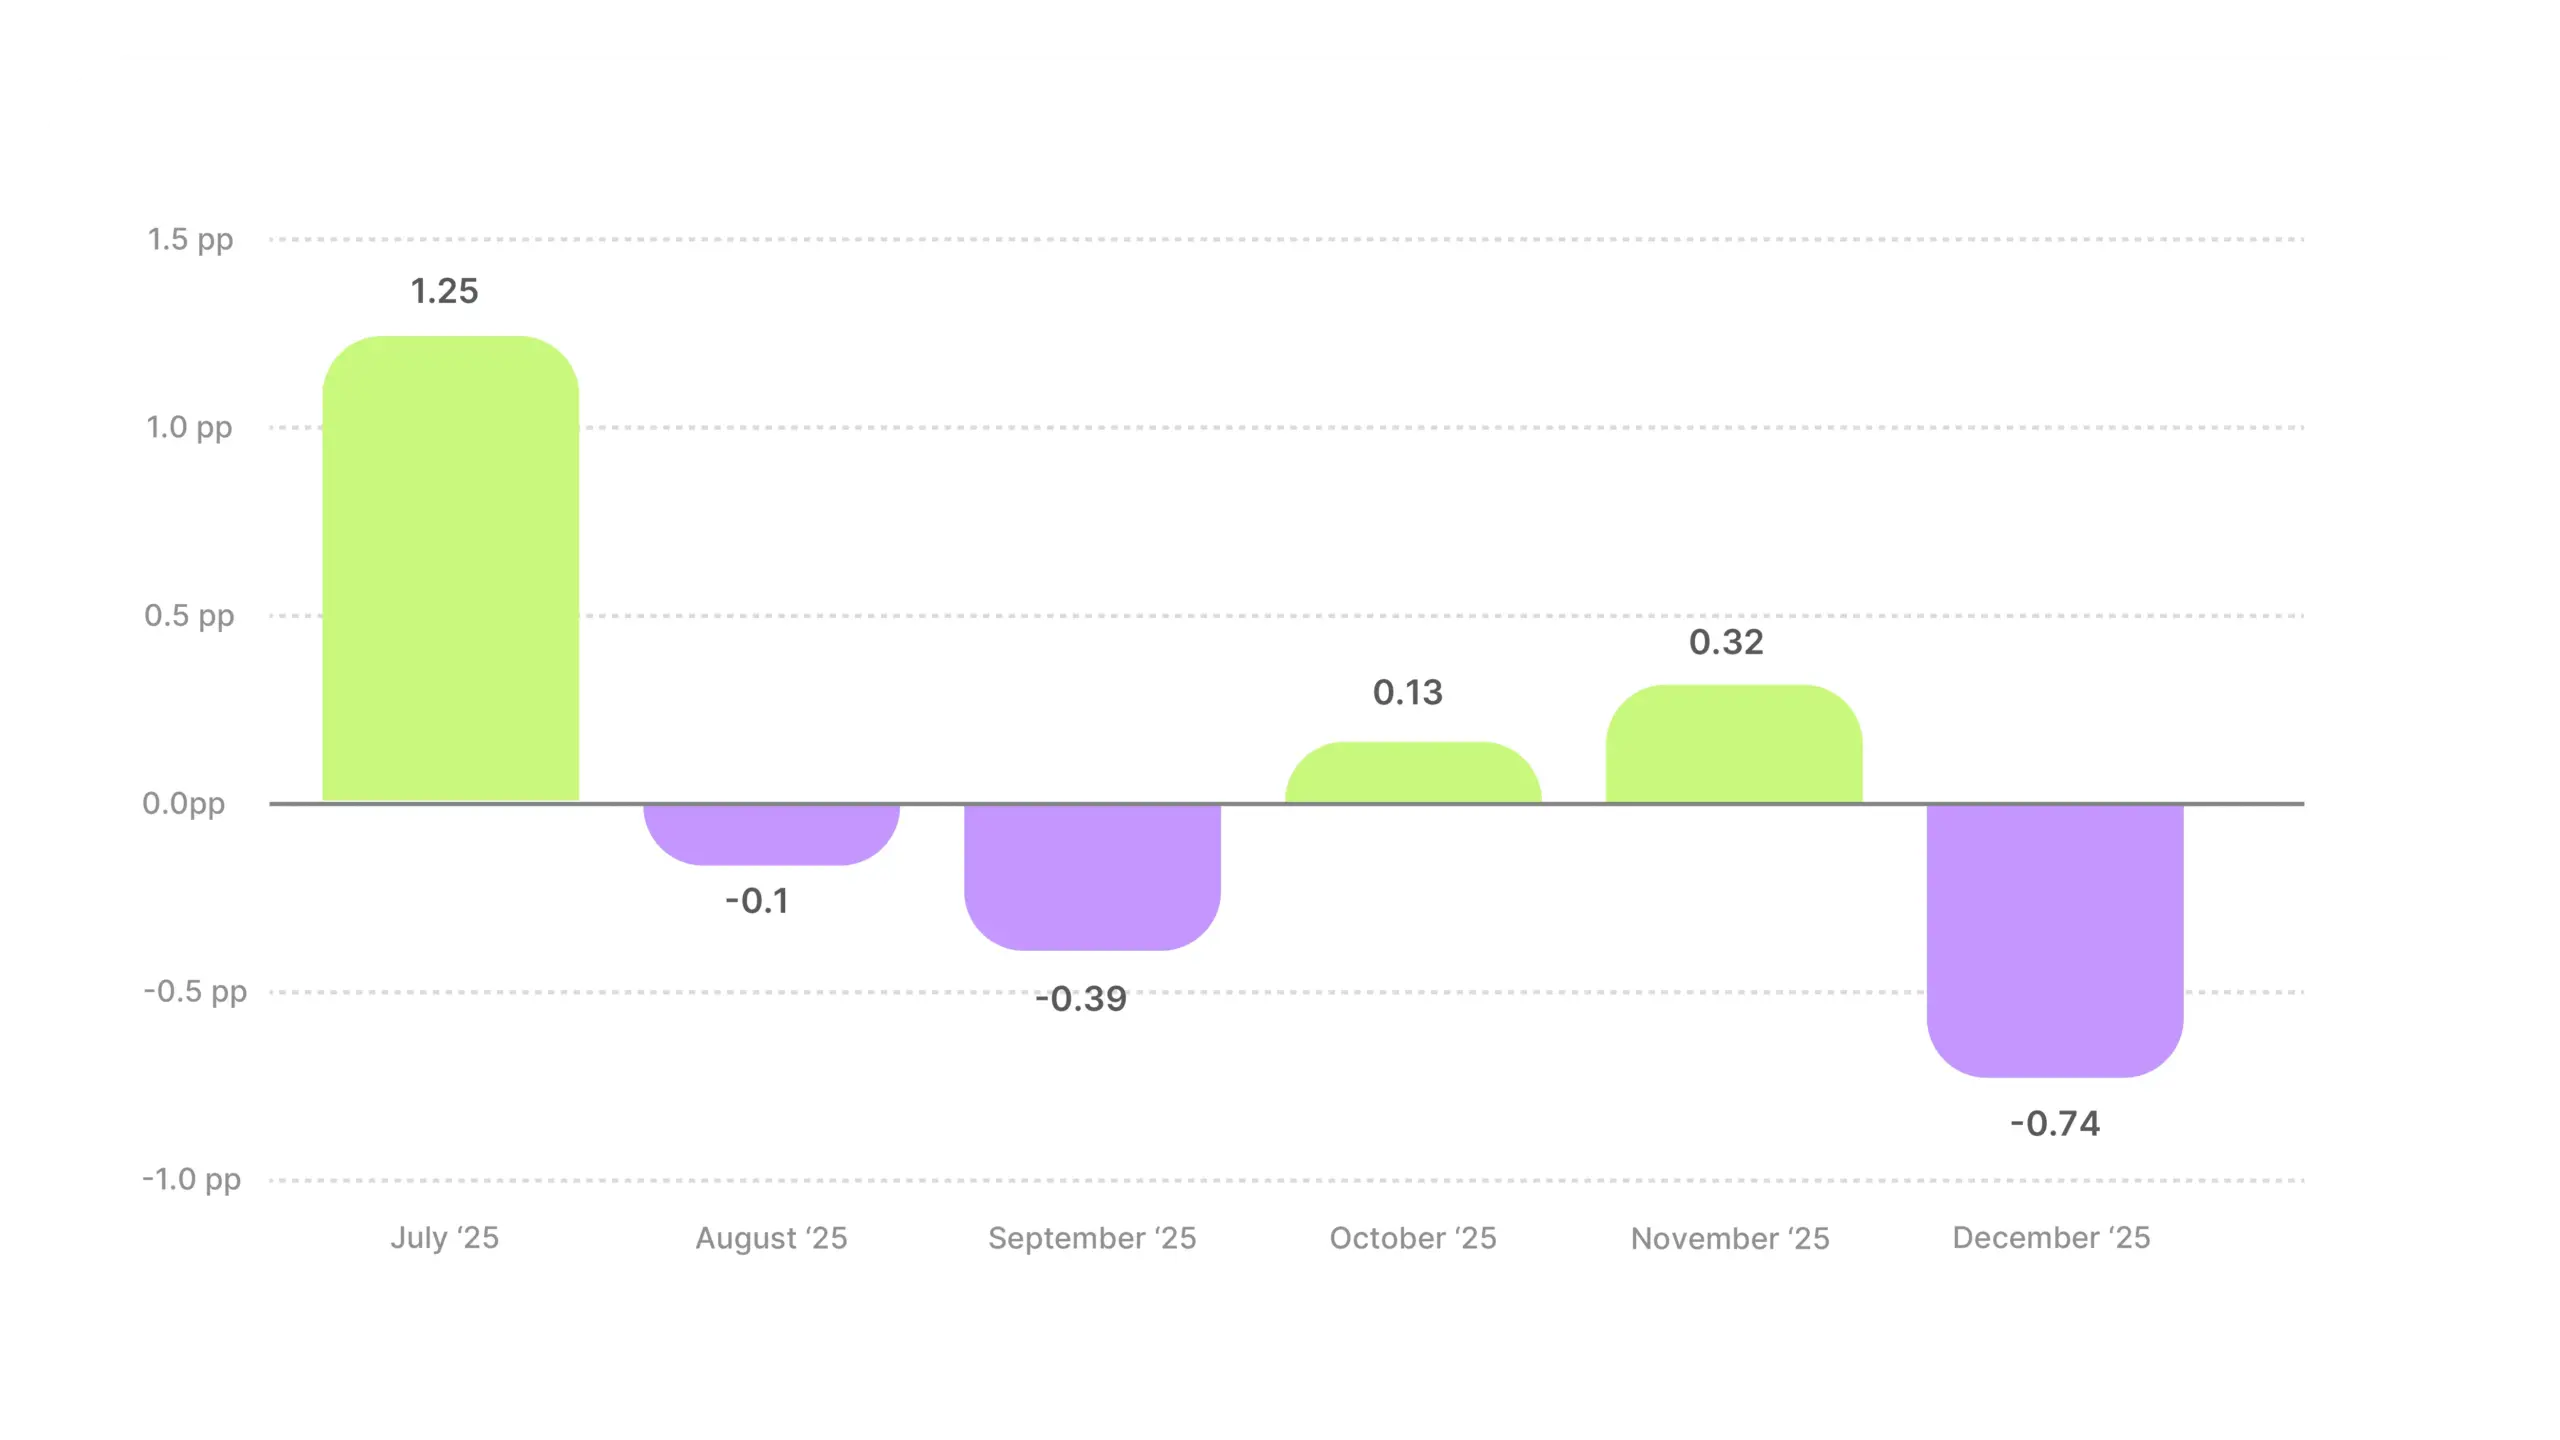
Home & Garden tracks almost exactly at the cross-industry average, with the flattest trend line of any category and a 2.17 pp spread across six months. That predictability is genuinely useful for planning, since you know what to expect from your hook rates, and surprises are unlikely in either direction.
Industry hook rate average
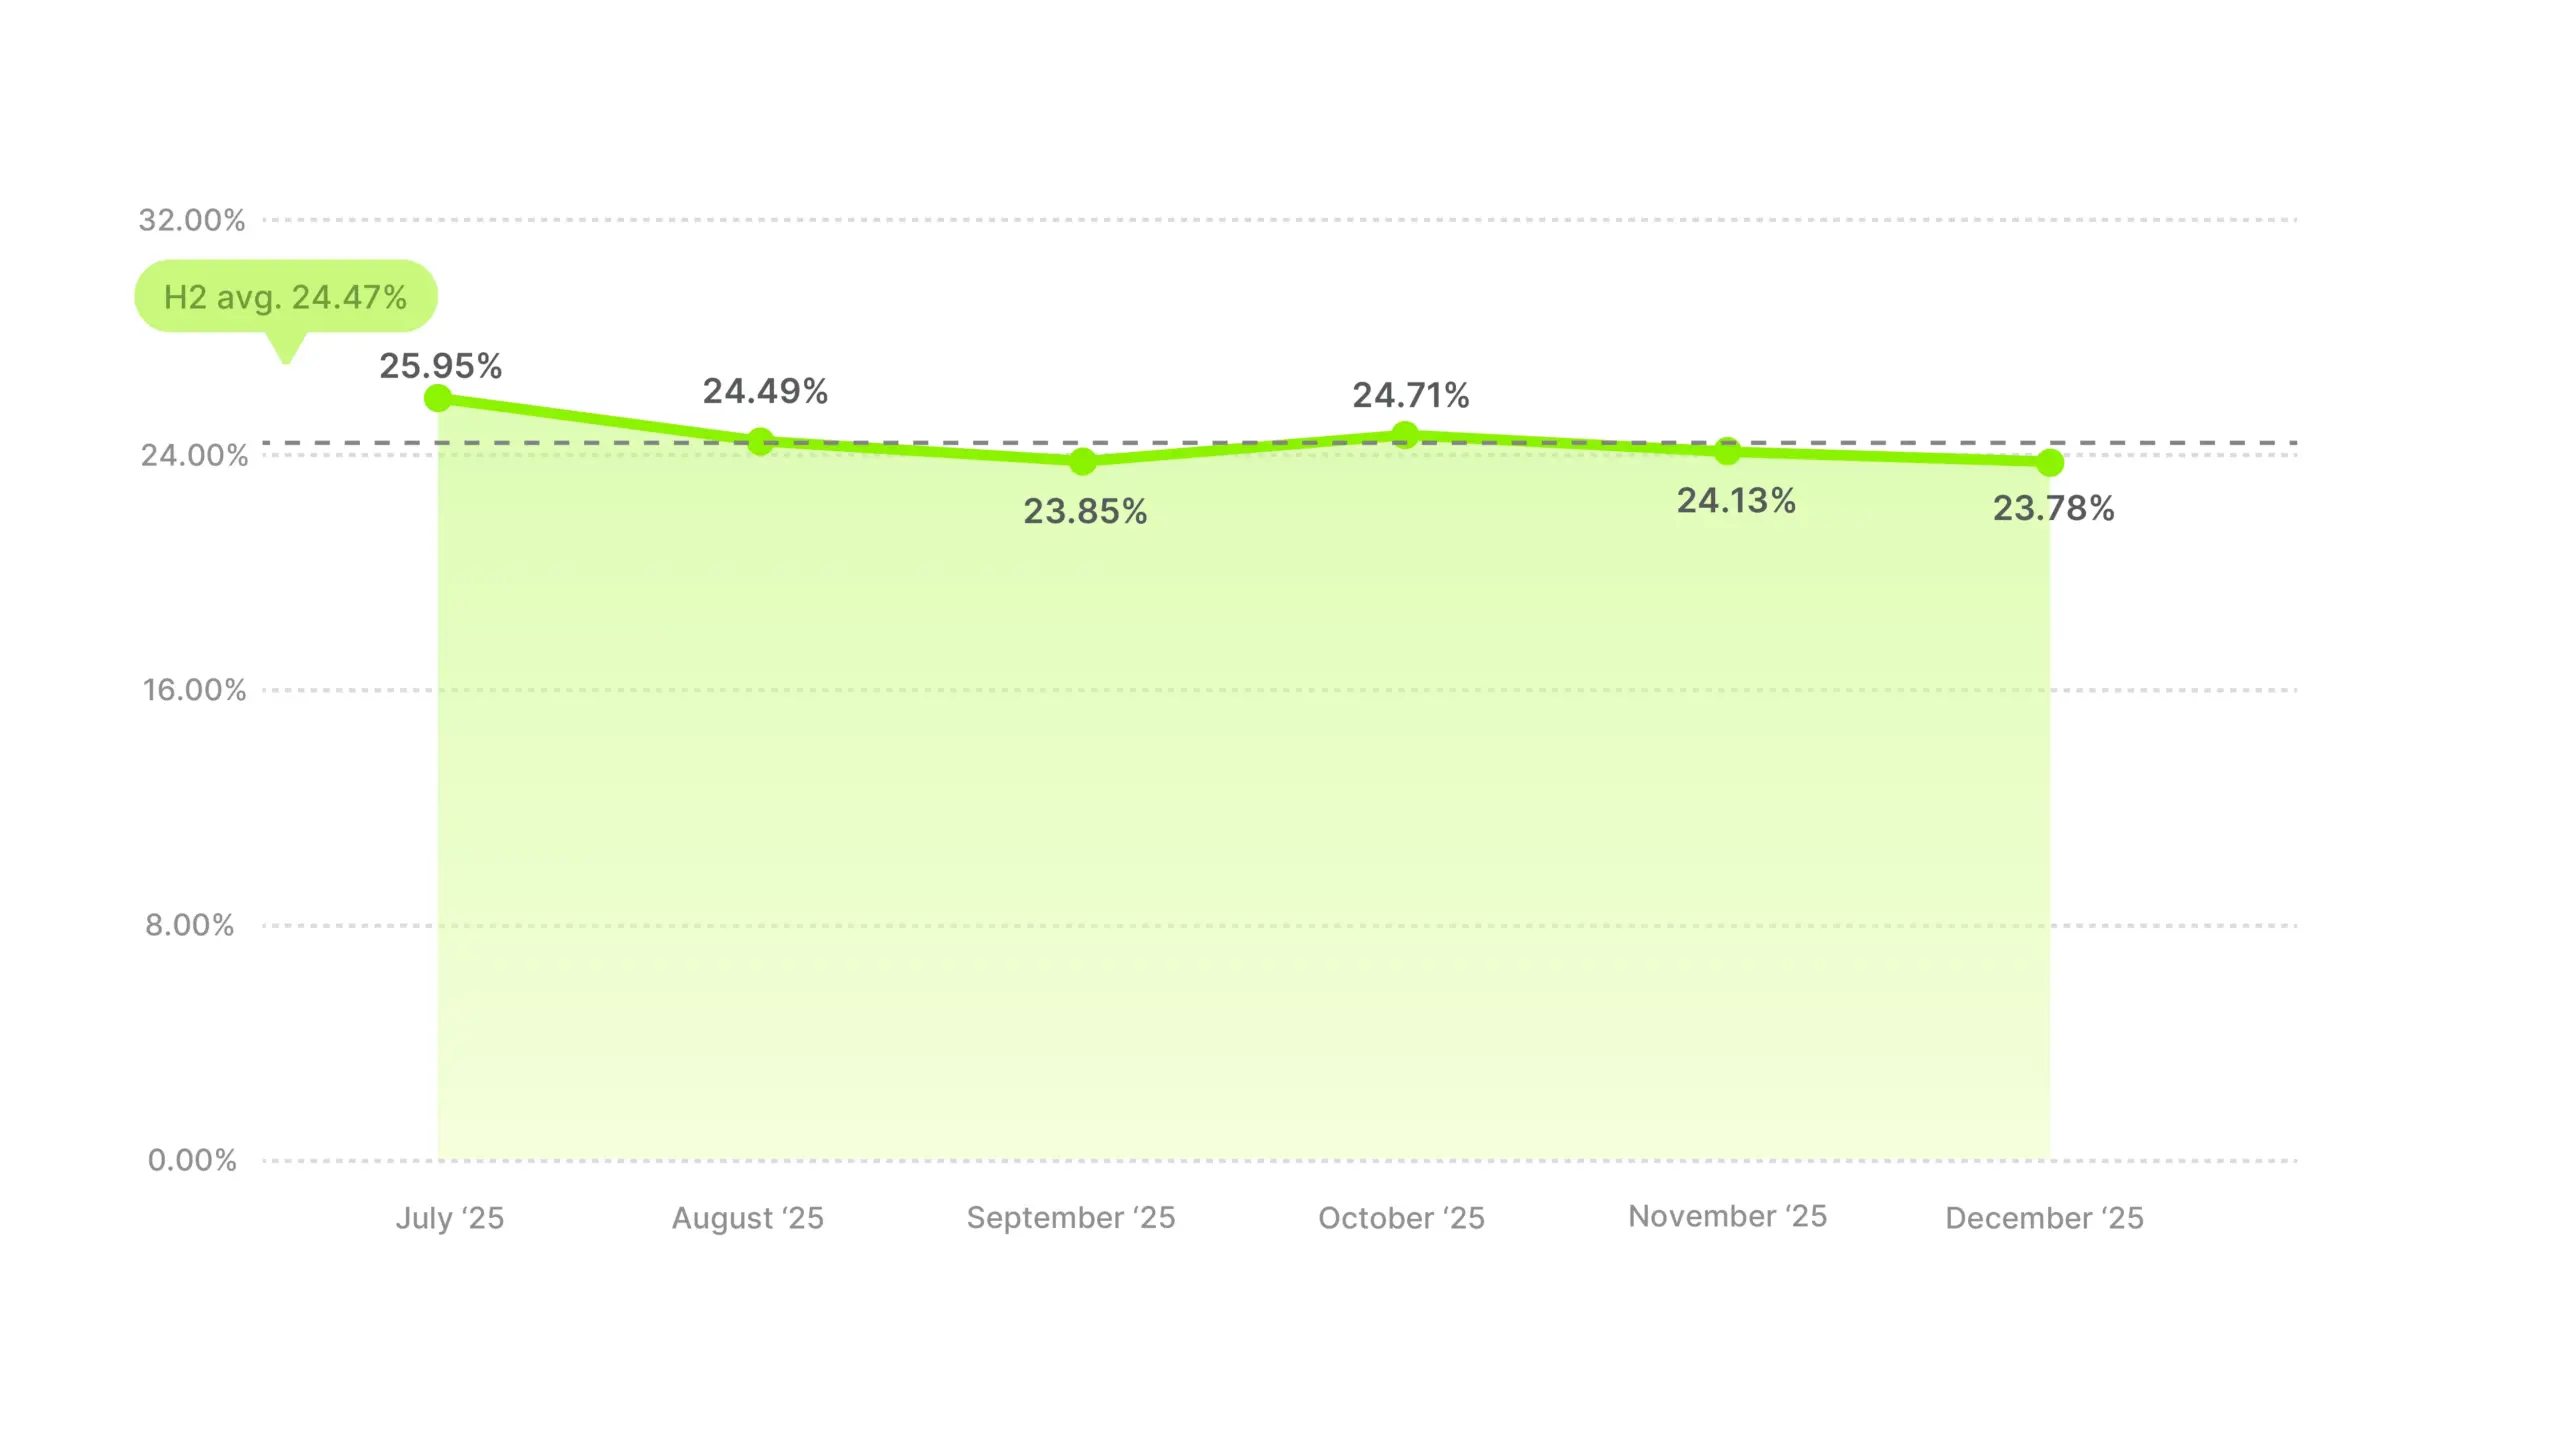
Distance from all-industry average
July’s peak makes intuitive sense, with the outdoor projects, garden season, patio setups offering many avenues for engaging creative. Summer is when this category’s content is most visually compelling, similar to Food & Beverages. The question is why the category doesn’t get a Q4 boost. Home decor, hosting prep, seasonal decorating, and giftable home products should create a tailwind in November and December. But hook rates drifted downward right through the holiday season.
One possibility is that the category is too mixed. Gardening content dragging down what home decor might be doing well on its own. Another is that the creative isn’t adapting to the seasonal shift in buyer intent. Brands still running general product content in December rather than leaning into holiday hosting (“make your home guest-ready”), seasonal transformations, or gift positioning may be missing the window.
October’s mini-bounce (+0.86 pp from September) coincided with fall decor and early holiday prep content, a small proof point that tying creative to seasonal moments works in this category, same as it did for Food & Beverages. The challenge is sustaining that approach through the rest of Q4 instead of letting hooks drift back to generic product content.
Services is the second-lowest hook rate category in the dataset, just above Animals & Pet Supplies. But the challenge here is structural, not creative in the usual sense. There’s no product to show. No UI. No demo. No unboxing. The hook has to come entirely from the message or the person delivering it. That makes this the toughest brief in social video, and potentially the one with the most untapped upside.
Industry hook rate average
Distance from all-industry average
If you’re a services brand consistently hooking above 20%, you’re already outperforming the category. The bar is lower here than in any other named vertical. Don’t measure yourself against the 24.4% cross-industry average. That benchmark includes product categories with inherent visual advantages your ads will never have. Own your category’s reality and compete within it.
The creative format likely matters more in this category than any other. In product categories, even mediocre creative has something visual to fall back on. In Services, format is the entire hook. Talking-head vs. text overlay vs. scenario-based storytelling vs. problem-first framing. The choice probably drives more variance here than anywhere else. If you’re running the same video format month after month, you’re almost certainly leaving hook rate on the table.
The structural gap (nearly 4.5 pp below the market) is real, but it’s also an opportunity. A services brand that cracks the code on a repeatable video hook format, one that consistently earns attention without a product to show, would have an enormous competitive advantage within the category.
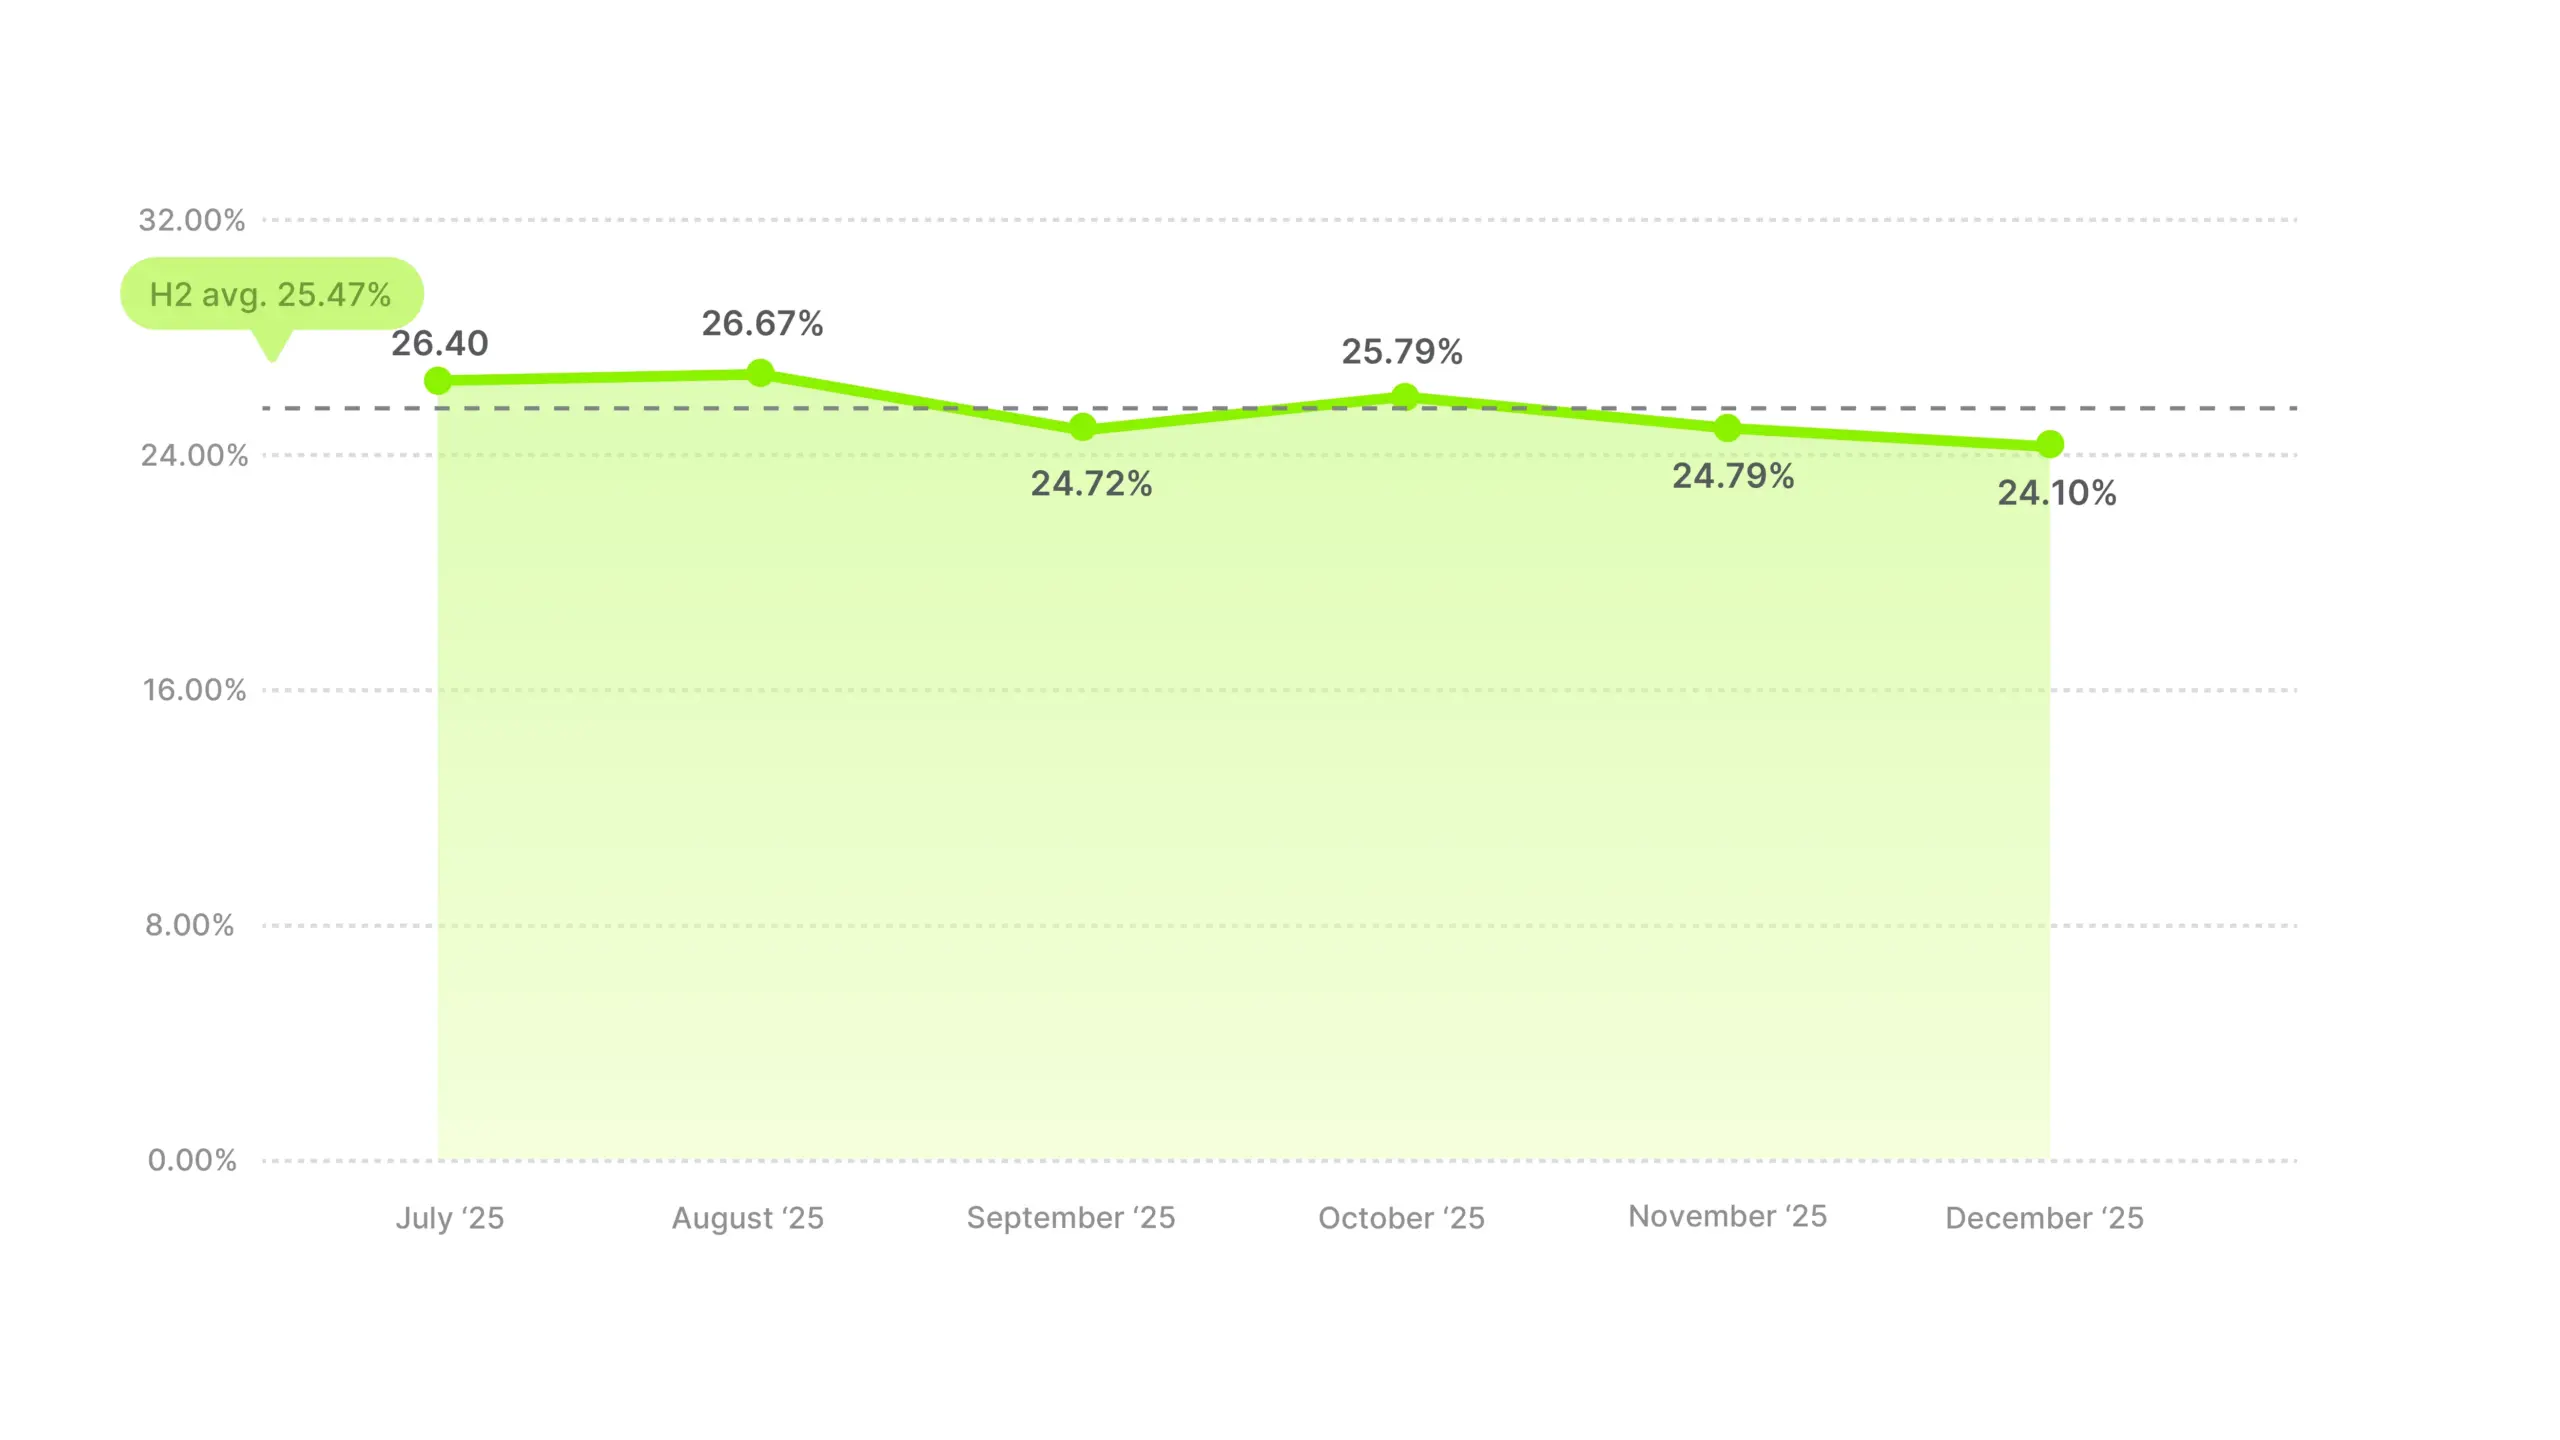
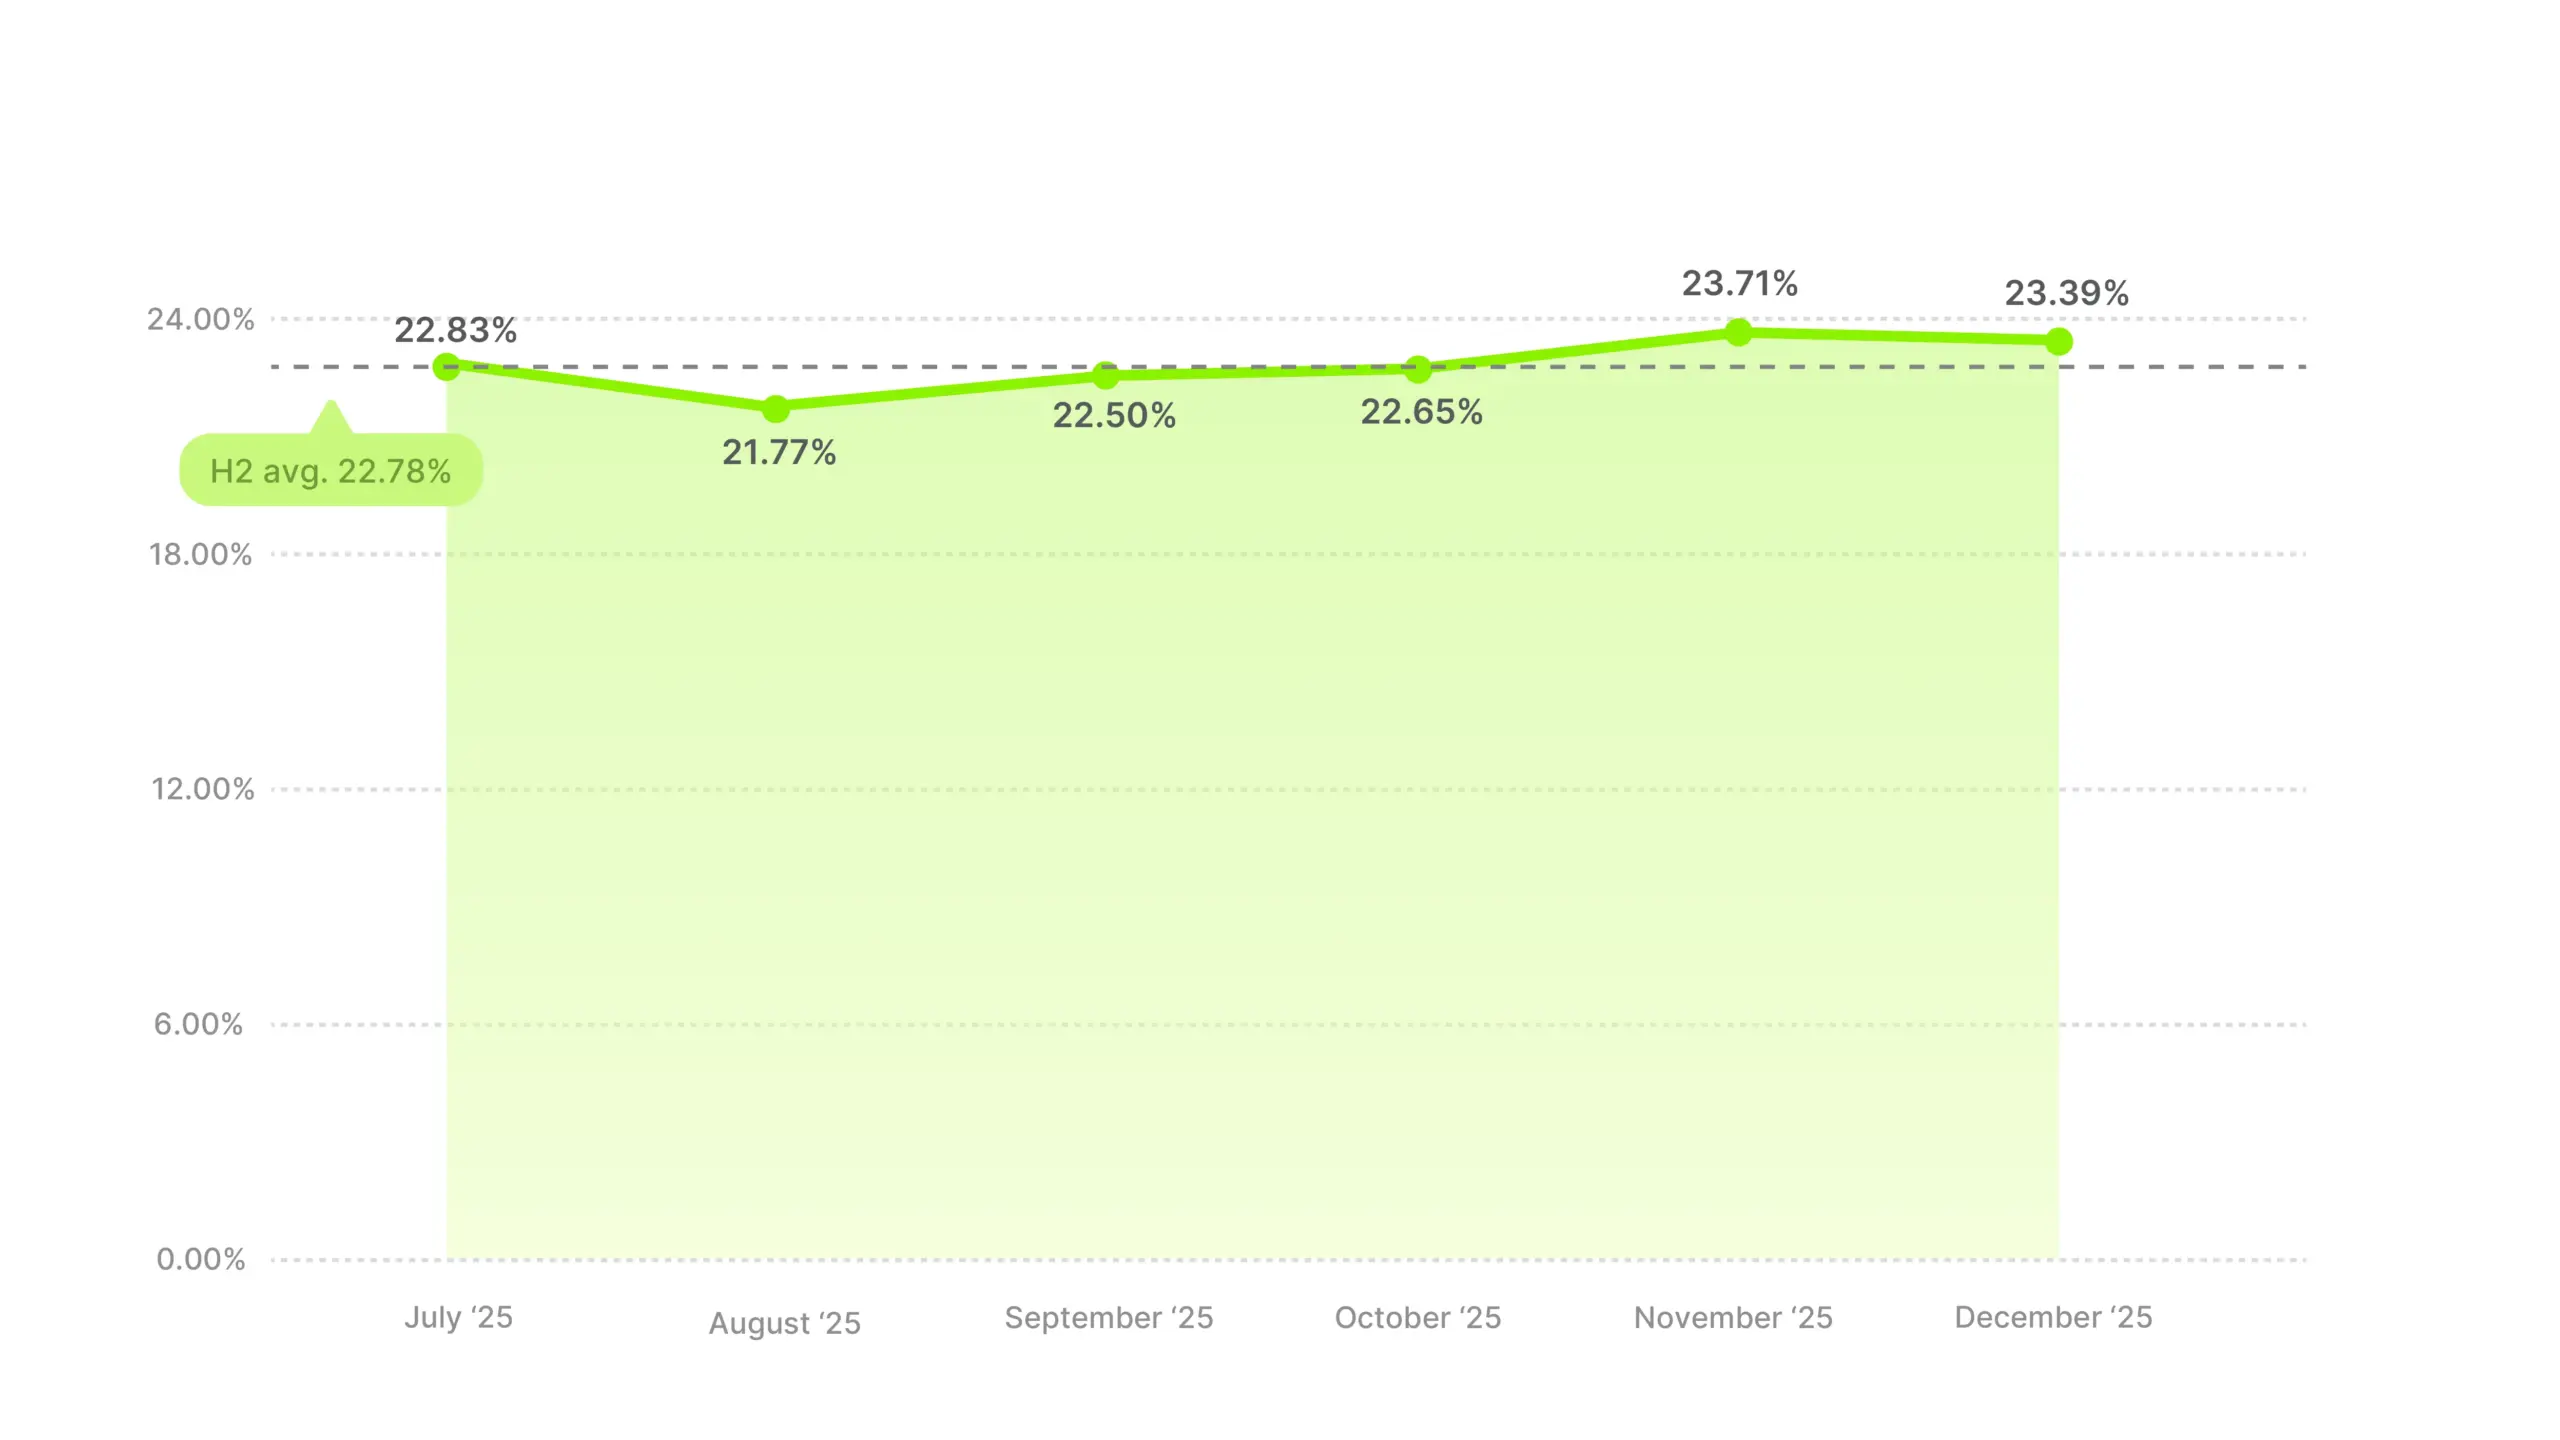
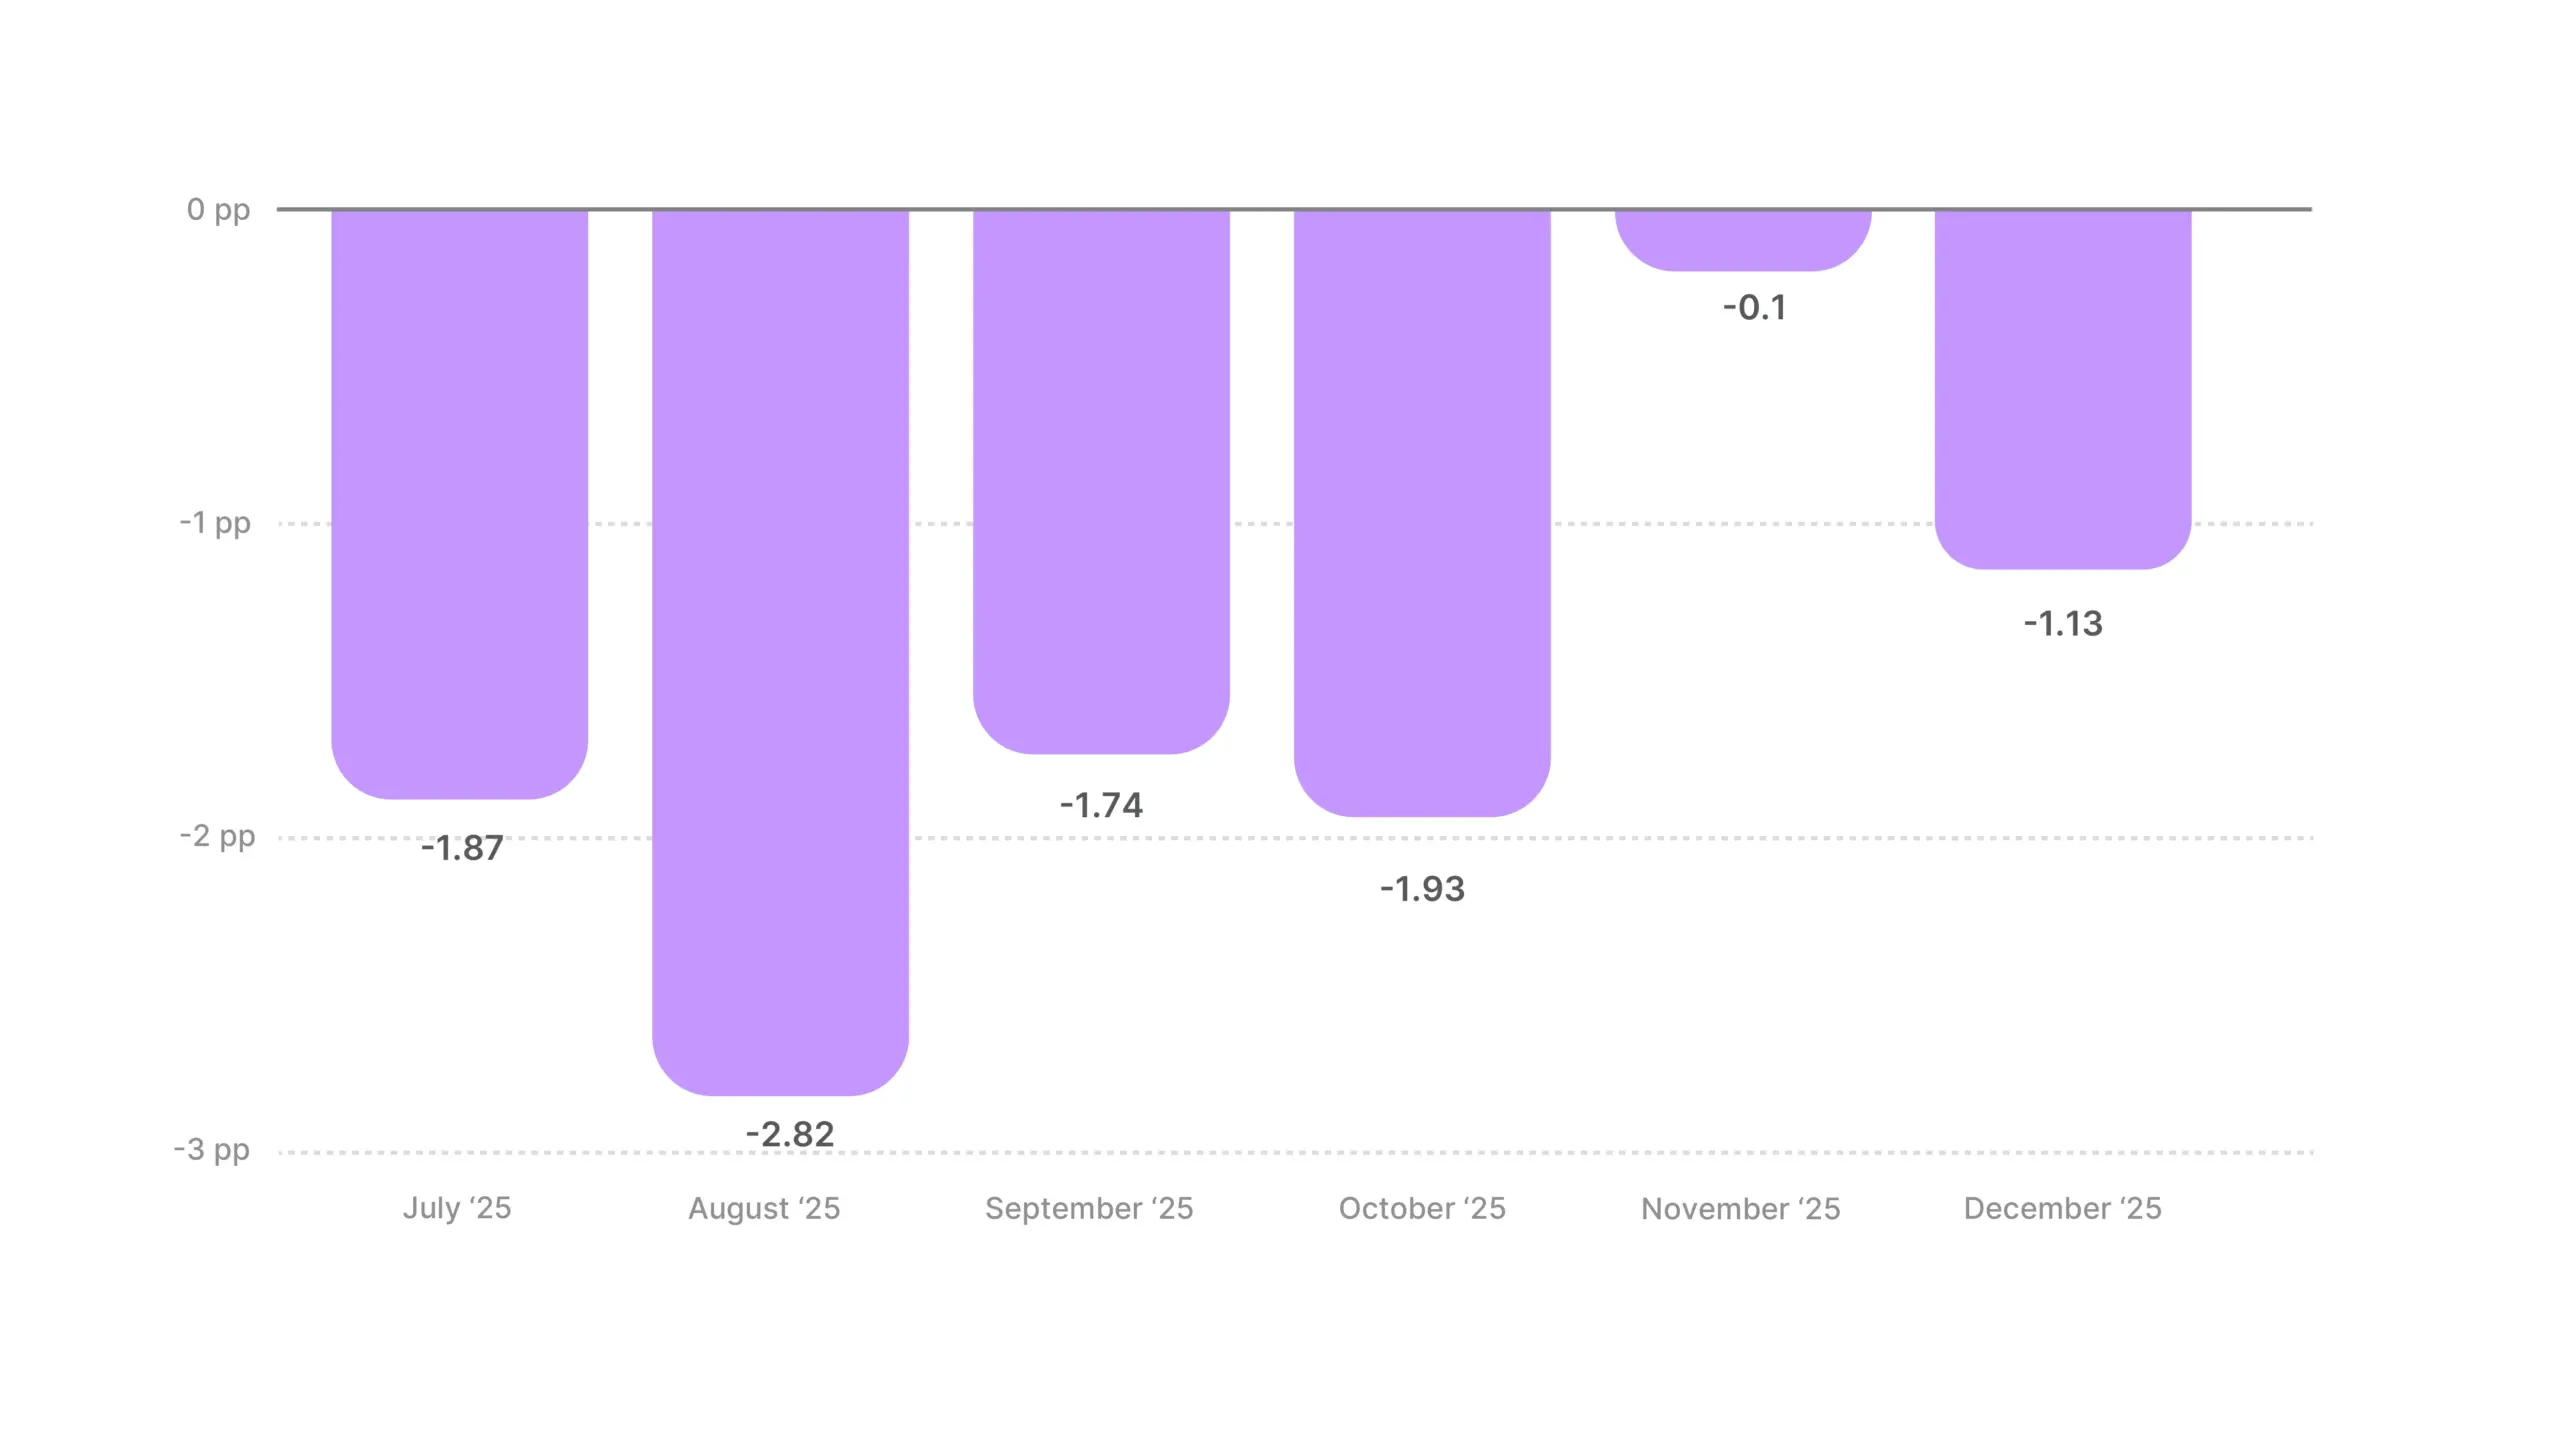
Software sits below the cross-industry average, but the H2 trendline is the most encouraging in the dataset. From an August low of 21.77% to a November peak of 23.71%, the category posted a steady 2 pp climb over four months. And unlike most categories, it showed no Q4 weakness at all.
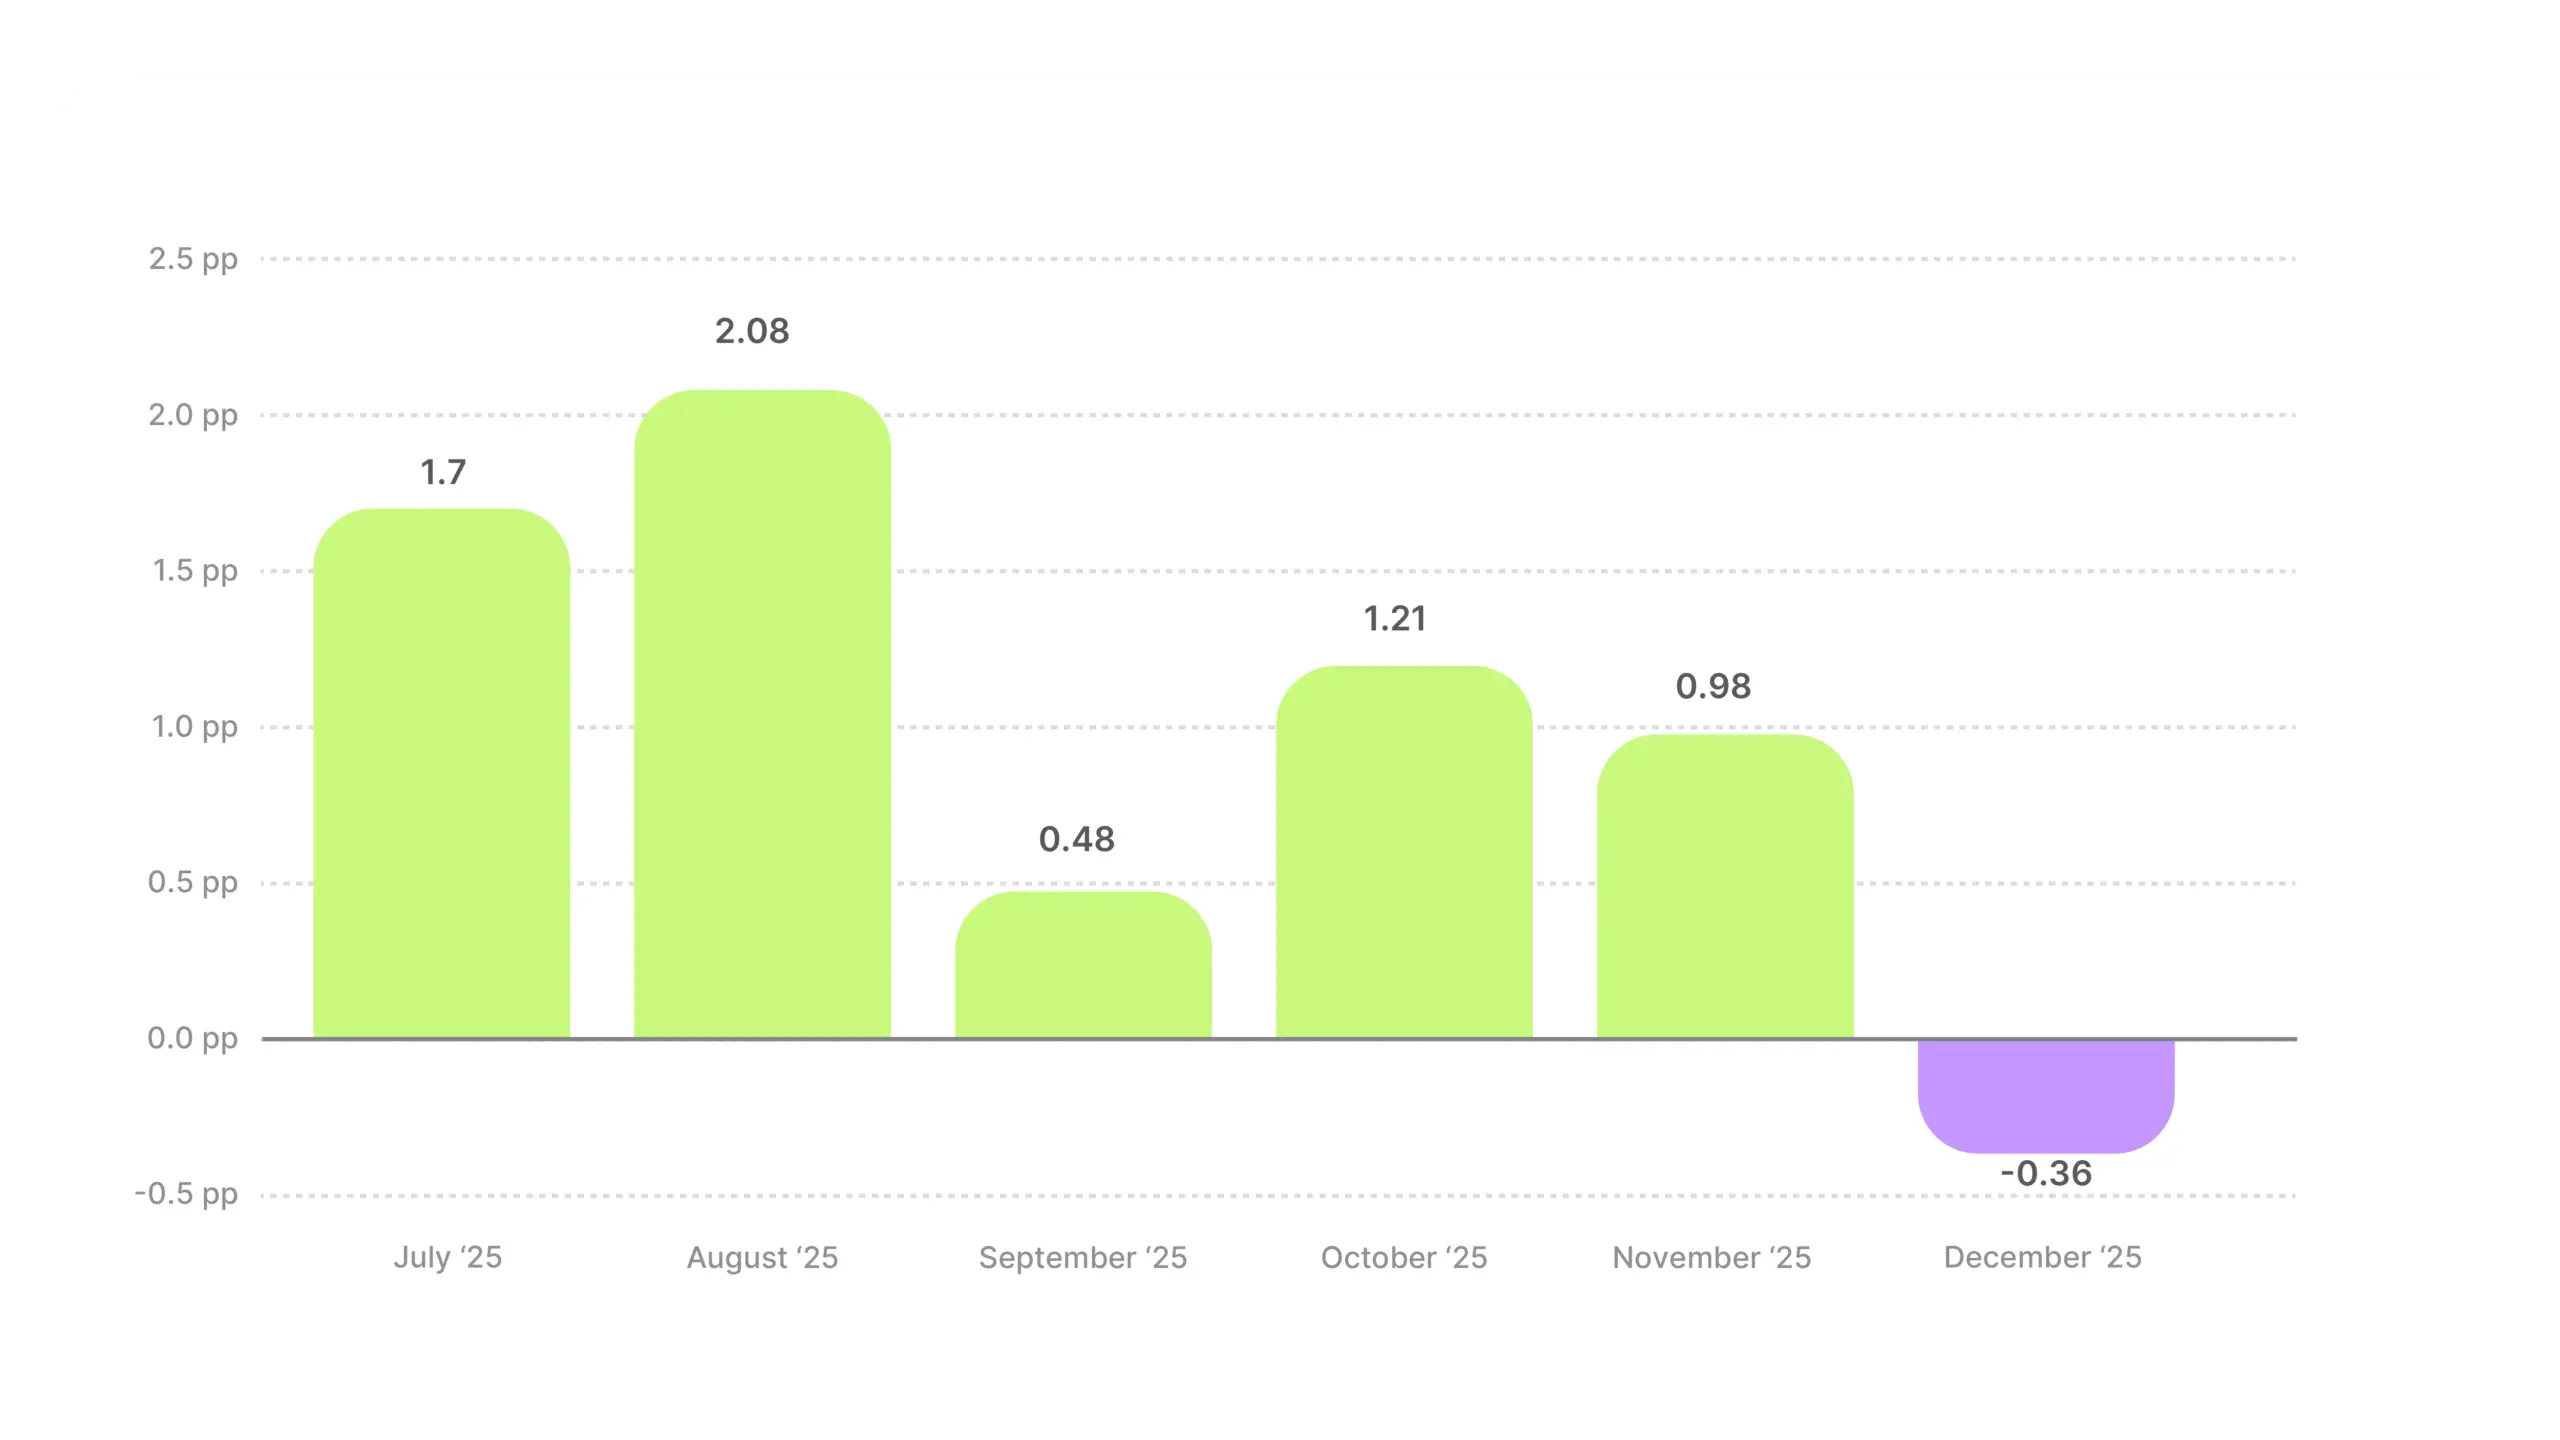
Industry hook rate average
Distance from all-industry average
Software doesn’t compete in the gifting space, and that absence of holiday noise is exactly what lets it improve while consumer categories stumble. Like Business & Industrial, Software benefits from a cleaner feed in Q4 when the professional audience lane opens up. If you’re a software brand planning annual budgets, resist the instinct to wind down video spend in November and December. The data says this is when your hooks face the least competition.
22.78% is low for a category that has a lot of creative raw material to work with. Messy-workflow-to-clean-dashboard transformations, relatable frustrations (too many tabs, lost files, manual processes), satisfying UI moments (smooth animations, one-click automations). The visual hooks exist. The category likely defaults to product demos and feature walkthroughs that explain what the software does but don’t grab attention fast enough. The opening seconds need to lead with the problem or the payoff, not the product tour.
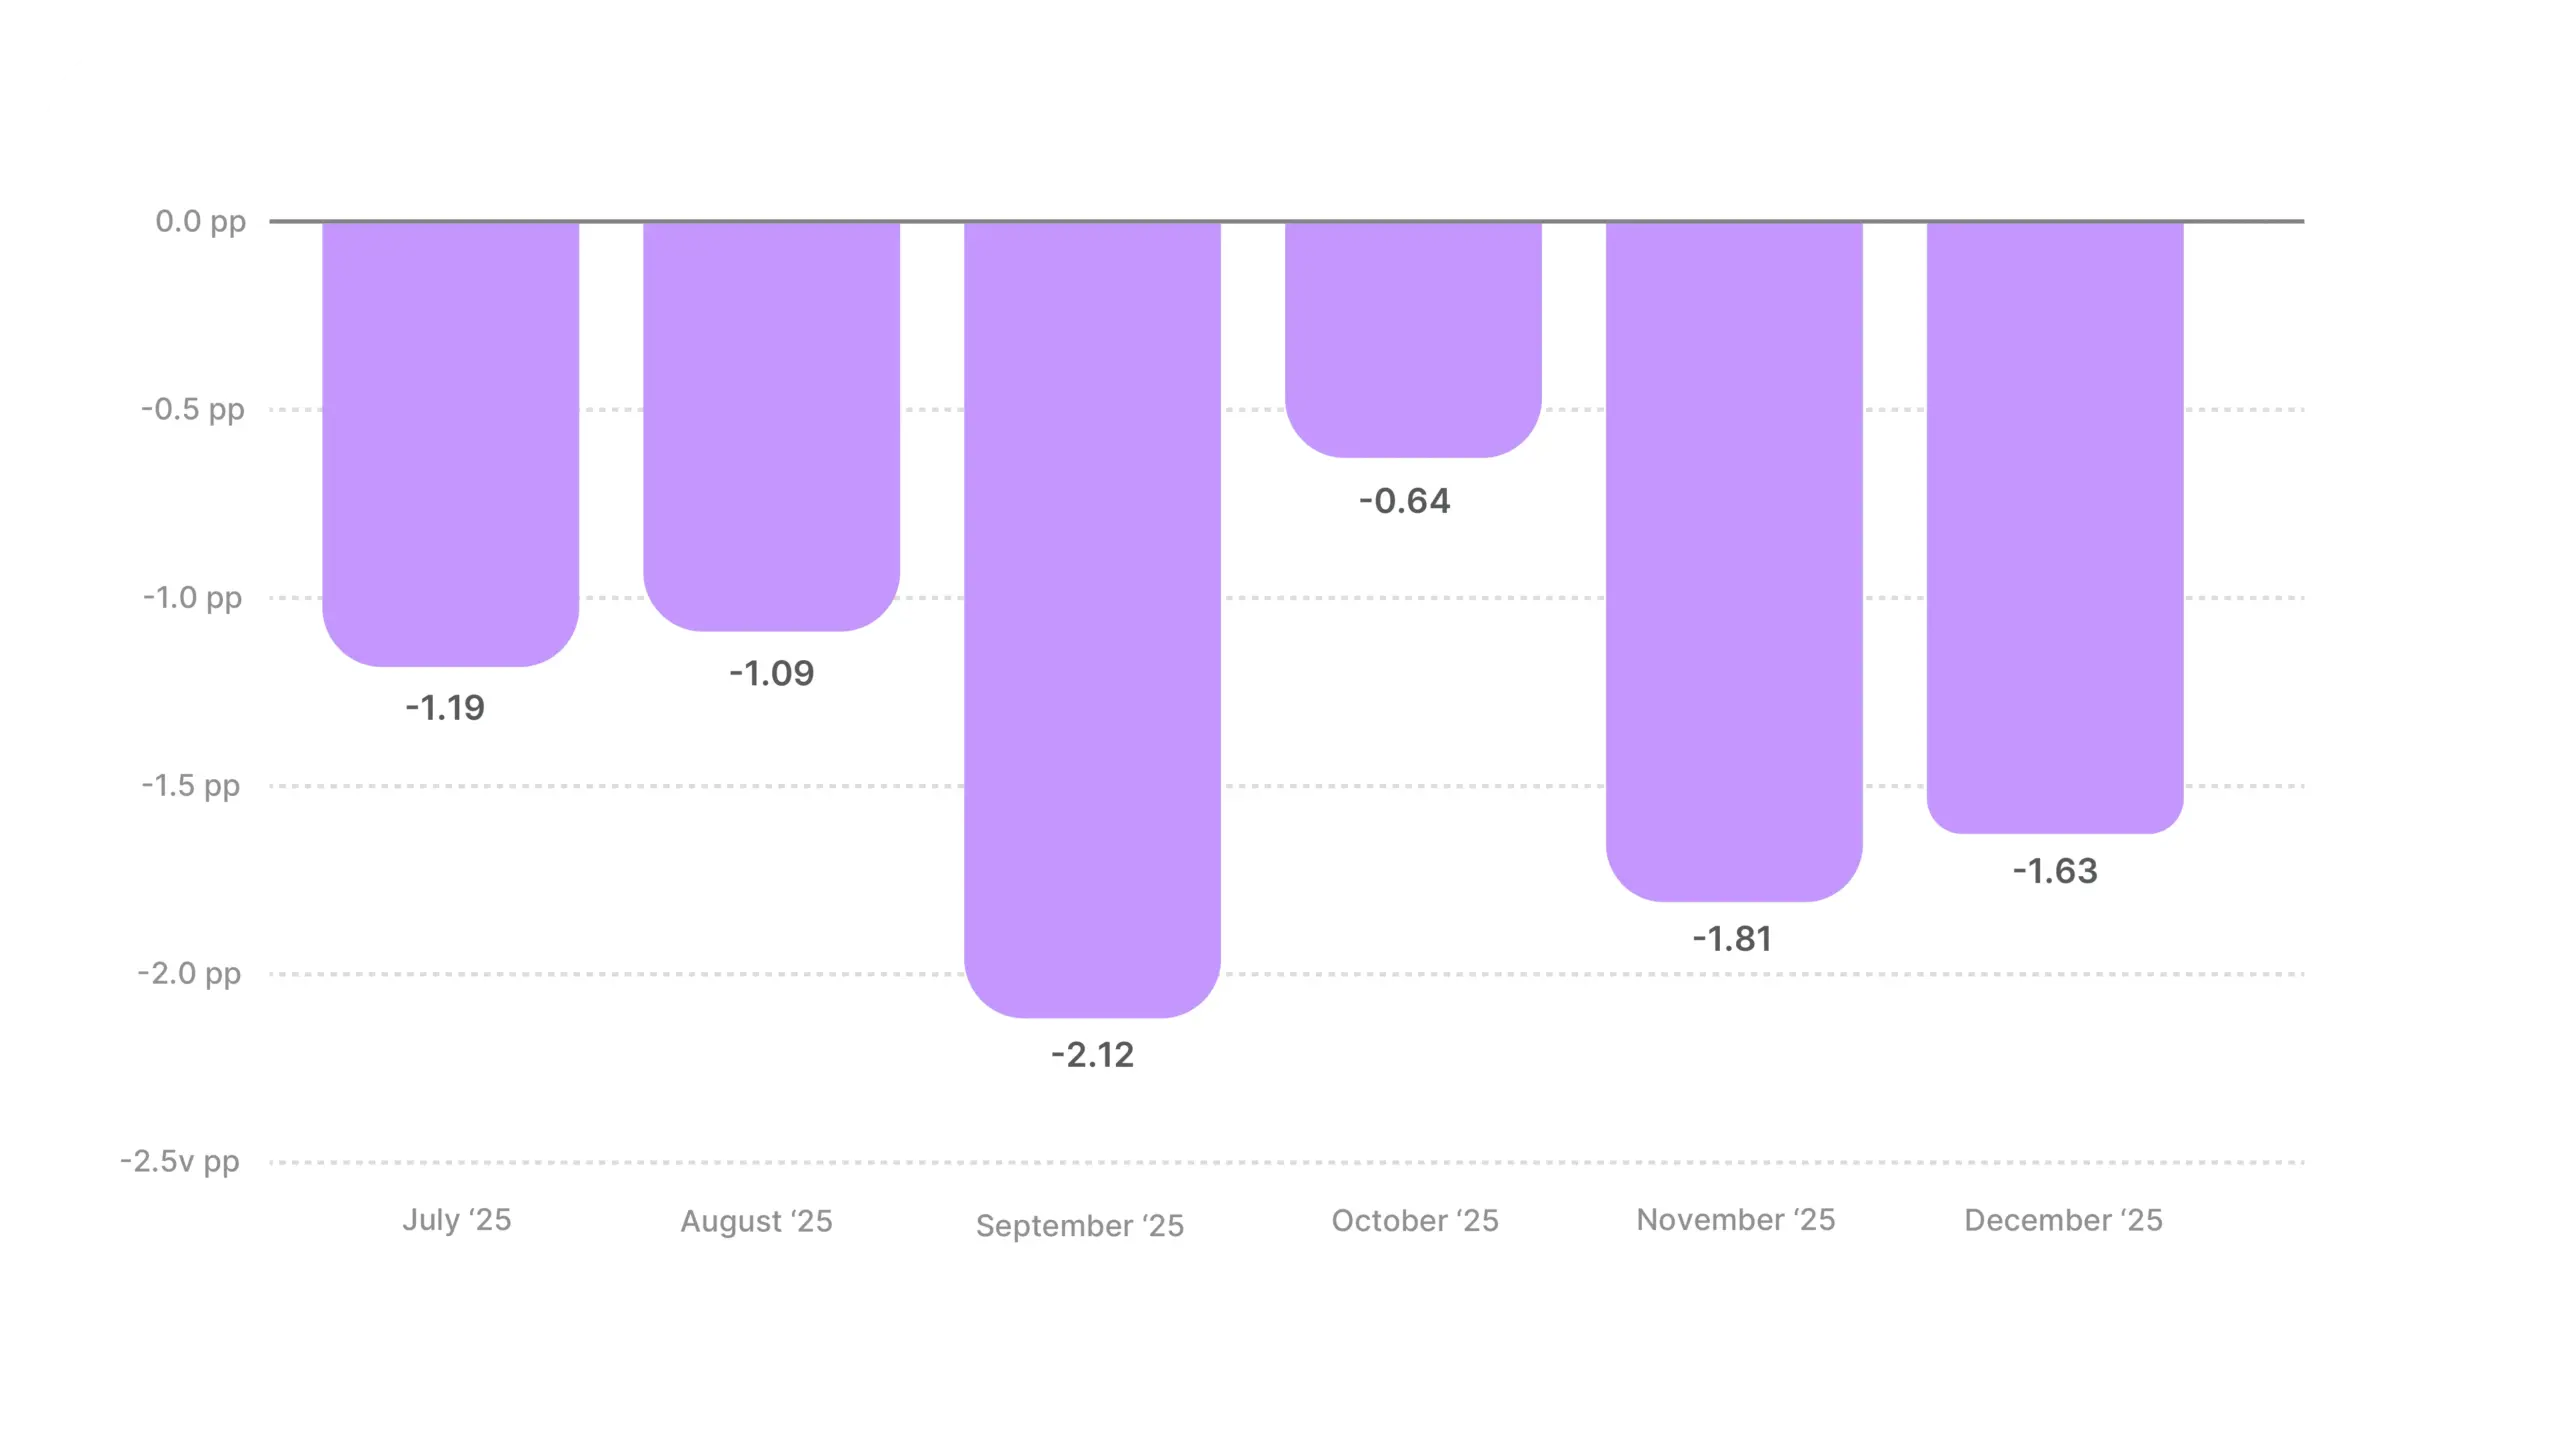
Sporting Goods sits about 1.4 pp below the cross-industry average, and the pattern over six months is relatively flat, with no directional trend. The question isn’t “what went wrong in a particular month?” It’s “why can’t these hooks break through?” in this industry.
Industry hook rate average
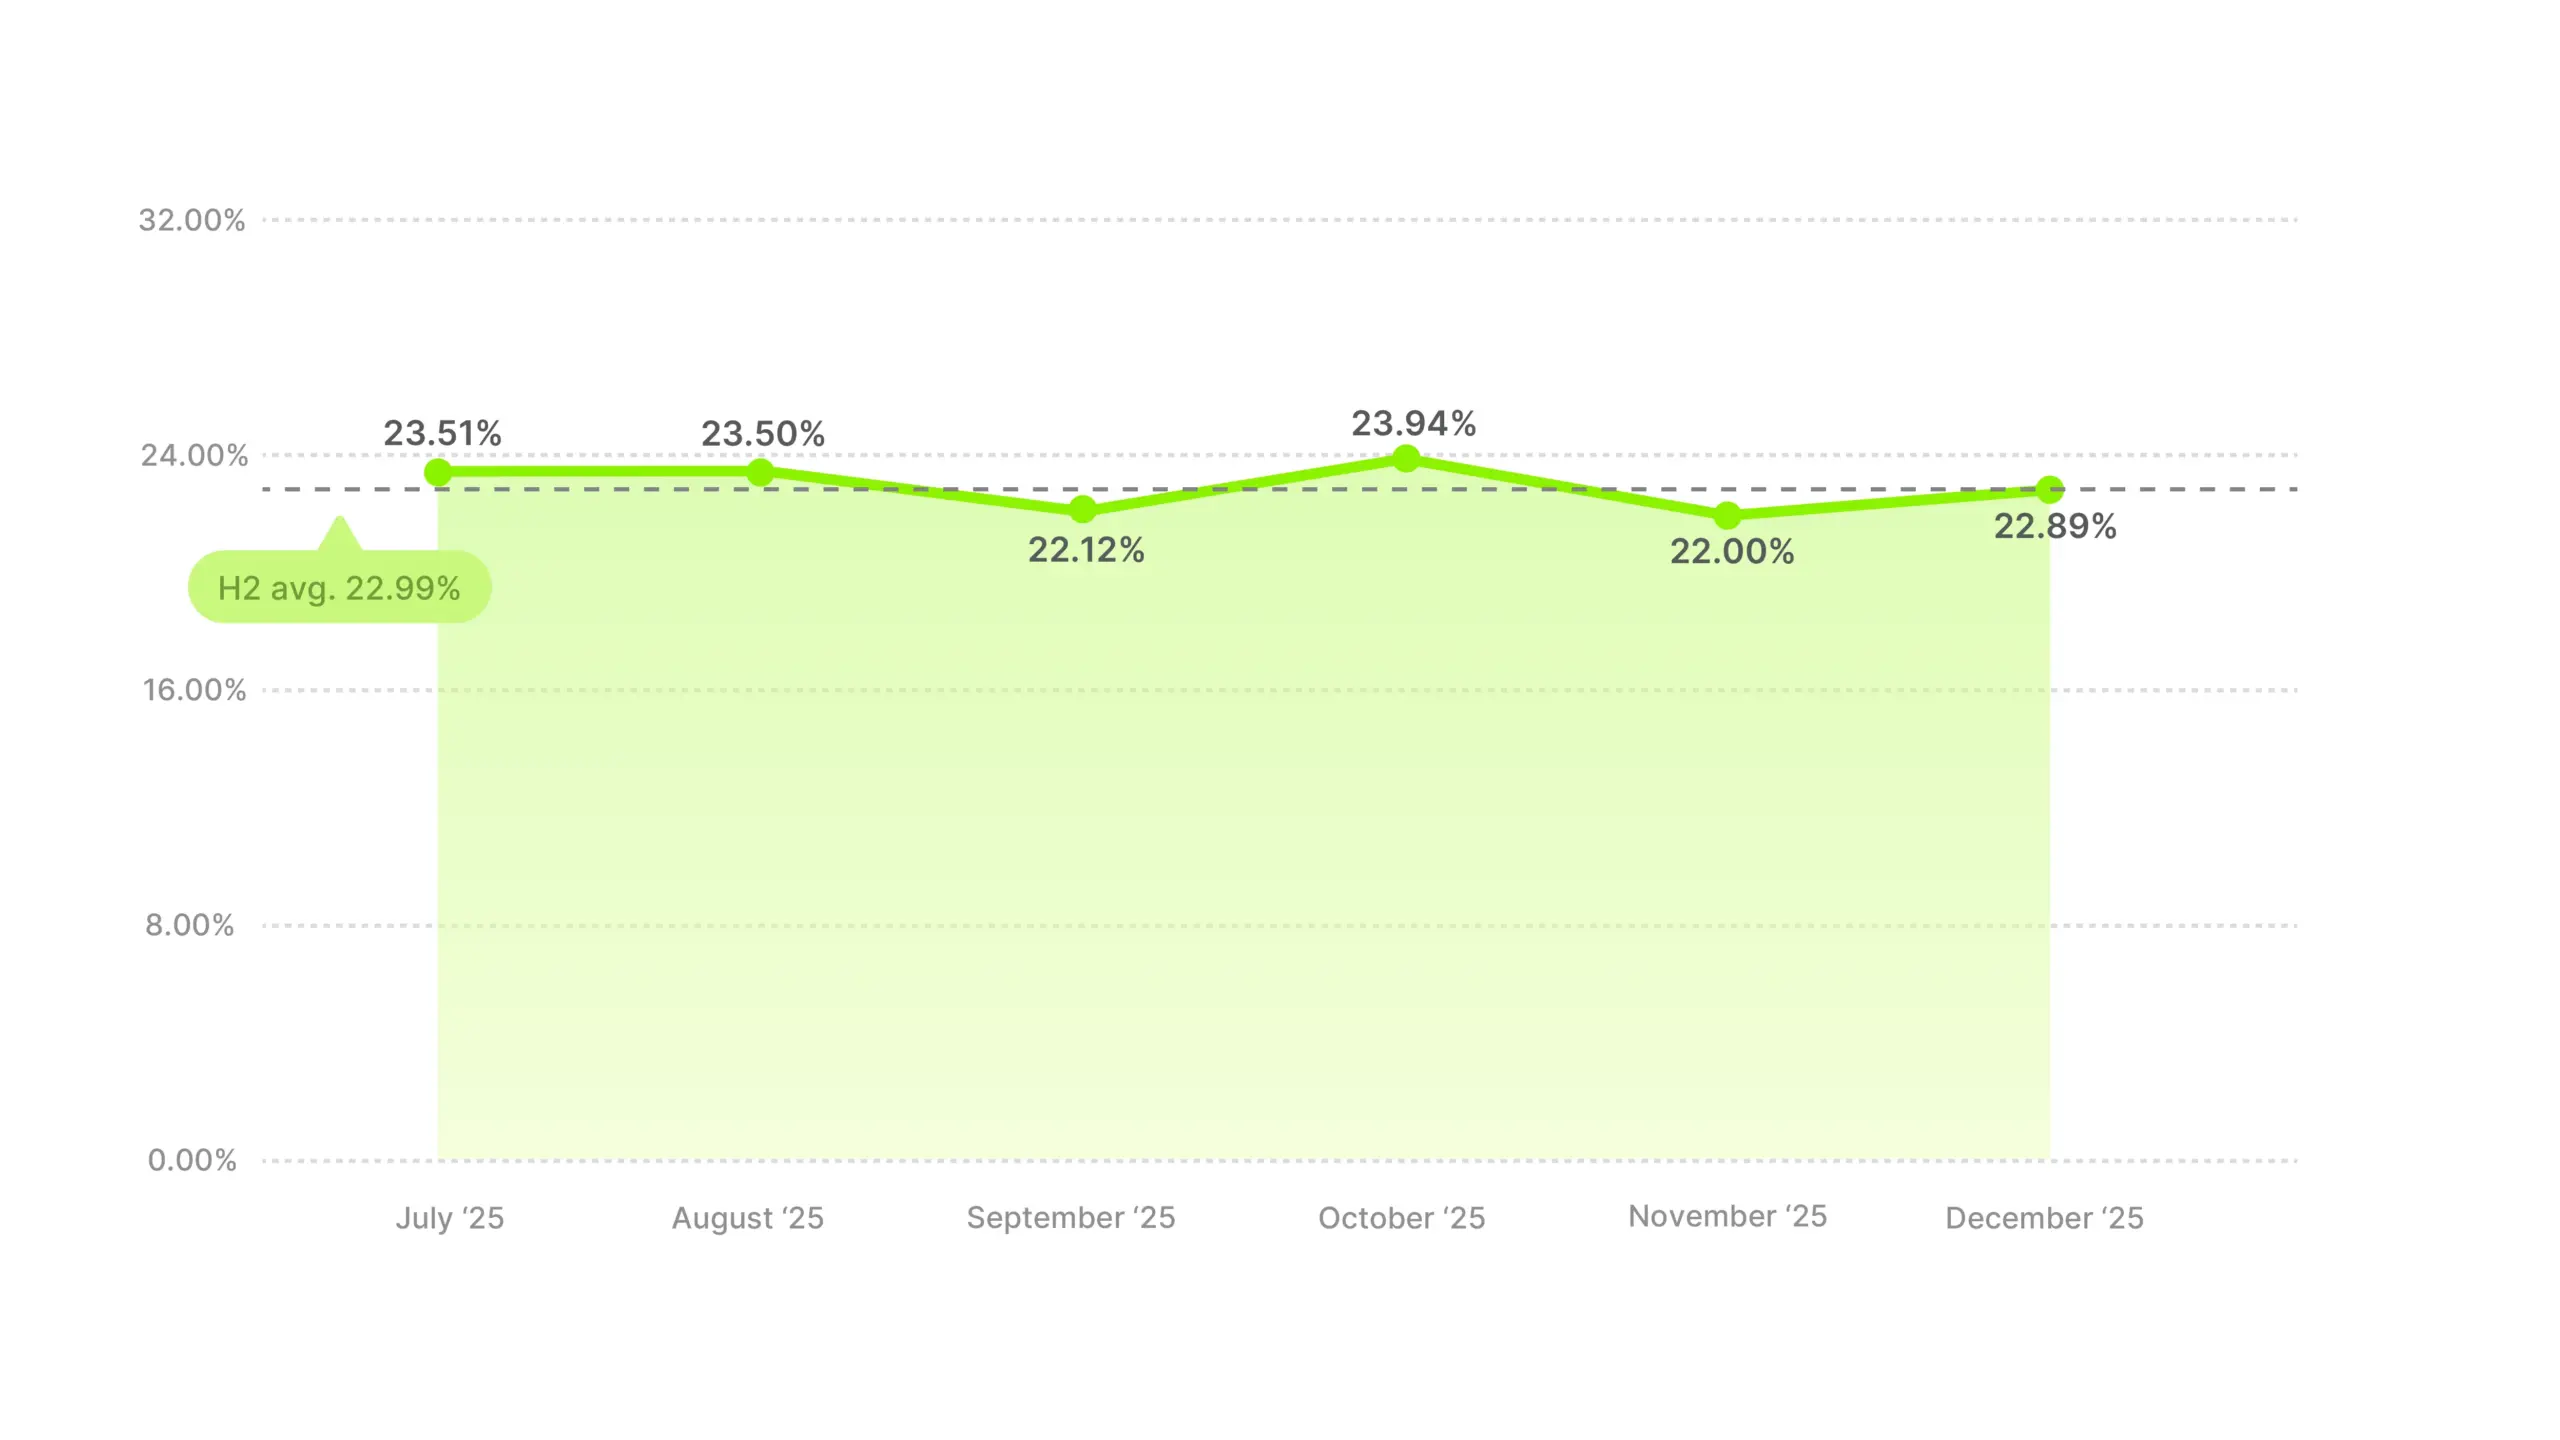
Distance from all-industry average
The category has exciting, dynamic products. Resistance bands, running shoes, fitness gear, outdoor equipment. There’s no shortage of visual material, but the problem is likely sameness. When every sporting goods ad opens with someone running, lifting, or using the gear in a workout clip, nothing stands out. A resistance band ad looks like every other resistance band ad.
Compare this to Animals & Pet Supplies, which also sits below average. Pet products face a product differentiation problem (one dog food bag looks like another). Sporting goods has the opposite problem: the products are visually distinct and exciting, but the creative approach has homogenized. That’s a creative strategy problem, and creative strategy problems are more solvable than product limitations.
Breaking above 23% consistently would put you ahead of most of the category. October’s 23.94% was the best the category managed. No seasonal tailwind or headwind works in this category’s favor, which means performance improvements have to come entirely from creative.
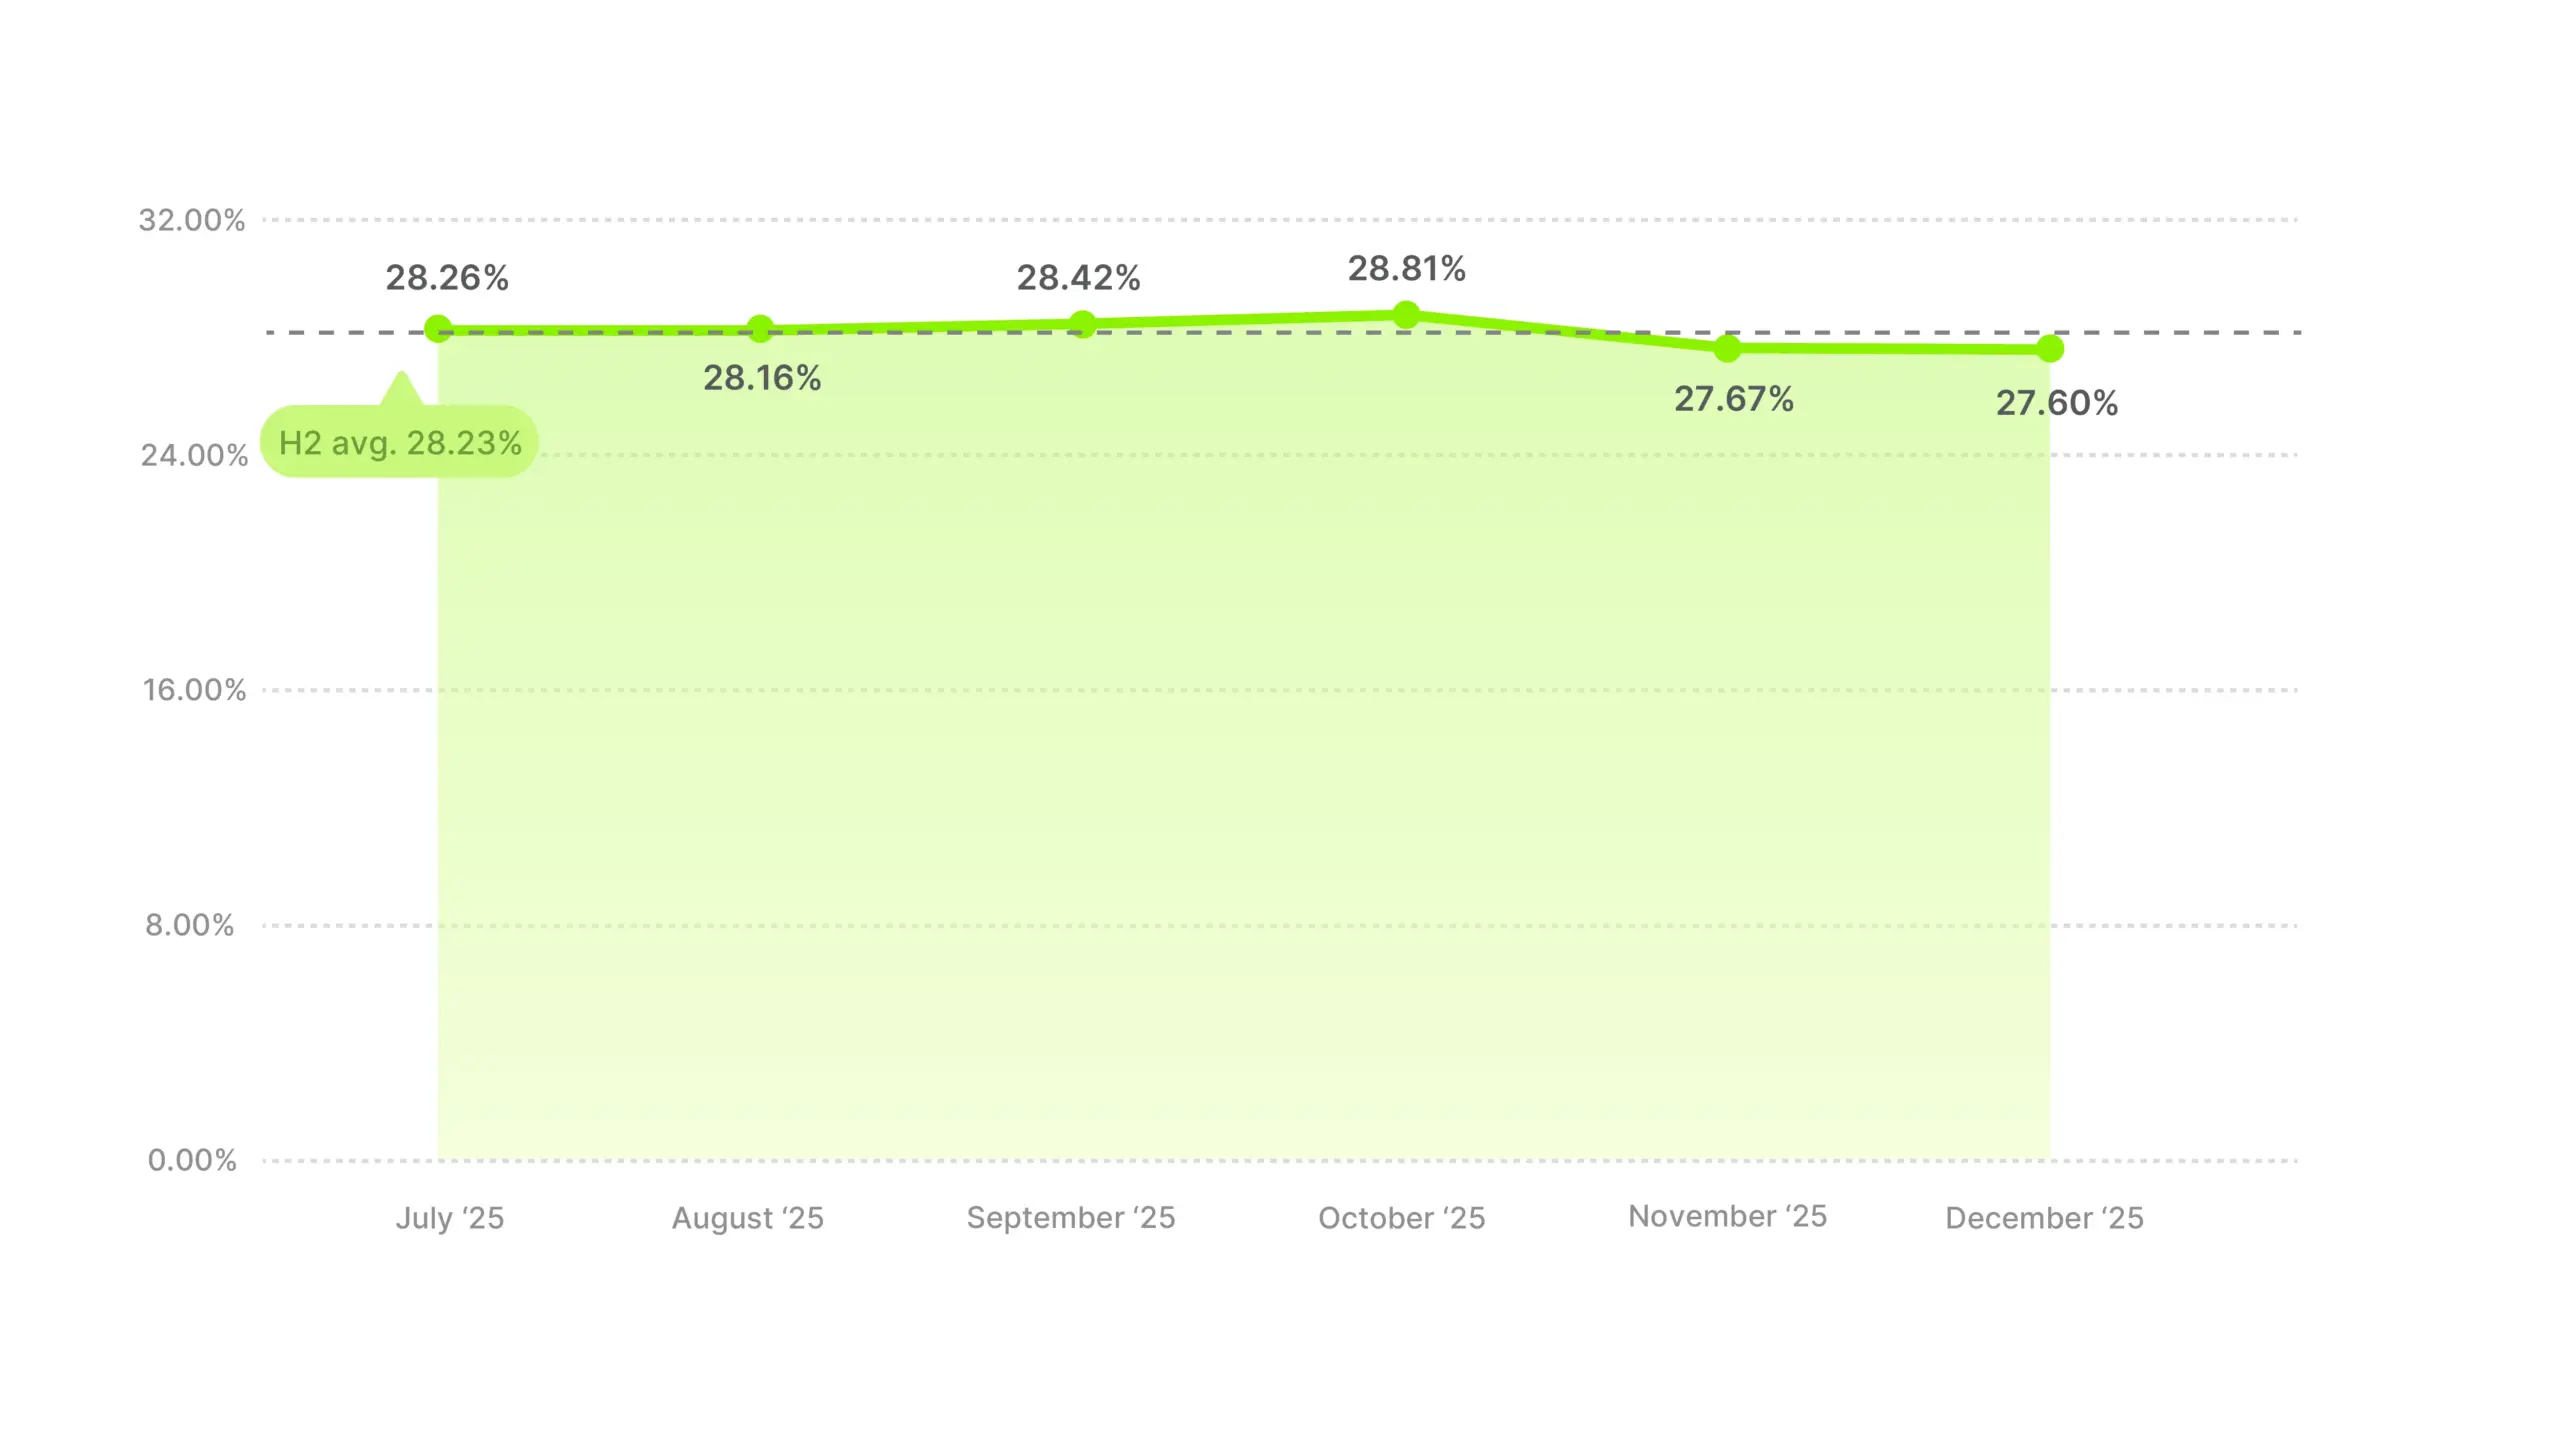
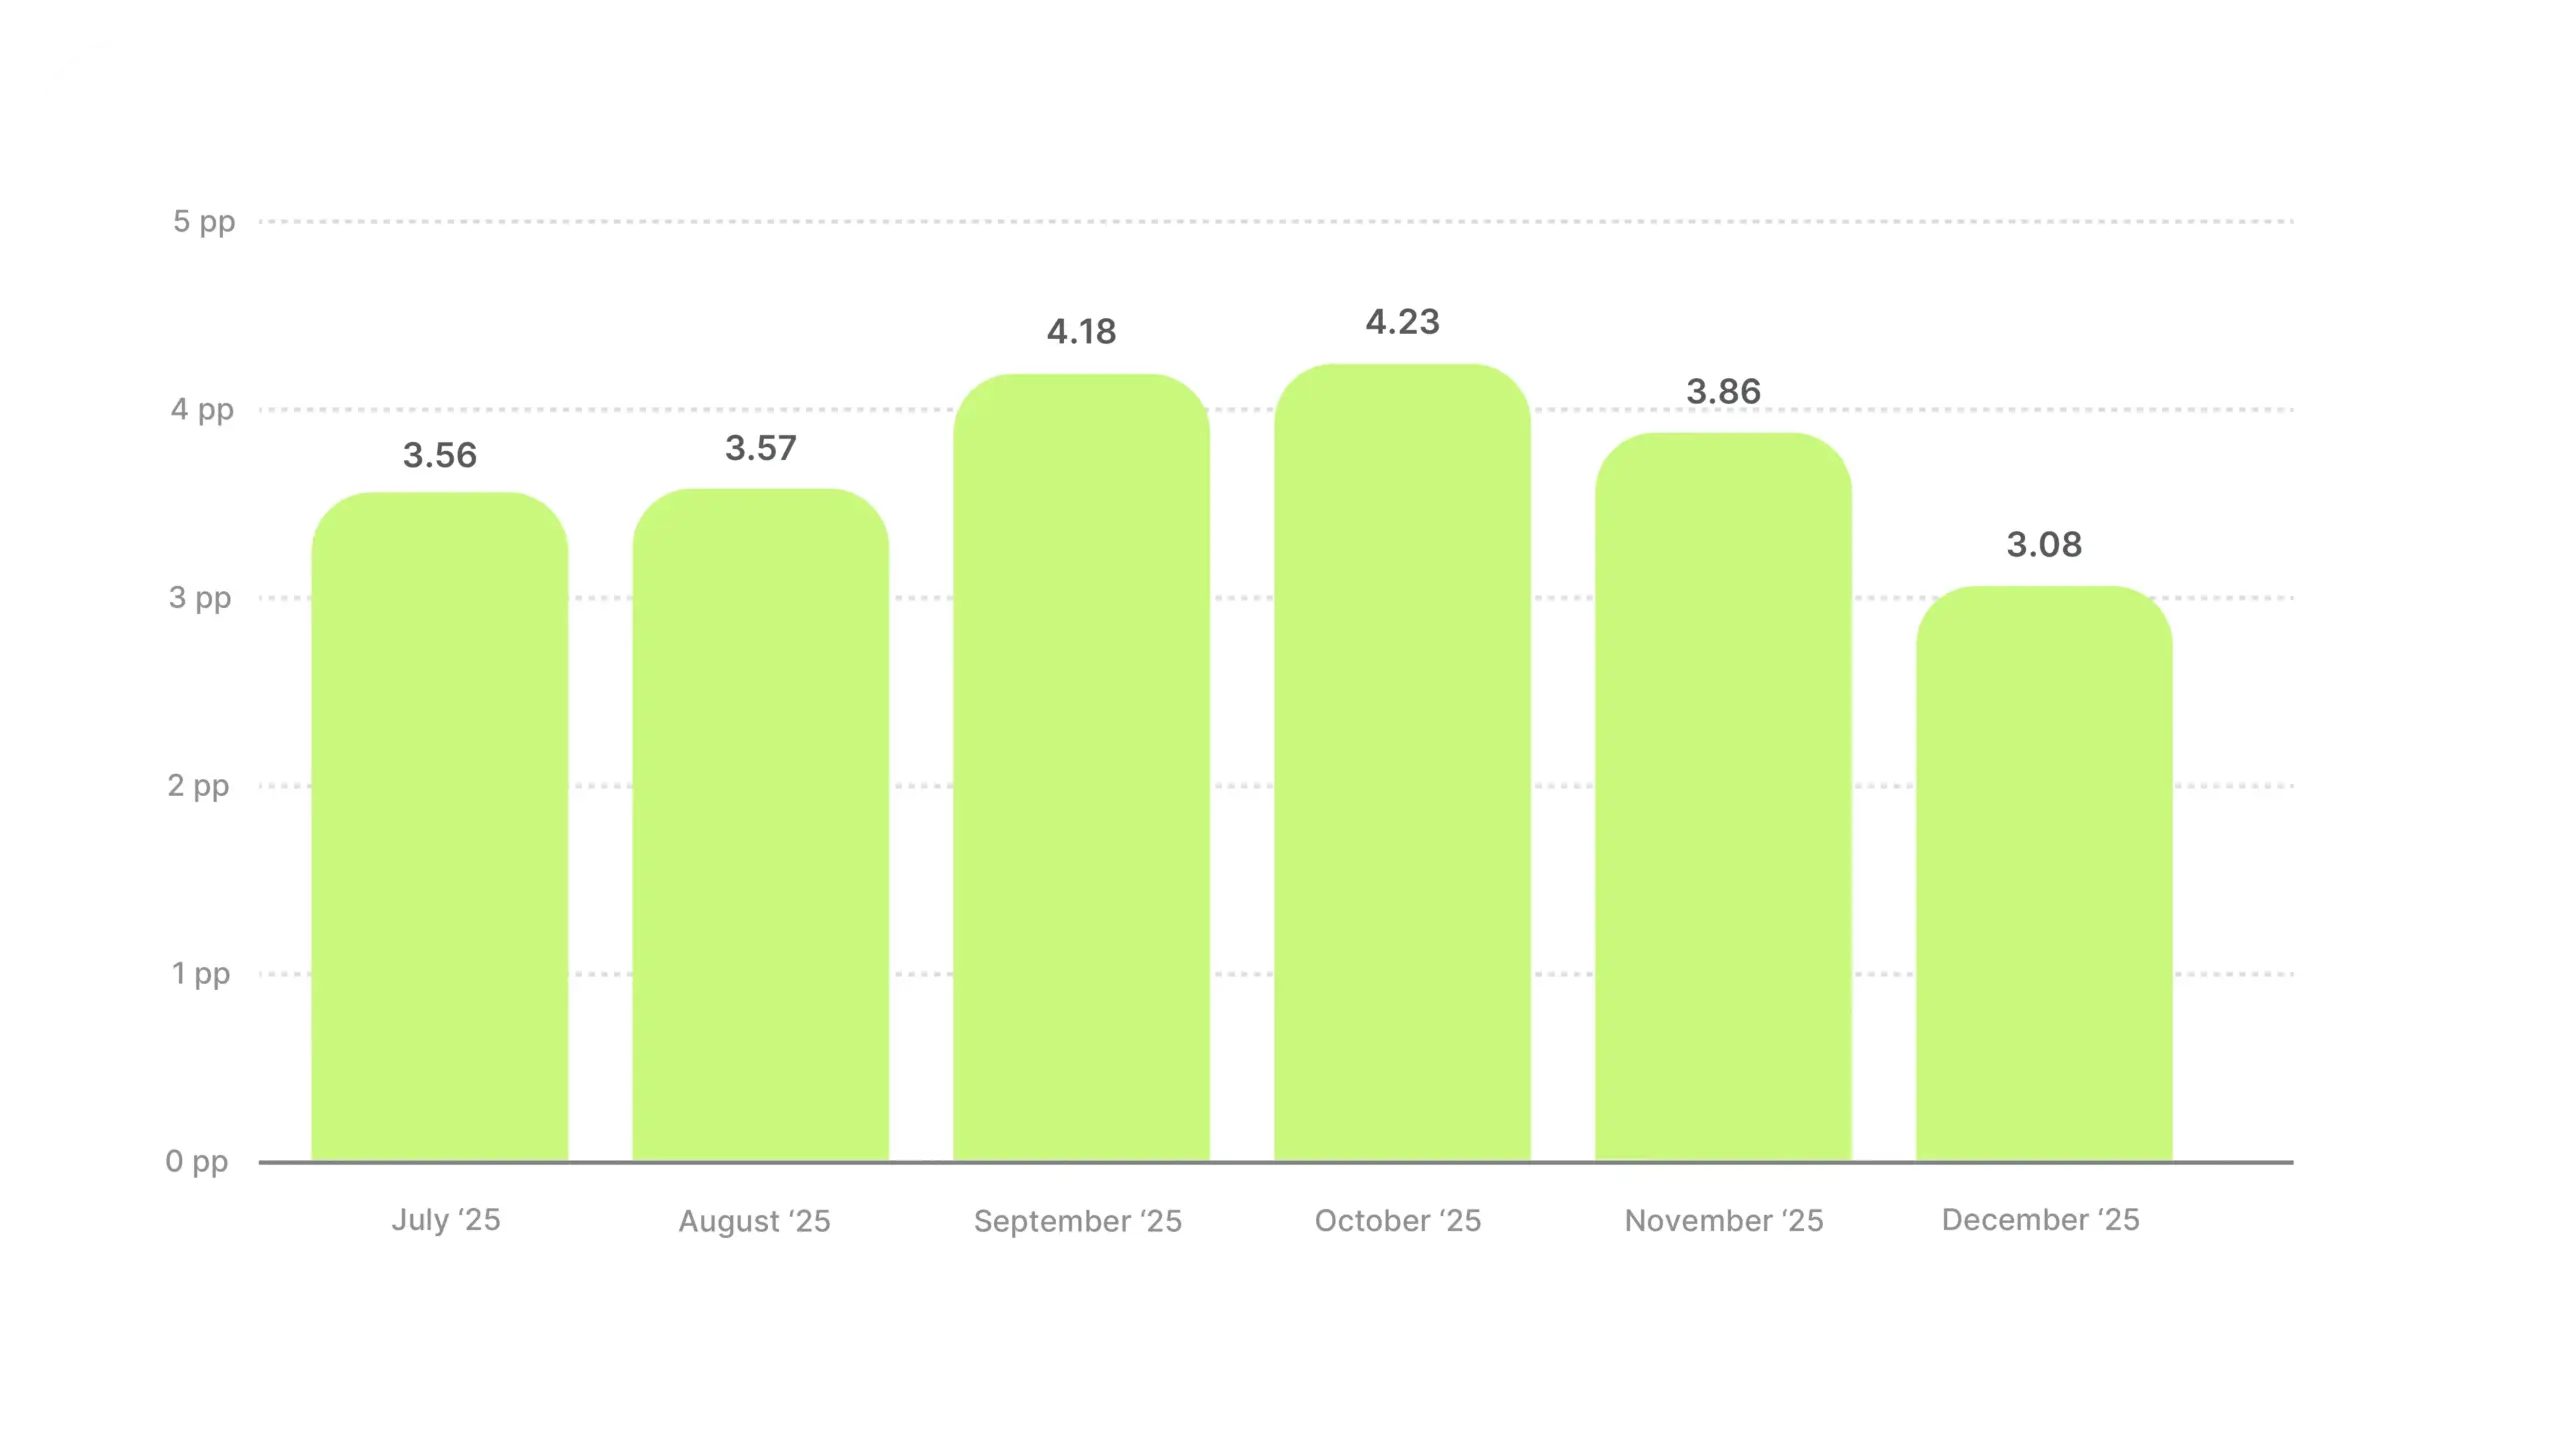
Toys & Games is the second-highest hooking category in the dataset, trailing Health & Beauty by just 0.11 pp. Nearly 4 pp above the cross-industry average and never below 27.6% in any month. But while Health & Beauty surged in December, Toys & Games softened. A mild Q4 dip that started in November and didn’t recover suggests something changed about how toy brands approached their most important selling season.
Industry hook rate average
Distance from all-industry average
From July through October, hooks stayed above 28% consistently. Then in November and December, ad volume dropped sharply while hook rates softened. The most likely explanation is that brands shifted to gift-positioning and promo-heavy formats, and that swap cost them 1+ pp of hook performance.
The category’s strength and Health & Beauty’s strength come from different sources but produce the same result. Health & Beauty hooks with aspiration (the transformation, the glow-up). Toys & Games hooks with pure engagement (the satisfying demo, the unexpected reveal, the “I need to see what happens next” moment). Both prove that when the opening seconds create either narrative tension or visual delight, hook rates reach a different tier.
For Q4 planning: consider running your regular product-in-action hooks alongside holiday formats, rather than replacing them entirely. A 27.6% December is still exceptional, better than every other category’s best month except Health & Beauty’s December. But the 1+ pp gap between October’s peak and December’s trough represents a meaningful number of lost viewers during the highest-intent shopping window of the year.
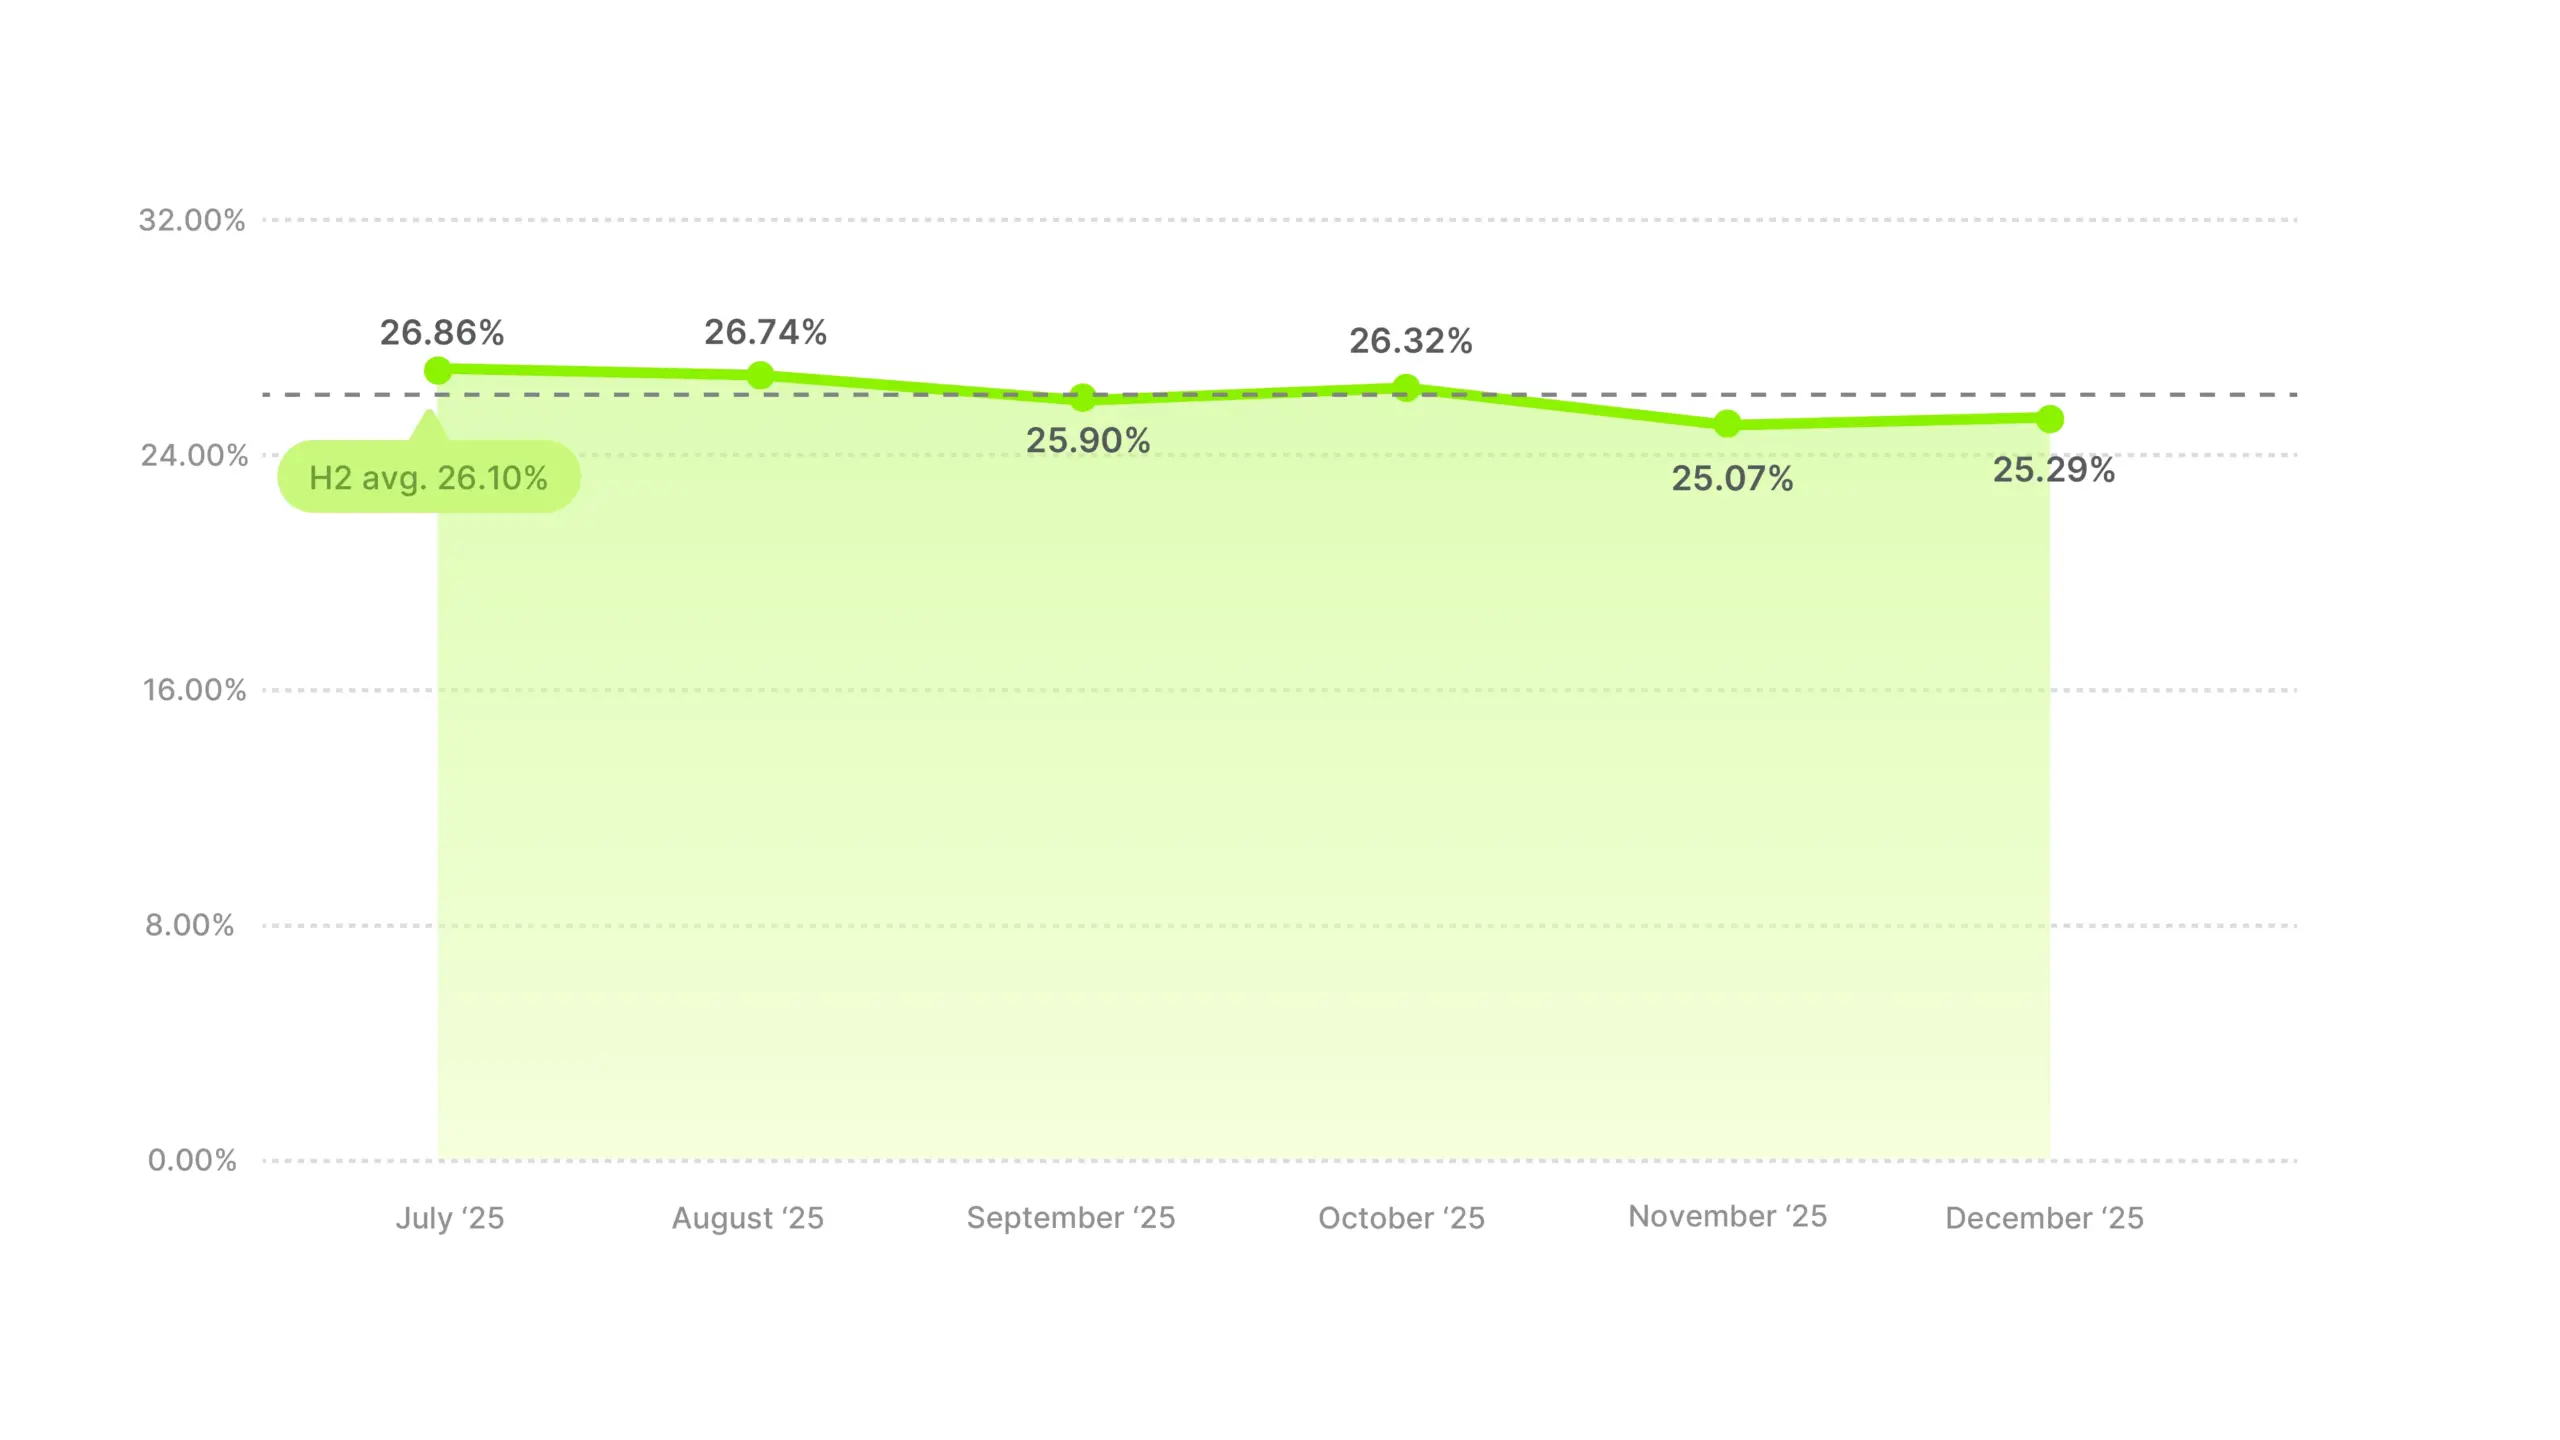
The “Other” category aggregates industries that don’t fit neatly into the named verticals. At 26.10%, it sits above the cross-industry average, but as a blend of unrelated industries, the number works as a reference point rather than a competitive benchmark. If your industry falls into this bucket, your real benchmark is your own historical performance or the closest named category in this report.
Industry hook rate average
Distance from all-industry average
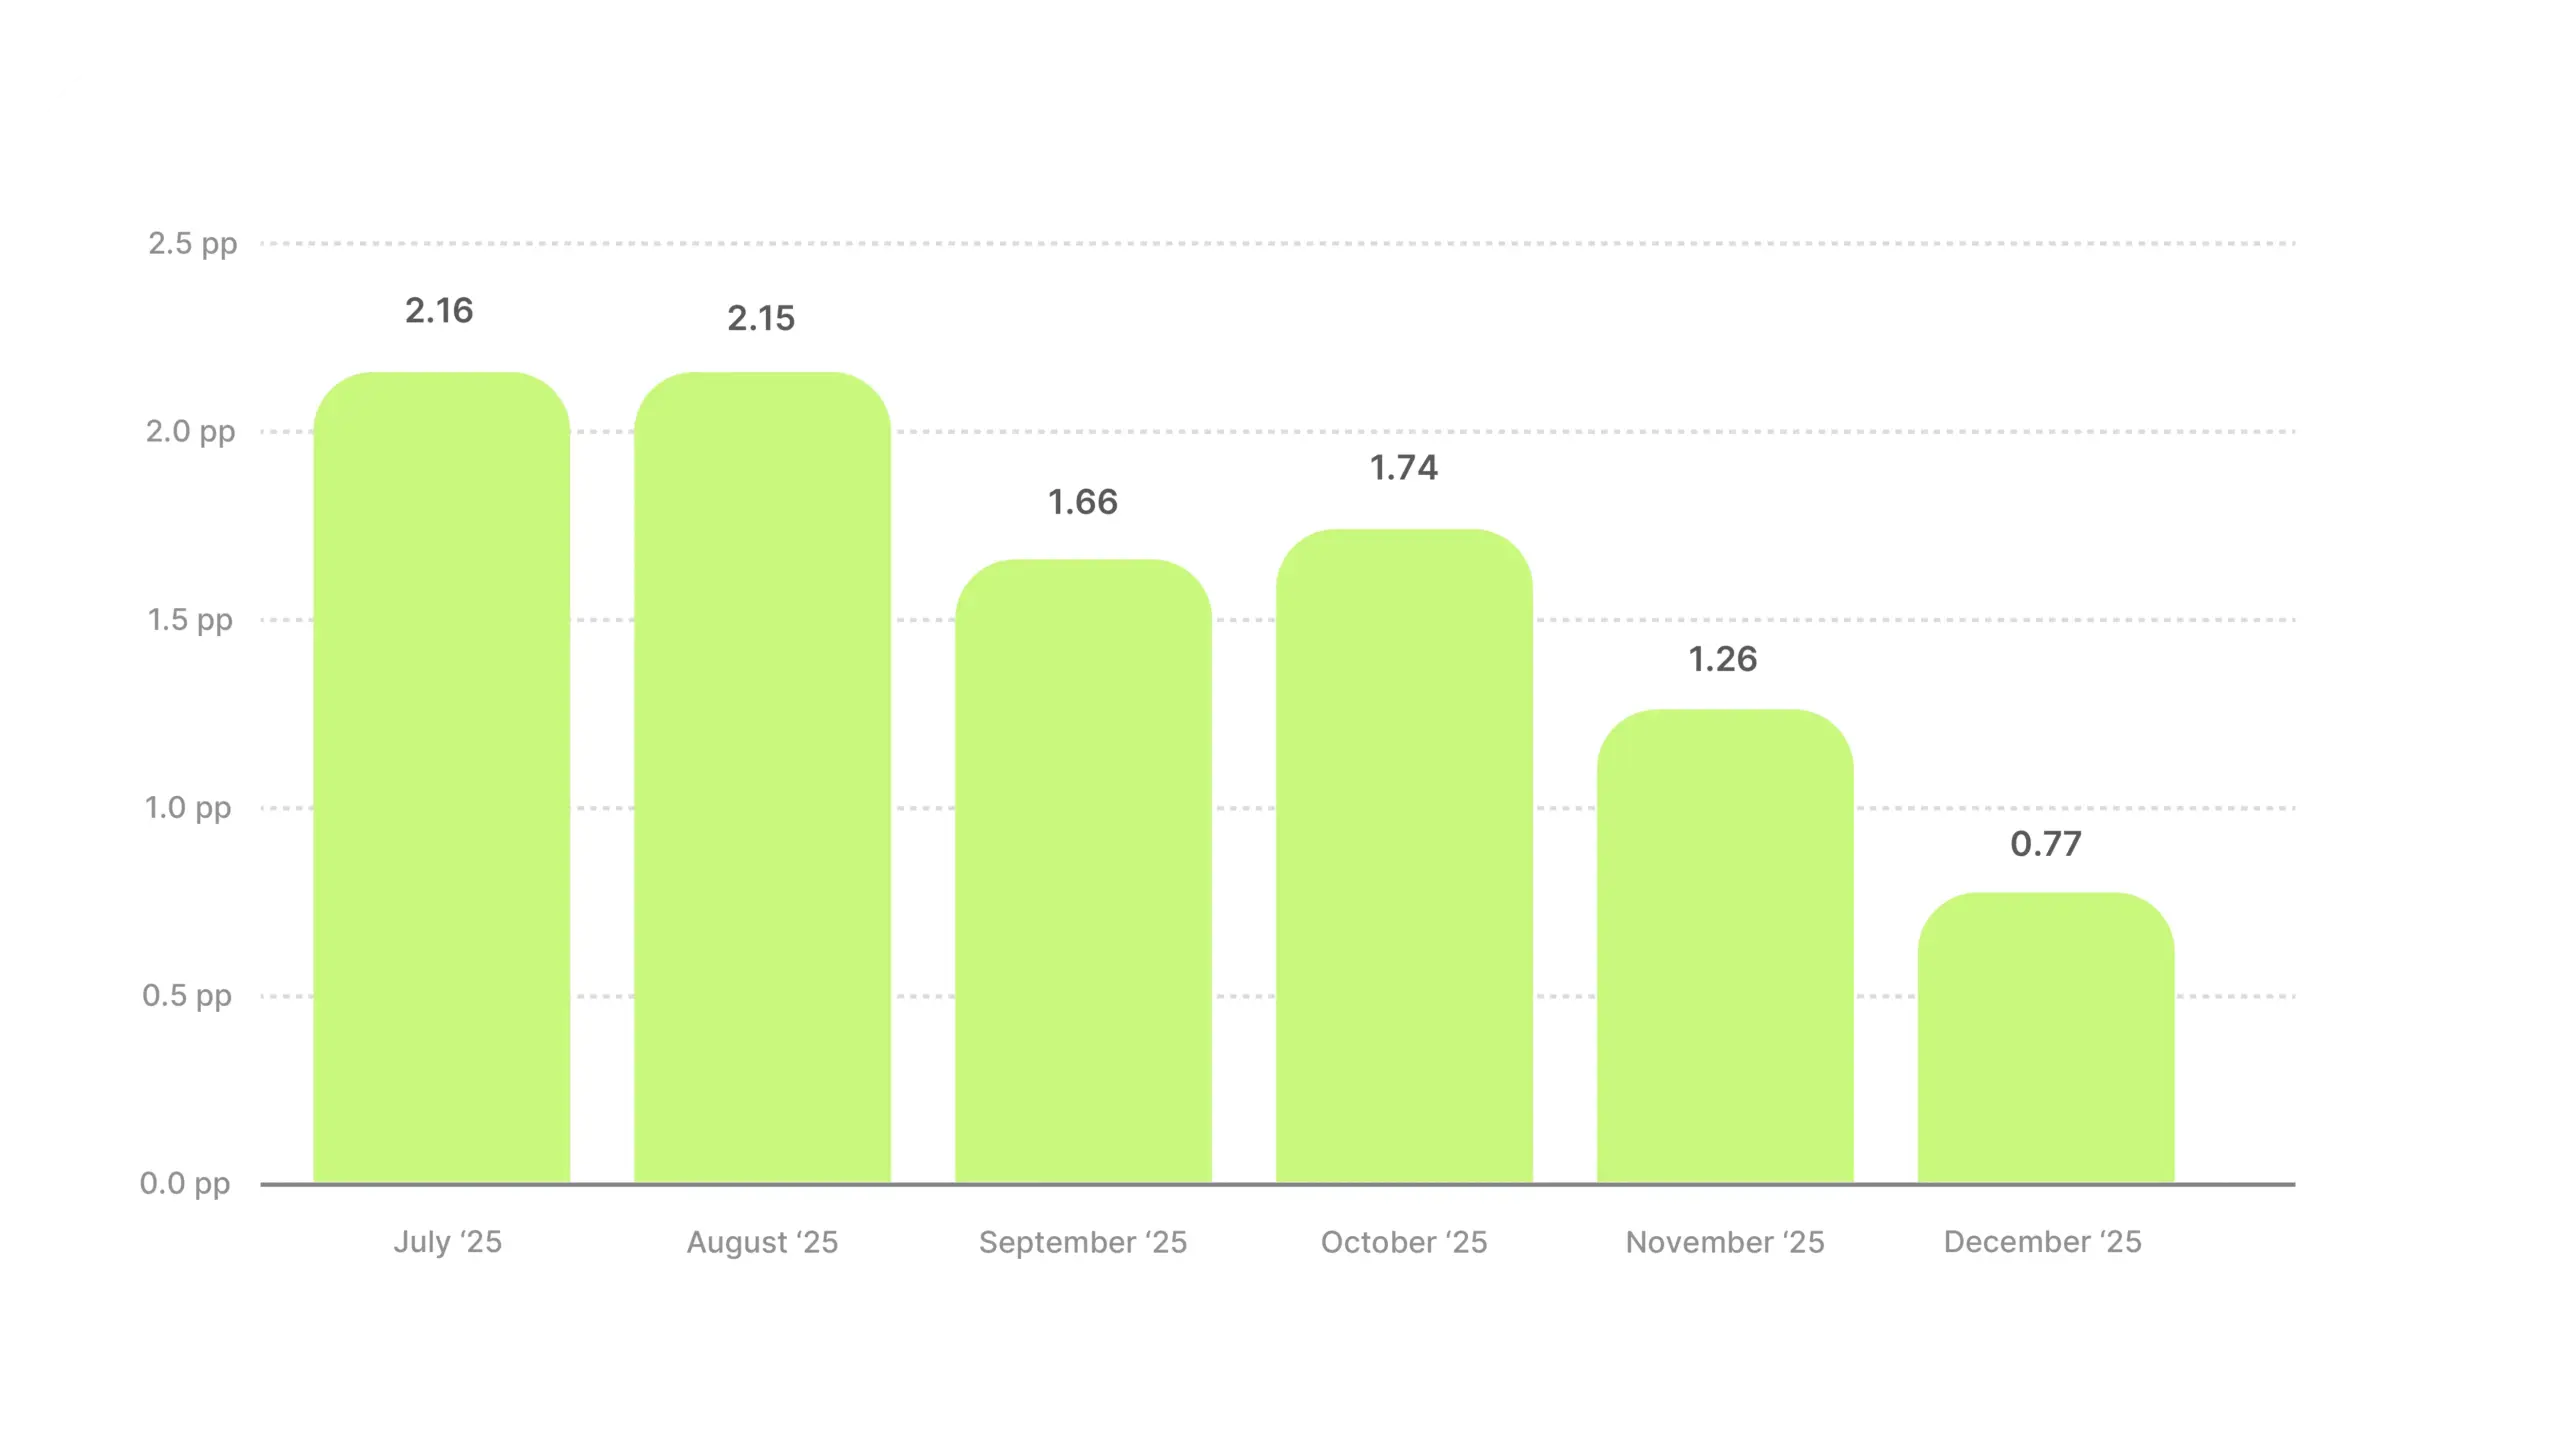
The trend mirrors the overall market: a gentle downward drift from July to November, a small December recovery. When you blend enough different industries together, individual category effects cancel out and you get something that looks like the market itself.
Methodology
Data source: This analysis covers 80,069+ Meta video ads that ran between July 1 and December 31, 2025.
Inclusion criteria: Video ads with a sales objective, reliable metrics, and more than 1,000 impressions.
Hook rate definition: 3-second video plays divided by impressions. It tells you what percentage of people who saw your ad actually stuck around past the first few seconds. It’s widely used by performance marketers as the clearest measure of whether your opening is working.
Industry classification: Ads were categorized into 14 industry verticals based on advertiser product category. “Other” aggregates industries with insufficient volume for standalone analysis.
A note on interpretation: The performance metrics in this report reflect historical advertising data and are provided for benchmarking purposes. They should not be interpreted as a guarantee or prediction of future ad performance. Categories with smaller sample sizes (Baby & Toddler, Software, Services) are more susceptible to individual-advertiser effects on the average.