
What the data told us
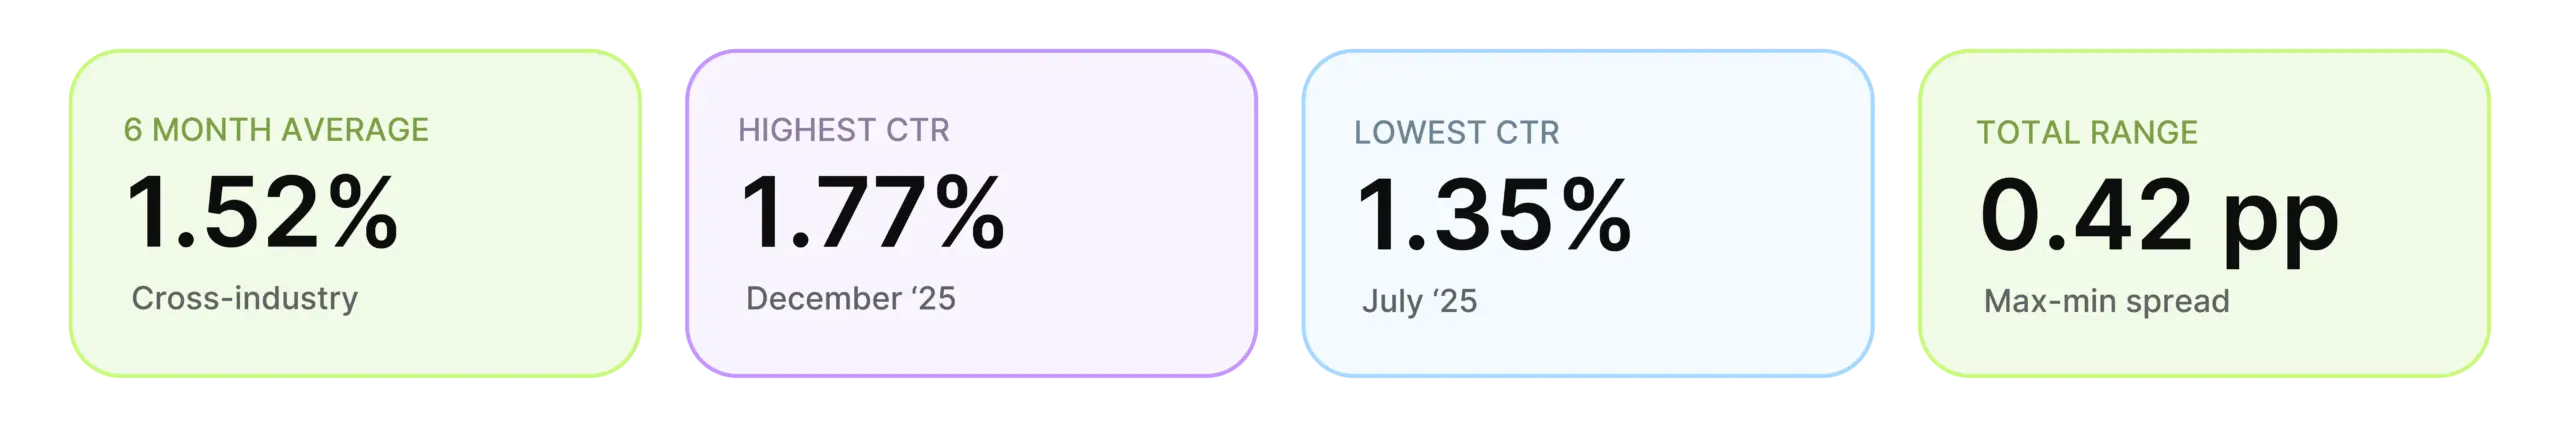
1. CTR climbed all half. From 1.35% in July to 1.77% in December, a steady upward trend with no dips or reversals. Every single month was higher than the last.
2. The Q4 lift is real, but it peaks at different times for different categories. October for Home & Garden and Arts & Entertainment. November for Apparel and Services. December for Electronics and Software. Knowing when your category peaks matters more than knowing that Q4 is generally strong.
3. The leaders in CTR aren’t always the leaders in hook rate. Home & Garden ties for the top CTR spot but was dead average on hooks. Toys & Games led hook rates but sits near the bottom on CTR. Stopping the scroll and earning the click are different problems.
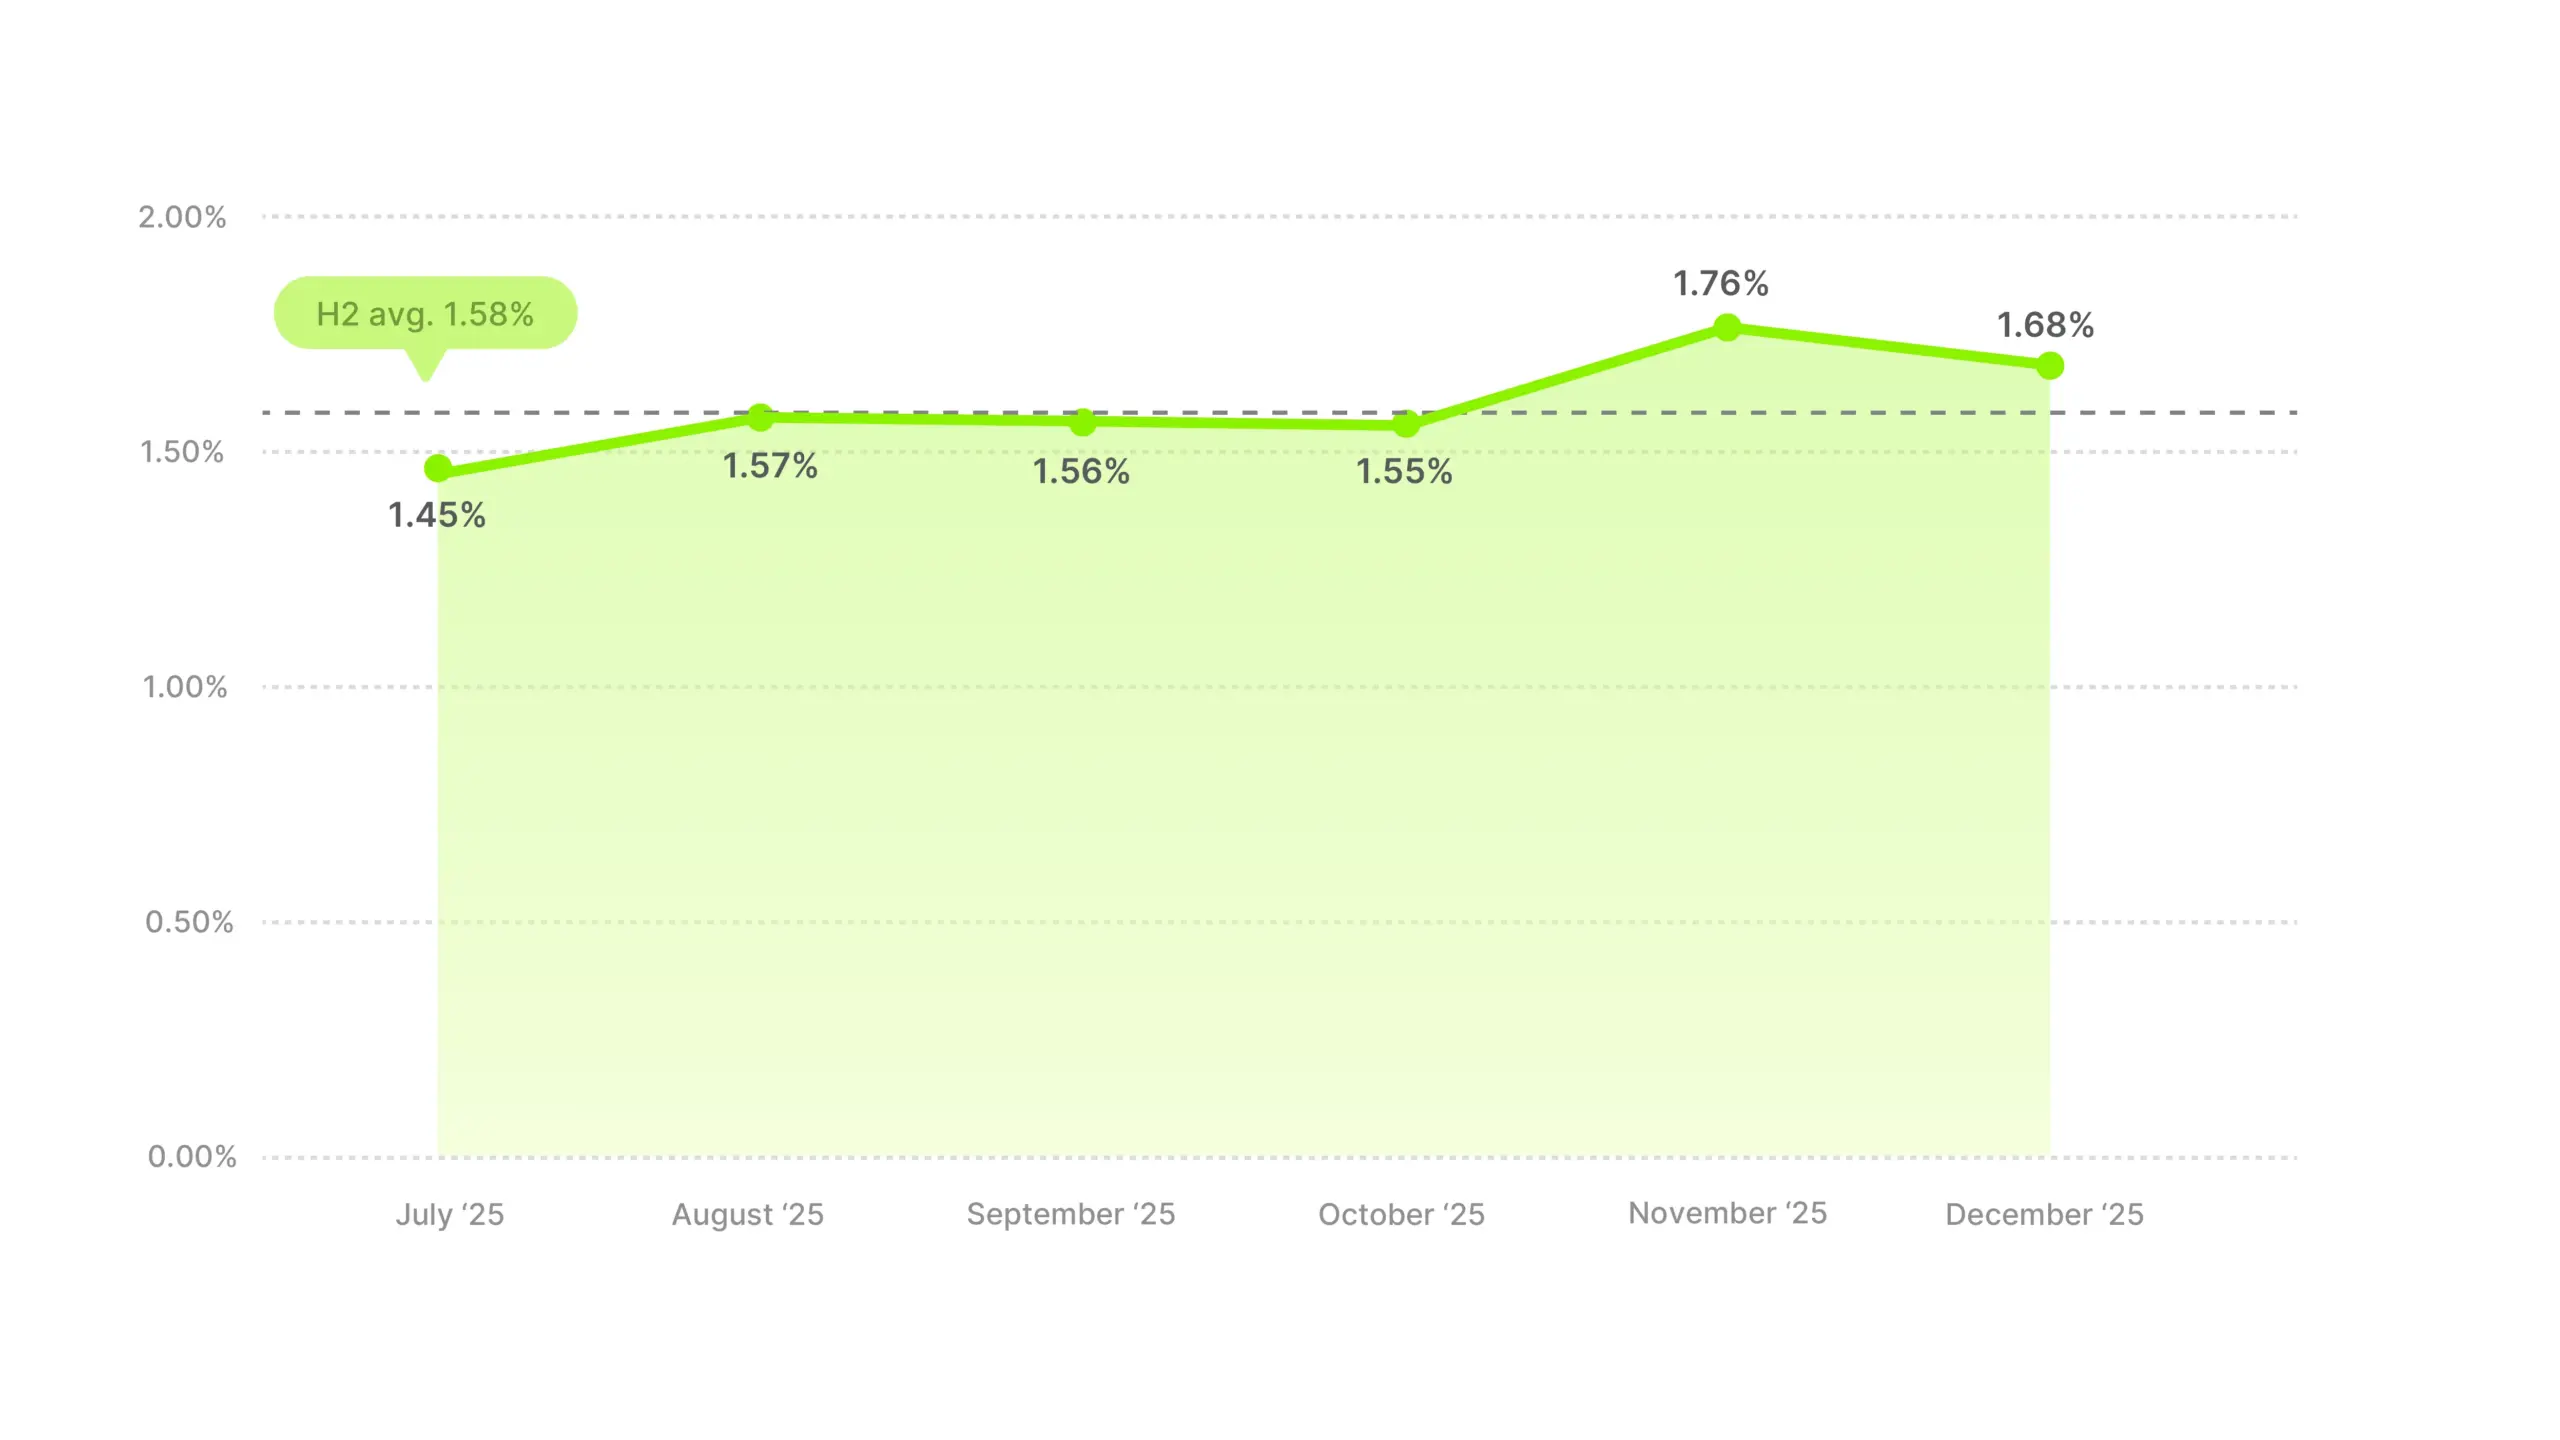
Overall CTR trend, H2 2025
Unlike hook rate, which held flat across H2, CTR tells a directional story. It climbed every single month from July through December, with no dips, no reversals, and no plateaus. That’s a clean upward trend driven by something beyond creative quality alone.
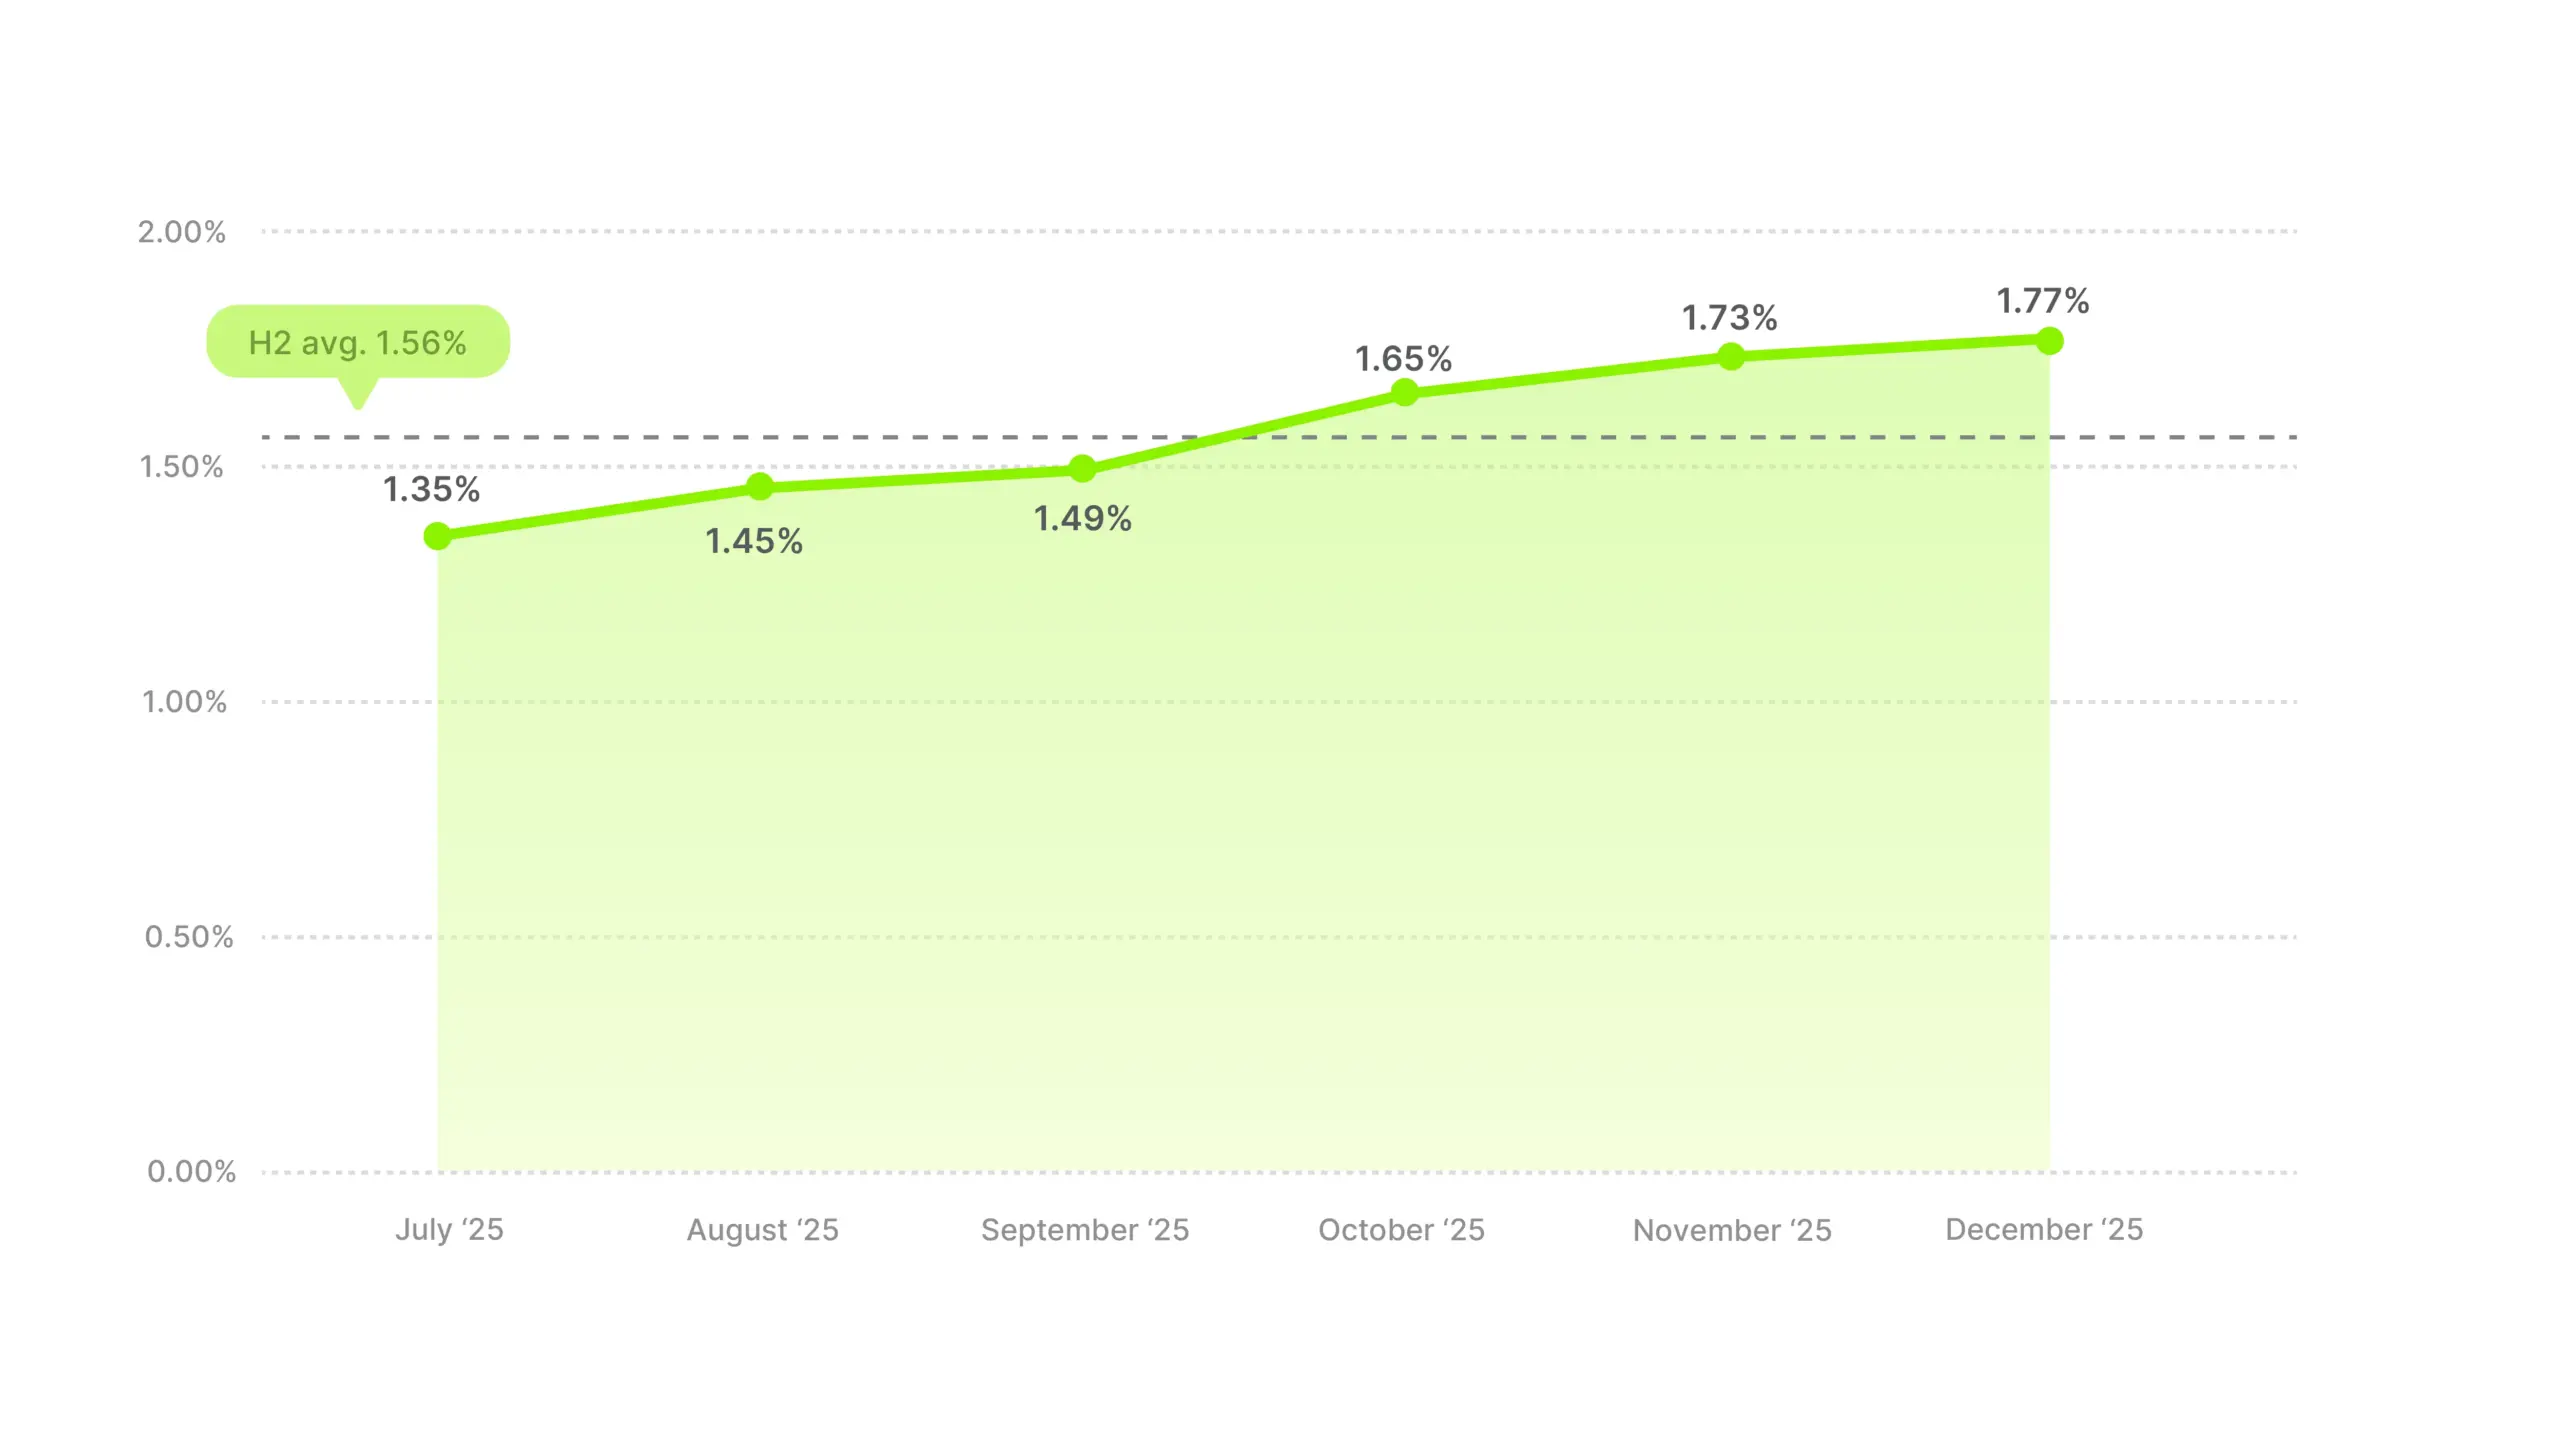
The steepest climb happened between July and October (+0.30 pp in three months), then the curve flattened from October through December (+0.12 pp). The biggest single-month jump was September to October (+0.16 pp), right when Q4 buyer intent kicks in.
Meanwhile, the number of active ads dropped 28% over the same period. Fewer ads running, higher CTR. Brands consolidated around fewer creatives as the half progressed, and the survivors clicked better.
That distinction matters for how you read these benchmarks. A flat hook rate with a rising CTR across H2 means people weren’t watching more ads, but the ones who did watch were clicking more as buyer intent built through the back half of the year.
Use 1.56% as your H2 2025 baseline, but adjust for timing. Hitting 1.56% in July would have been strong. Hitting 1.56% in December would have been below average, since the monthly benchmark there is 1.77%. The upward trend means your CTR target should rise as the year progresses.
CTR benchmarks by industry
The cross-industry average of 1.56% masks a 0.64 pp spread between the highest and lowest performing categories. That’s a narrower gap than hook rates (which had an 8.5 pp spread), and the middle is packed tight, with six categories sitting within 0.07 pp of each other, essentially tied.
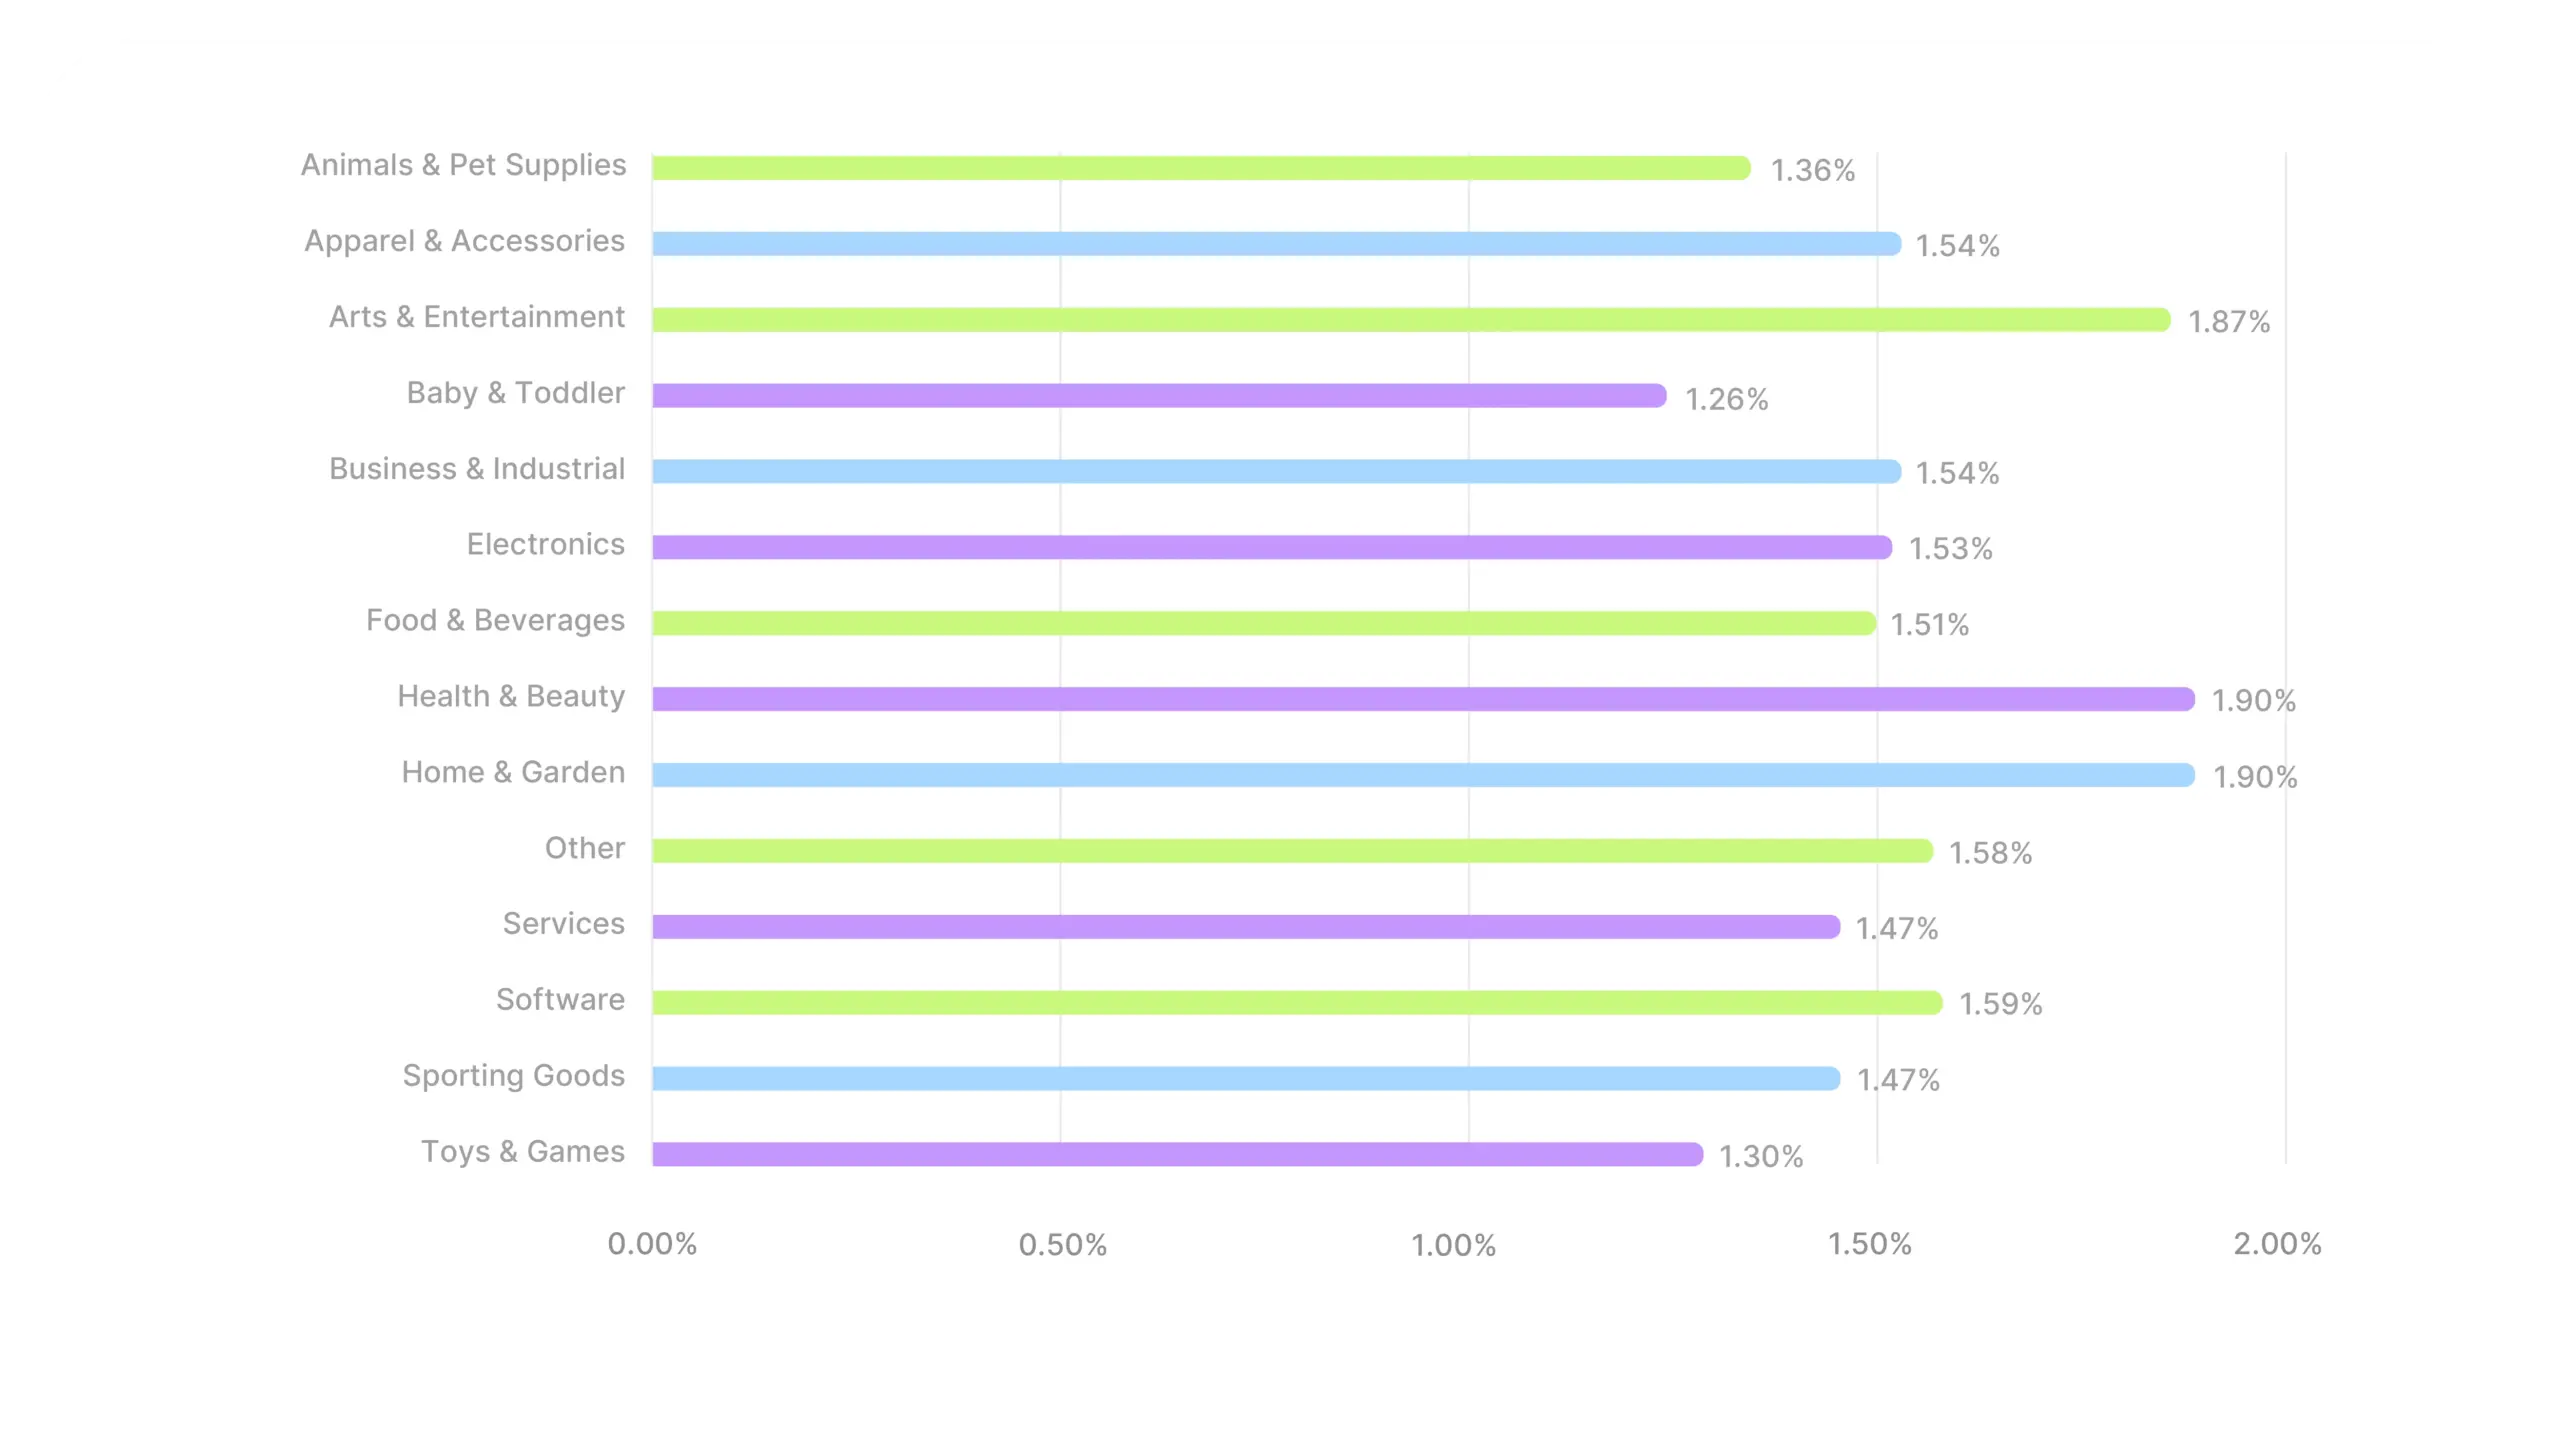
Health & Beauty leads again, just as it did in hook rates. But the co-leader is a surprise. Home & Garden was dead average on hook rates but ties for the top CTR spot. Strong hooks don’t always translate to strong clicks, and the reverse is true too. Home & Garden’s content may not grab attention as aggressively in the opening seconds, but when people do engage, they click.
Software at 1.59% is worth noting. It’s above the overall average, which may surprise software brands who assume video ads aren’t really their channel. The data says otherwise.
The most interesting reversal is Toys & Games. Second-highest hook rate in the dataset (28.23%), but second-lowest CTR (1.30%). Toy ads are great at capturing attention in the opening seconds but struggle to convert that attention into a click. The hook is working, but something between the hook and the CTA isn’t.
Industry deep dives
Animals & Pet Supplies posted a 1.36% CTR across H2, below the 1.56% overall average. But the monthly shape is completely different from the overall market. Where the market climbed steadily all half, this category rose sharply through mid-H2 and then fell back.
Industry CTR average
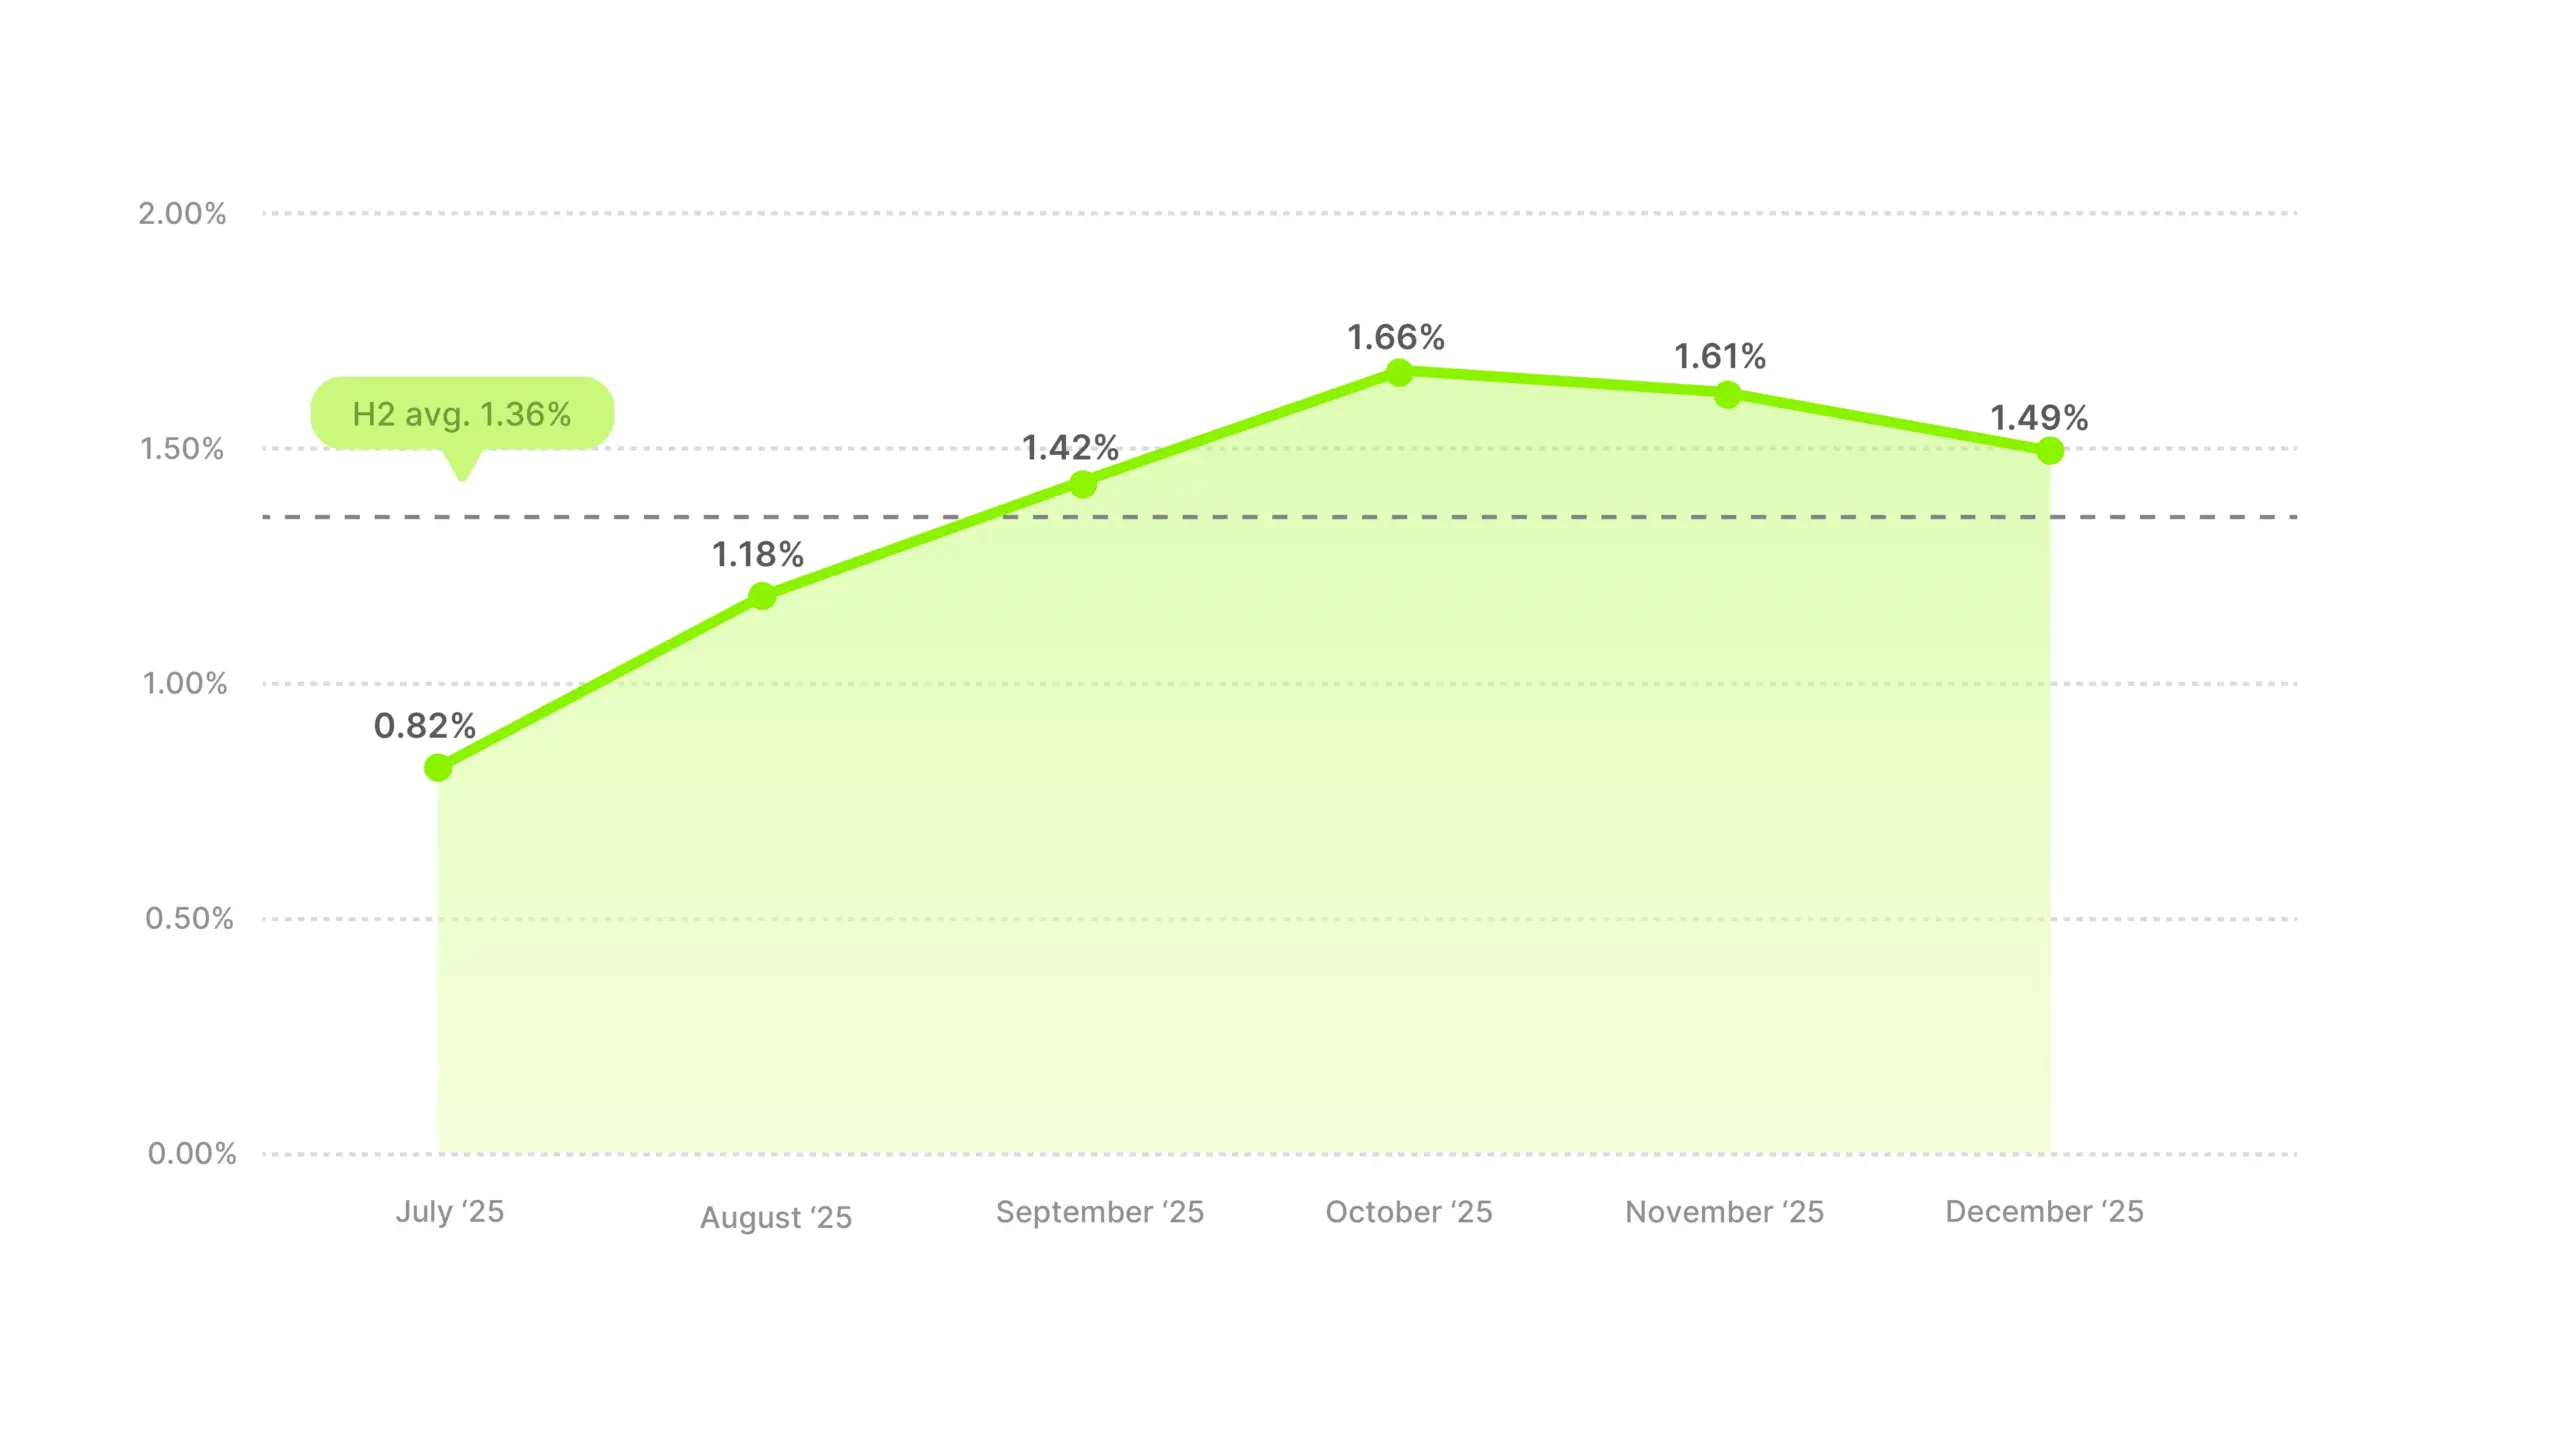
July at 0.82% is the lowest single month of any category in the dataset. But the climb from there to October’s 1.66% nearly doubled the CTR in four months, briefly pushing above the overall average. October marks the peak, and the months after ease slightly, but Q4 still outperforms everything before August.
Pet supplies doesn’t get the same Q4 peak as other categories, but the dip after October is slight, not a reversal. One reason for the slight drop might be that November and December are gifting season, and pet supplies aren’t a typical gift. People buy them out of ongoing need, not because they saw a deal that sparked an impulse purchase.
So this category misses the Q4 intent boost that lifts most other verticals. The October peak could simply be restocking or seasonal product switches before attention shifts to holiday shopping elsewhere.
If you’re in this category, 1.36% is your benchmark. Q4 is your strongest quarter, same as the broader market. But while other verticals spike in November and December, pet supplies category peaks in October, then holds steady rather than climbing further. The gap between this category and the overall market widens in December, not as much because pet supplies drop off, but because everything else surges.
Apparel’s H2 average of 1.54% lands right at the overall market average, nothing unusual on the surface. But the monthly pattern is worth paying attention to, because November is when this category really comes alive.
Industry CTR average
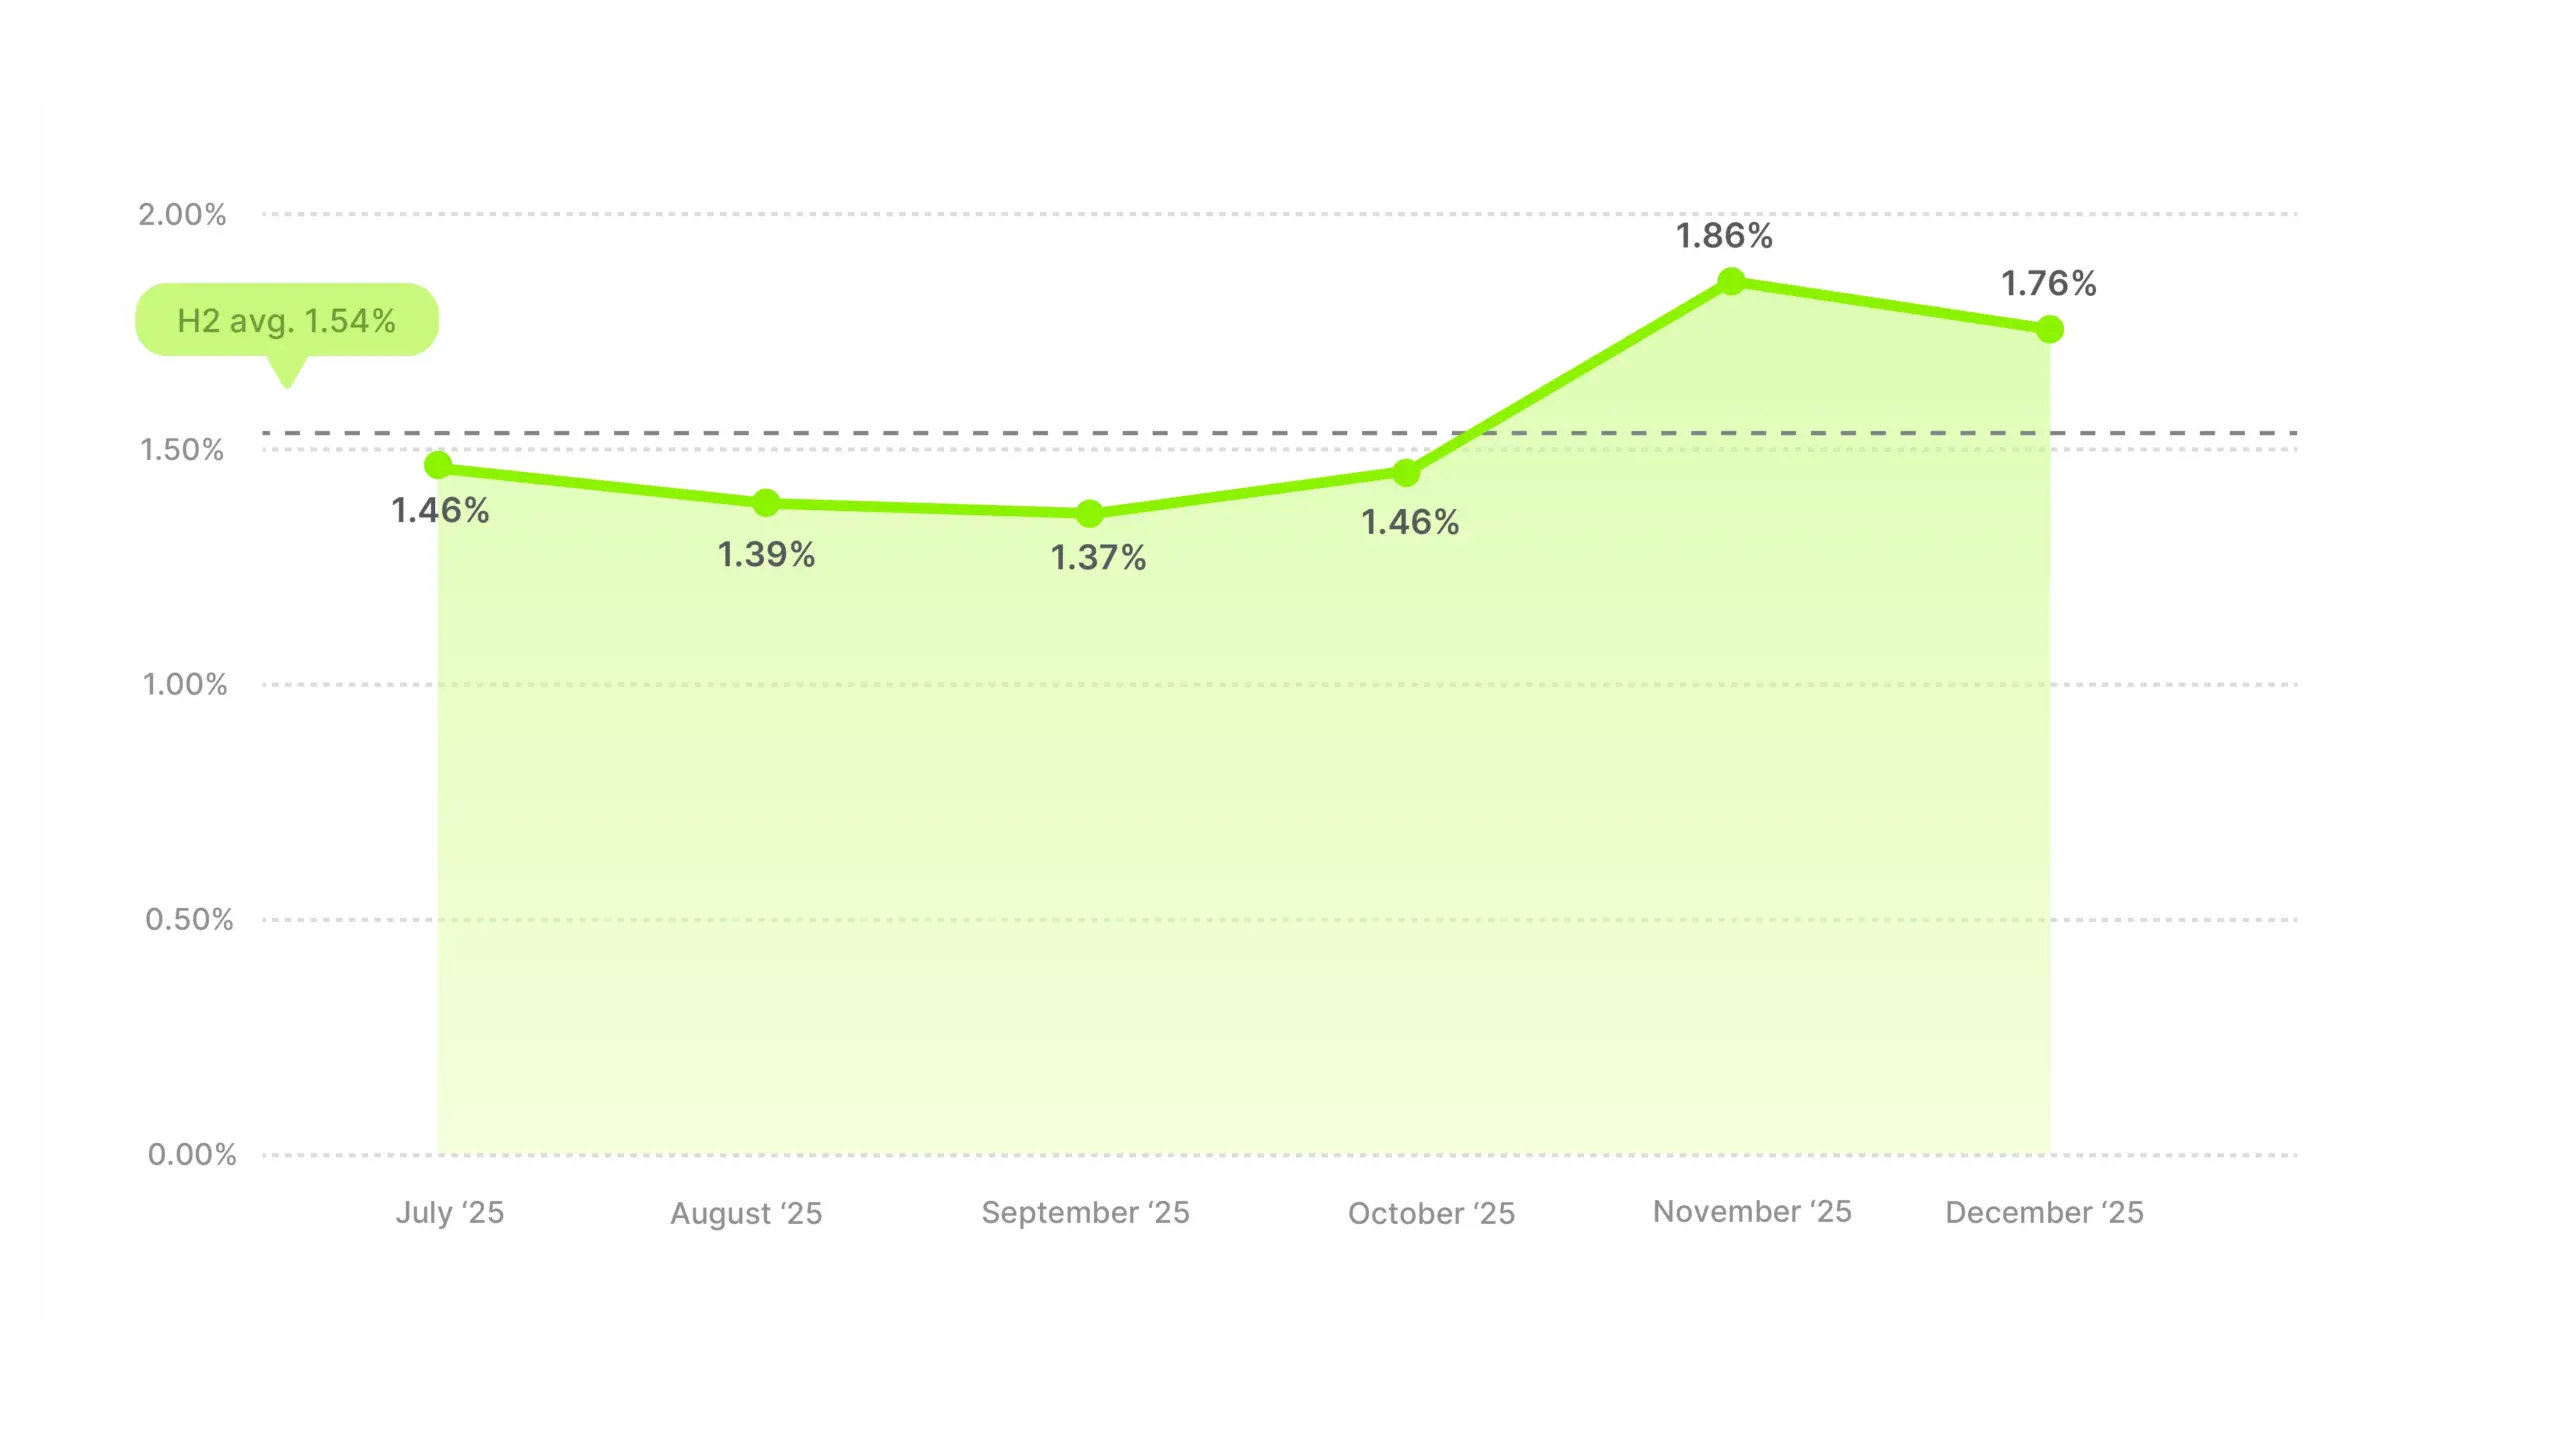
November’s 1.86% is the clear peak, with December pulling back slightly to 1.76%. The lift likely reflects holiday self-shopping, people updating their wardrobes for the season, holiday events, winter weather. The intent shift here isn’t about buying apparel as gifts, it’s about buying for yourself when there’s a reason to.
Apparel also peaked in November on hook rate while the broader market dipped, so both metrics point to the same thing.
July through October running below the category’s own average for four straight months is an open question for apparel brands. It could be a seasonal gap where summer is winding down but it’s not yet cold enough to trigger fall and winter wardrobe purchases. If that pattern holds year over year, it’s worth planning creative that bridges the seasonal gap rather than accepting four months of below-average performance.
Arts & Entertainment posted the third highest CTR at 1.87%, well above the 1.56% overall average. The monthly pattern breaks into two clear phases: flat through September, then a sharp jump that held through the rest of H2.
Industry CTR average
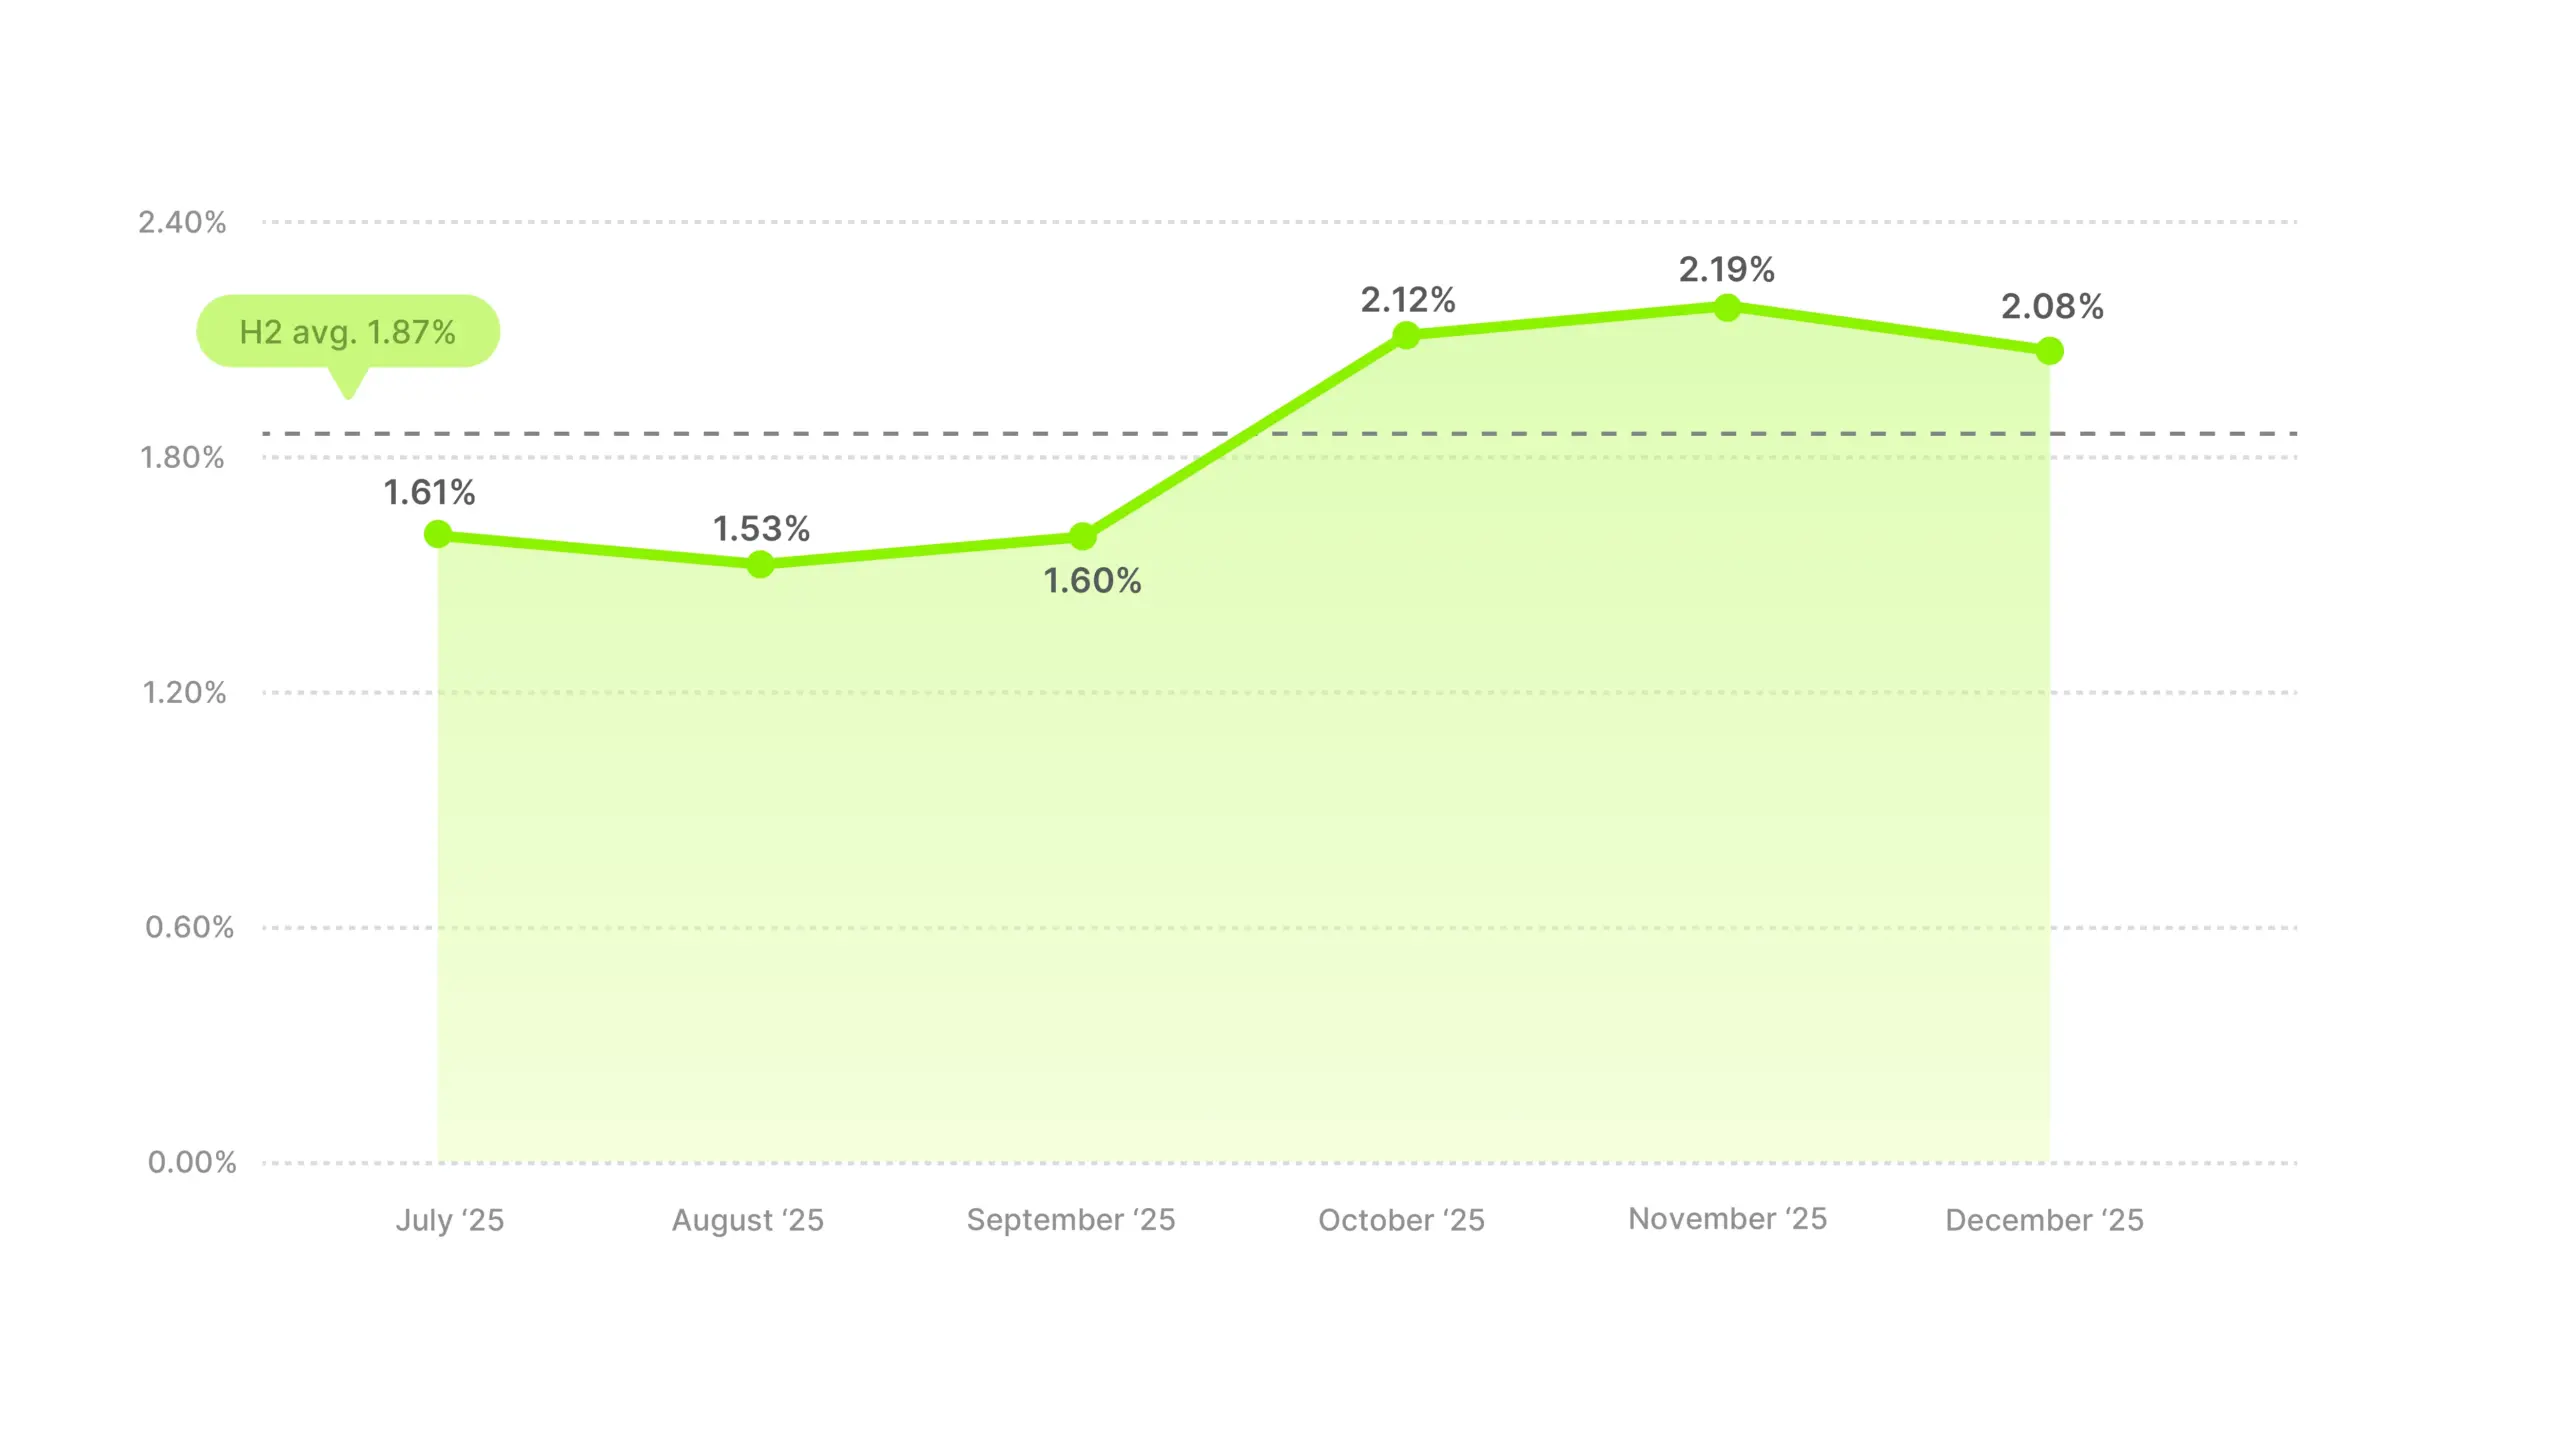
The October jump from 1.60% to 2.12% is one of the sharpest single-month CTR gains in the dataset. November pushed even higher to 2.19% before settling slightly in December.
The category is broad, covering everything from craft supplies to music instruments to hobby kits, which makes it hard to isolate a single driver. But the Q4 lift likely reflects gifting. Arts and hobby products are popular gifts, which would explain why the lift starts in October as early holiday shopping ramps up and holds through December.
For planning purposes, 1.87% is your benchmark. But the two-phase pattern means your Q4 creative should be doing meaningfully more work than your summer creative, because the audience is in a fundamentally different buying mindset.
Baby & Toddler has the lowest CTR of any category at 1.26%. There’s a slight upward trend from July through November, but it’s modest compared to other categories, and December gives some of it back.
Industry CTR average
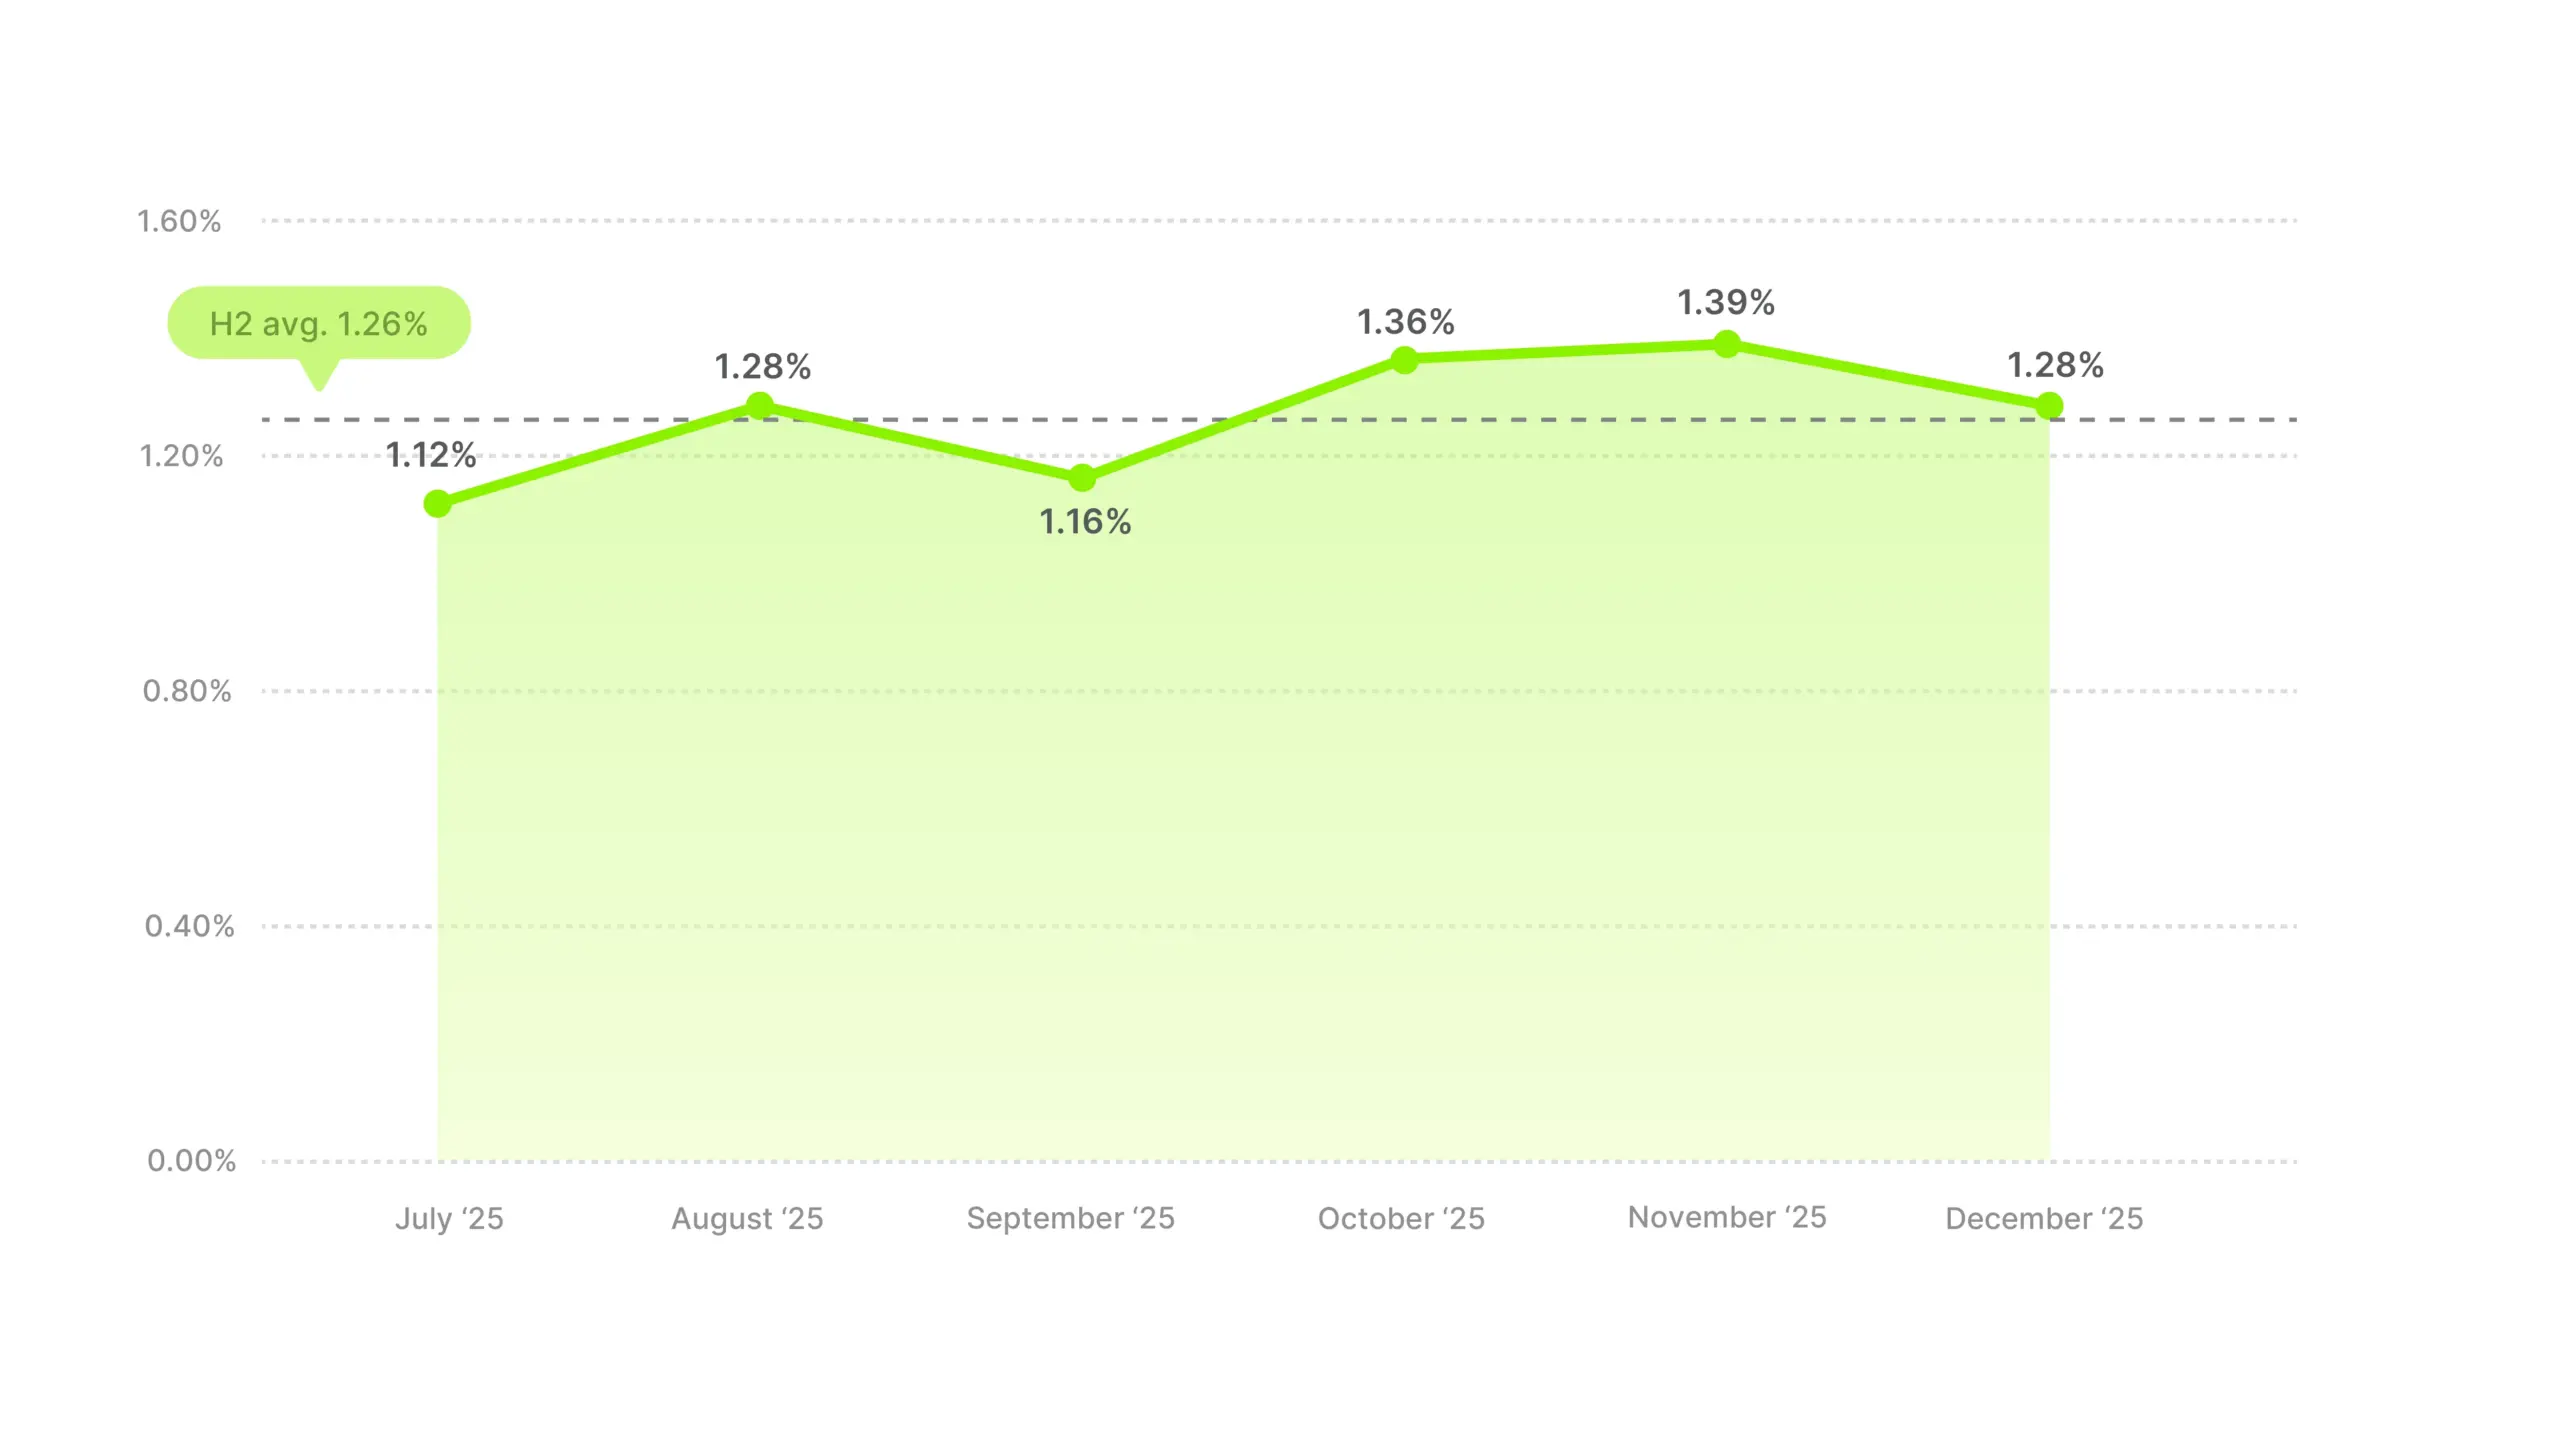
A low CTR doesn’t necessarily mean the ads aren’t working. Parents buying for babies and toddlers tend to be cautious, prioritizing safety, reviews, ingredient lists, and peer recommendations. That makes someone less likely to click straight through from a video ad and more likely to go research on their own terms. The decision path is longer here than in most categories, and CTR captures only one step of it.
The modest Q4 lift makes sense for the baby and toddler category. Its products are bought out of necessity, parents aren’t waiting for Black Friday to buy diapers or car seats. There’s probably some gift-driven lift in subcategories like cute holiday-themed clothes and outfits or toddler toys, but it’s a smaller slice than in other verticals.
If you’re in this category, 1.26% is your benchmark. Focus less on chasing the overall average and more on whether your CTR is improving relative to your own baseline.
Business & Industrial sits right at the overall average with a 1.54% H2 CTR. The monthly pattern is less predictable than most categories, with a zigzag that’s harder to read but still has a clear Q4 story.
Industry CTR average
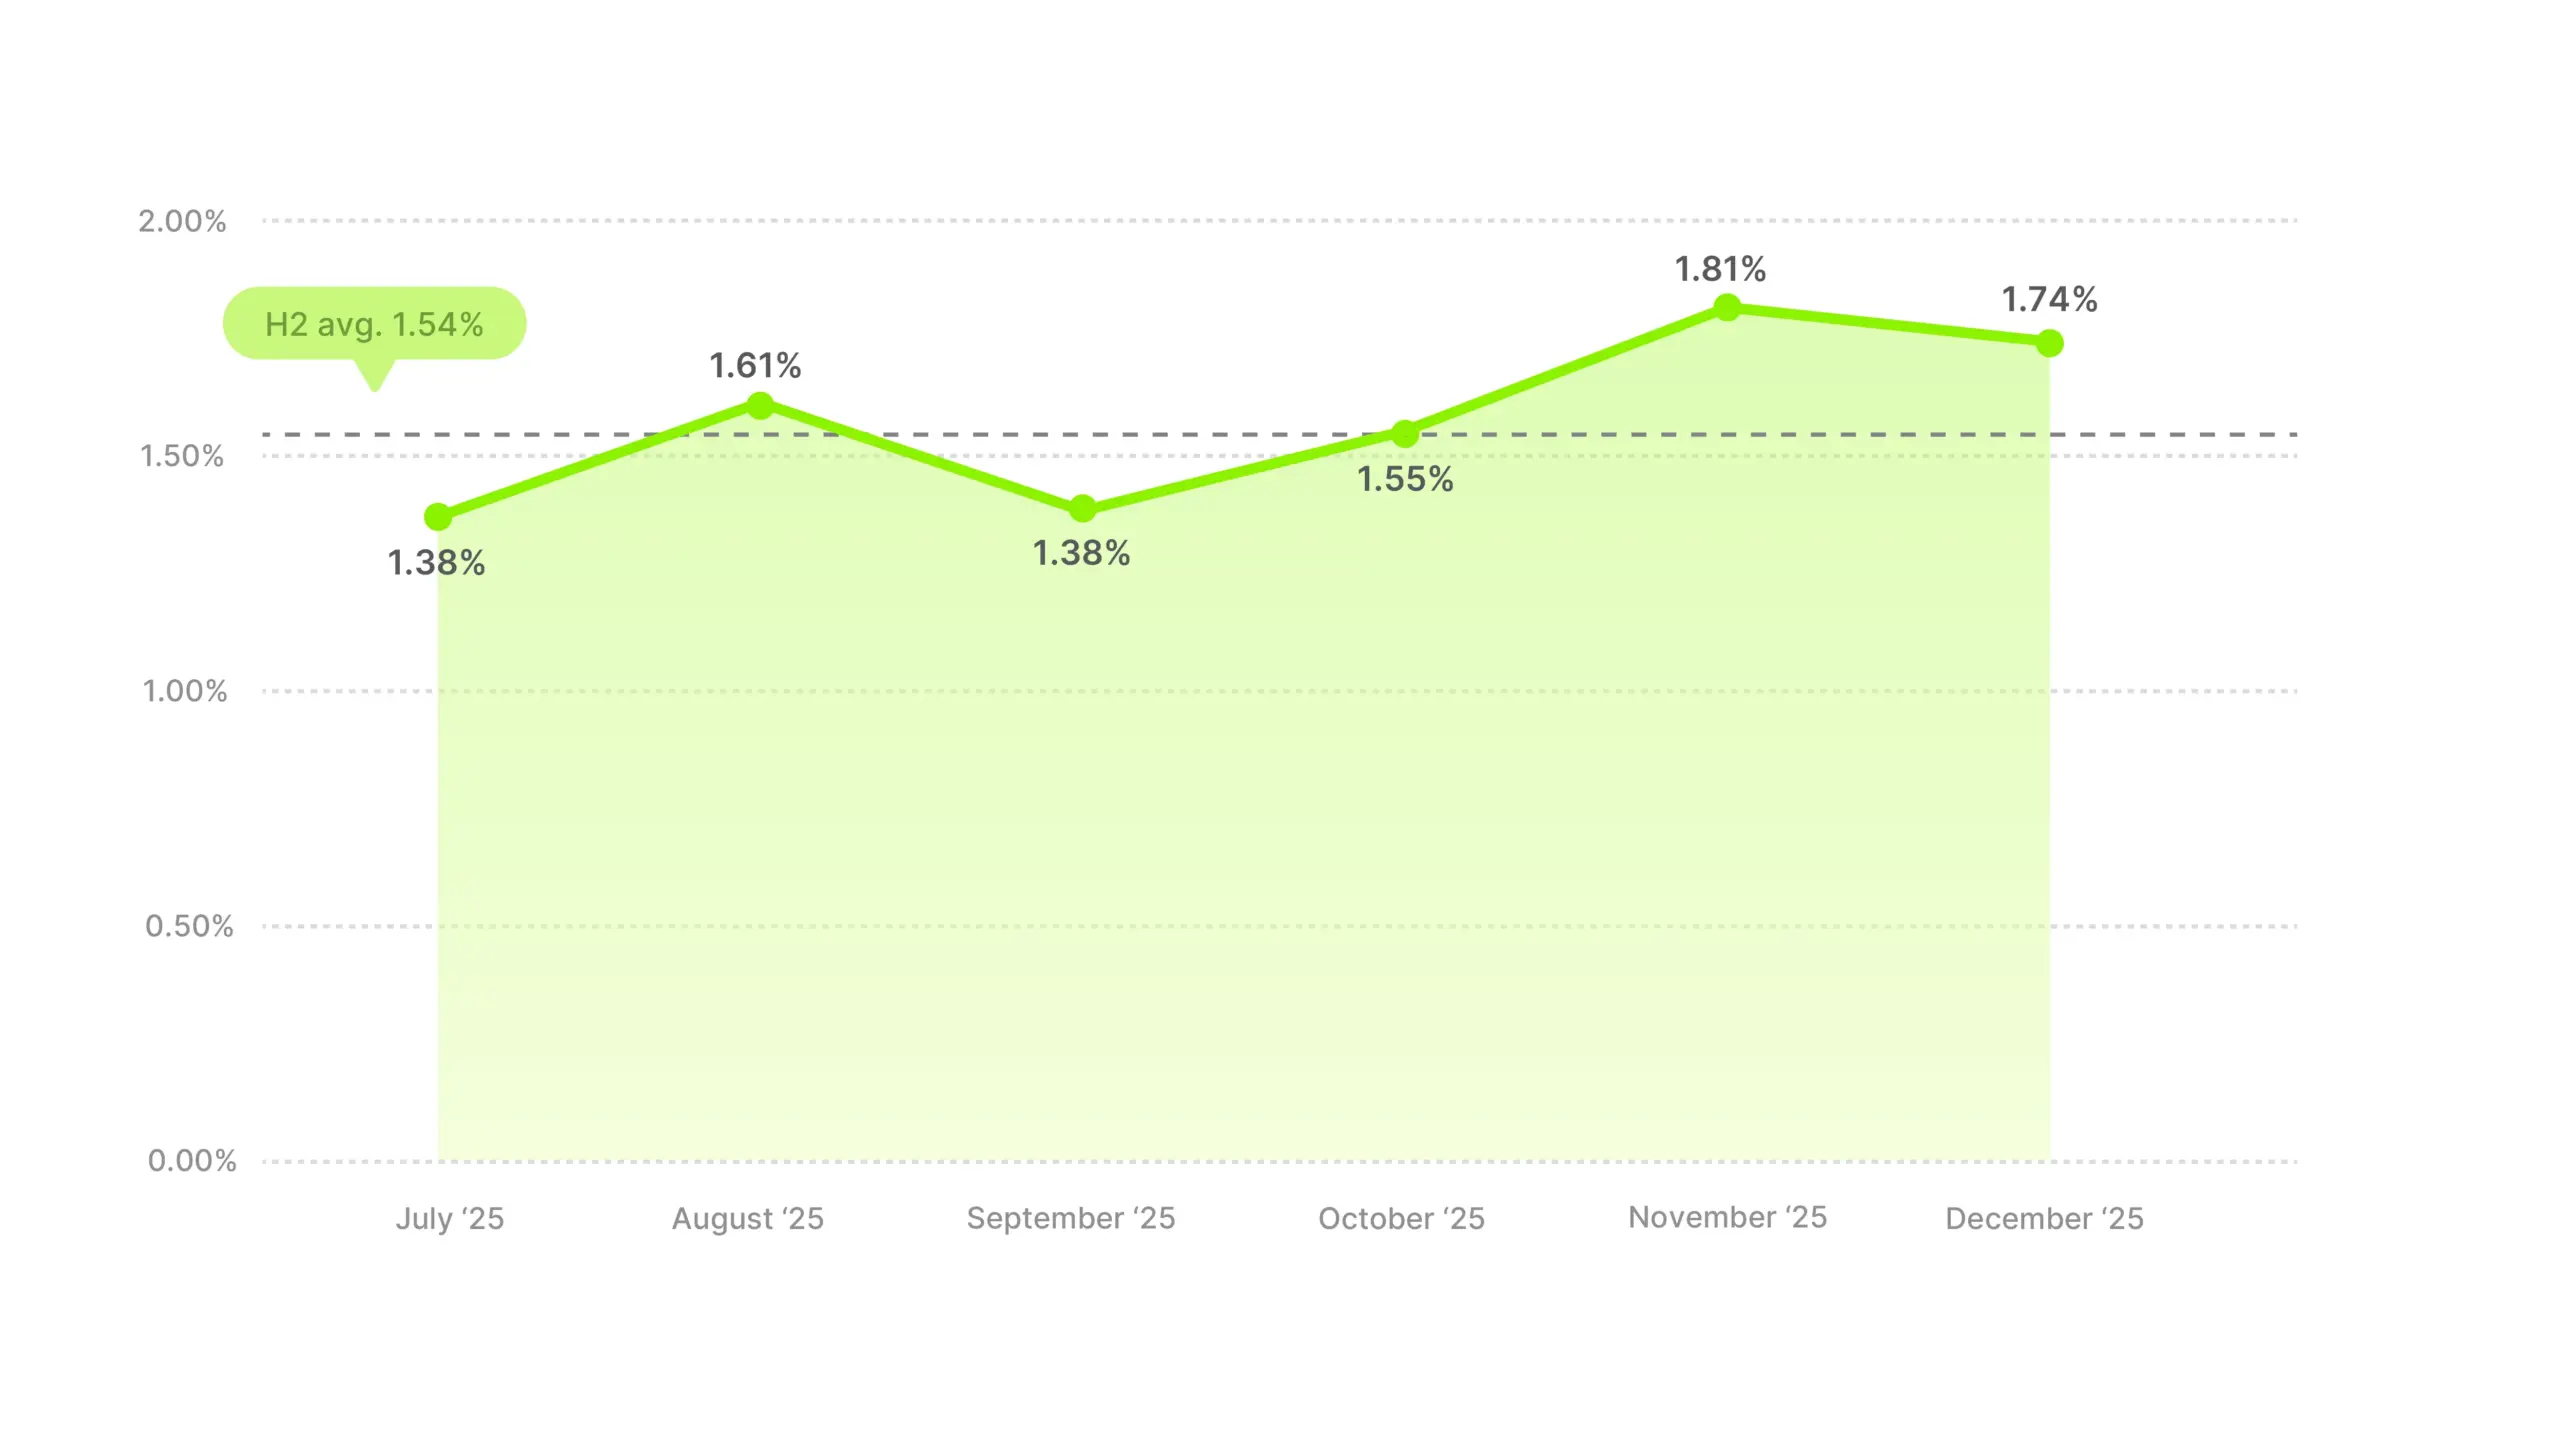
November’s peak at 1.81% is surprising for a B2B-leaning category. You wouldn’t expect strong holiday seasonality here. But it lines up with a different calendar, end-of-year budget cycles. Businesses spending remaining budgets before Q4 closes would naturally drive more active engagement with ads for supplies, equipment, and services.
The month-to-month volatility is higher than most categories, with a zigzag pattern of two dips and two surges. August spikes to 1.61% and doesn’t hold, September drops back, then the Q4 lift carries November and December. If you’re planning B2B video campaigns, expect more month-to-month fluctuation than consumer categories, and treat 1.54% as your benchmark with November and December as your strongest window.
Electronics sits right at the overall average for H2, but the monthly pattern contains the most dramatic single-month swing in the entire dataset. Four months of nearly flat CTR, followed by a sharp November dip and a December spike.
Industry CTR average
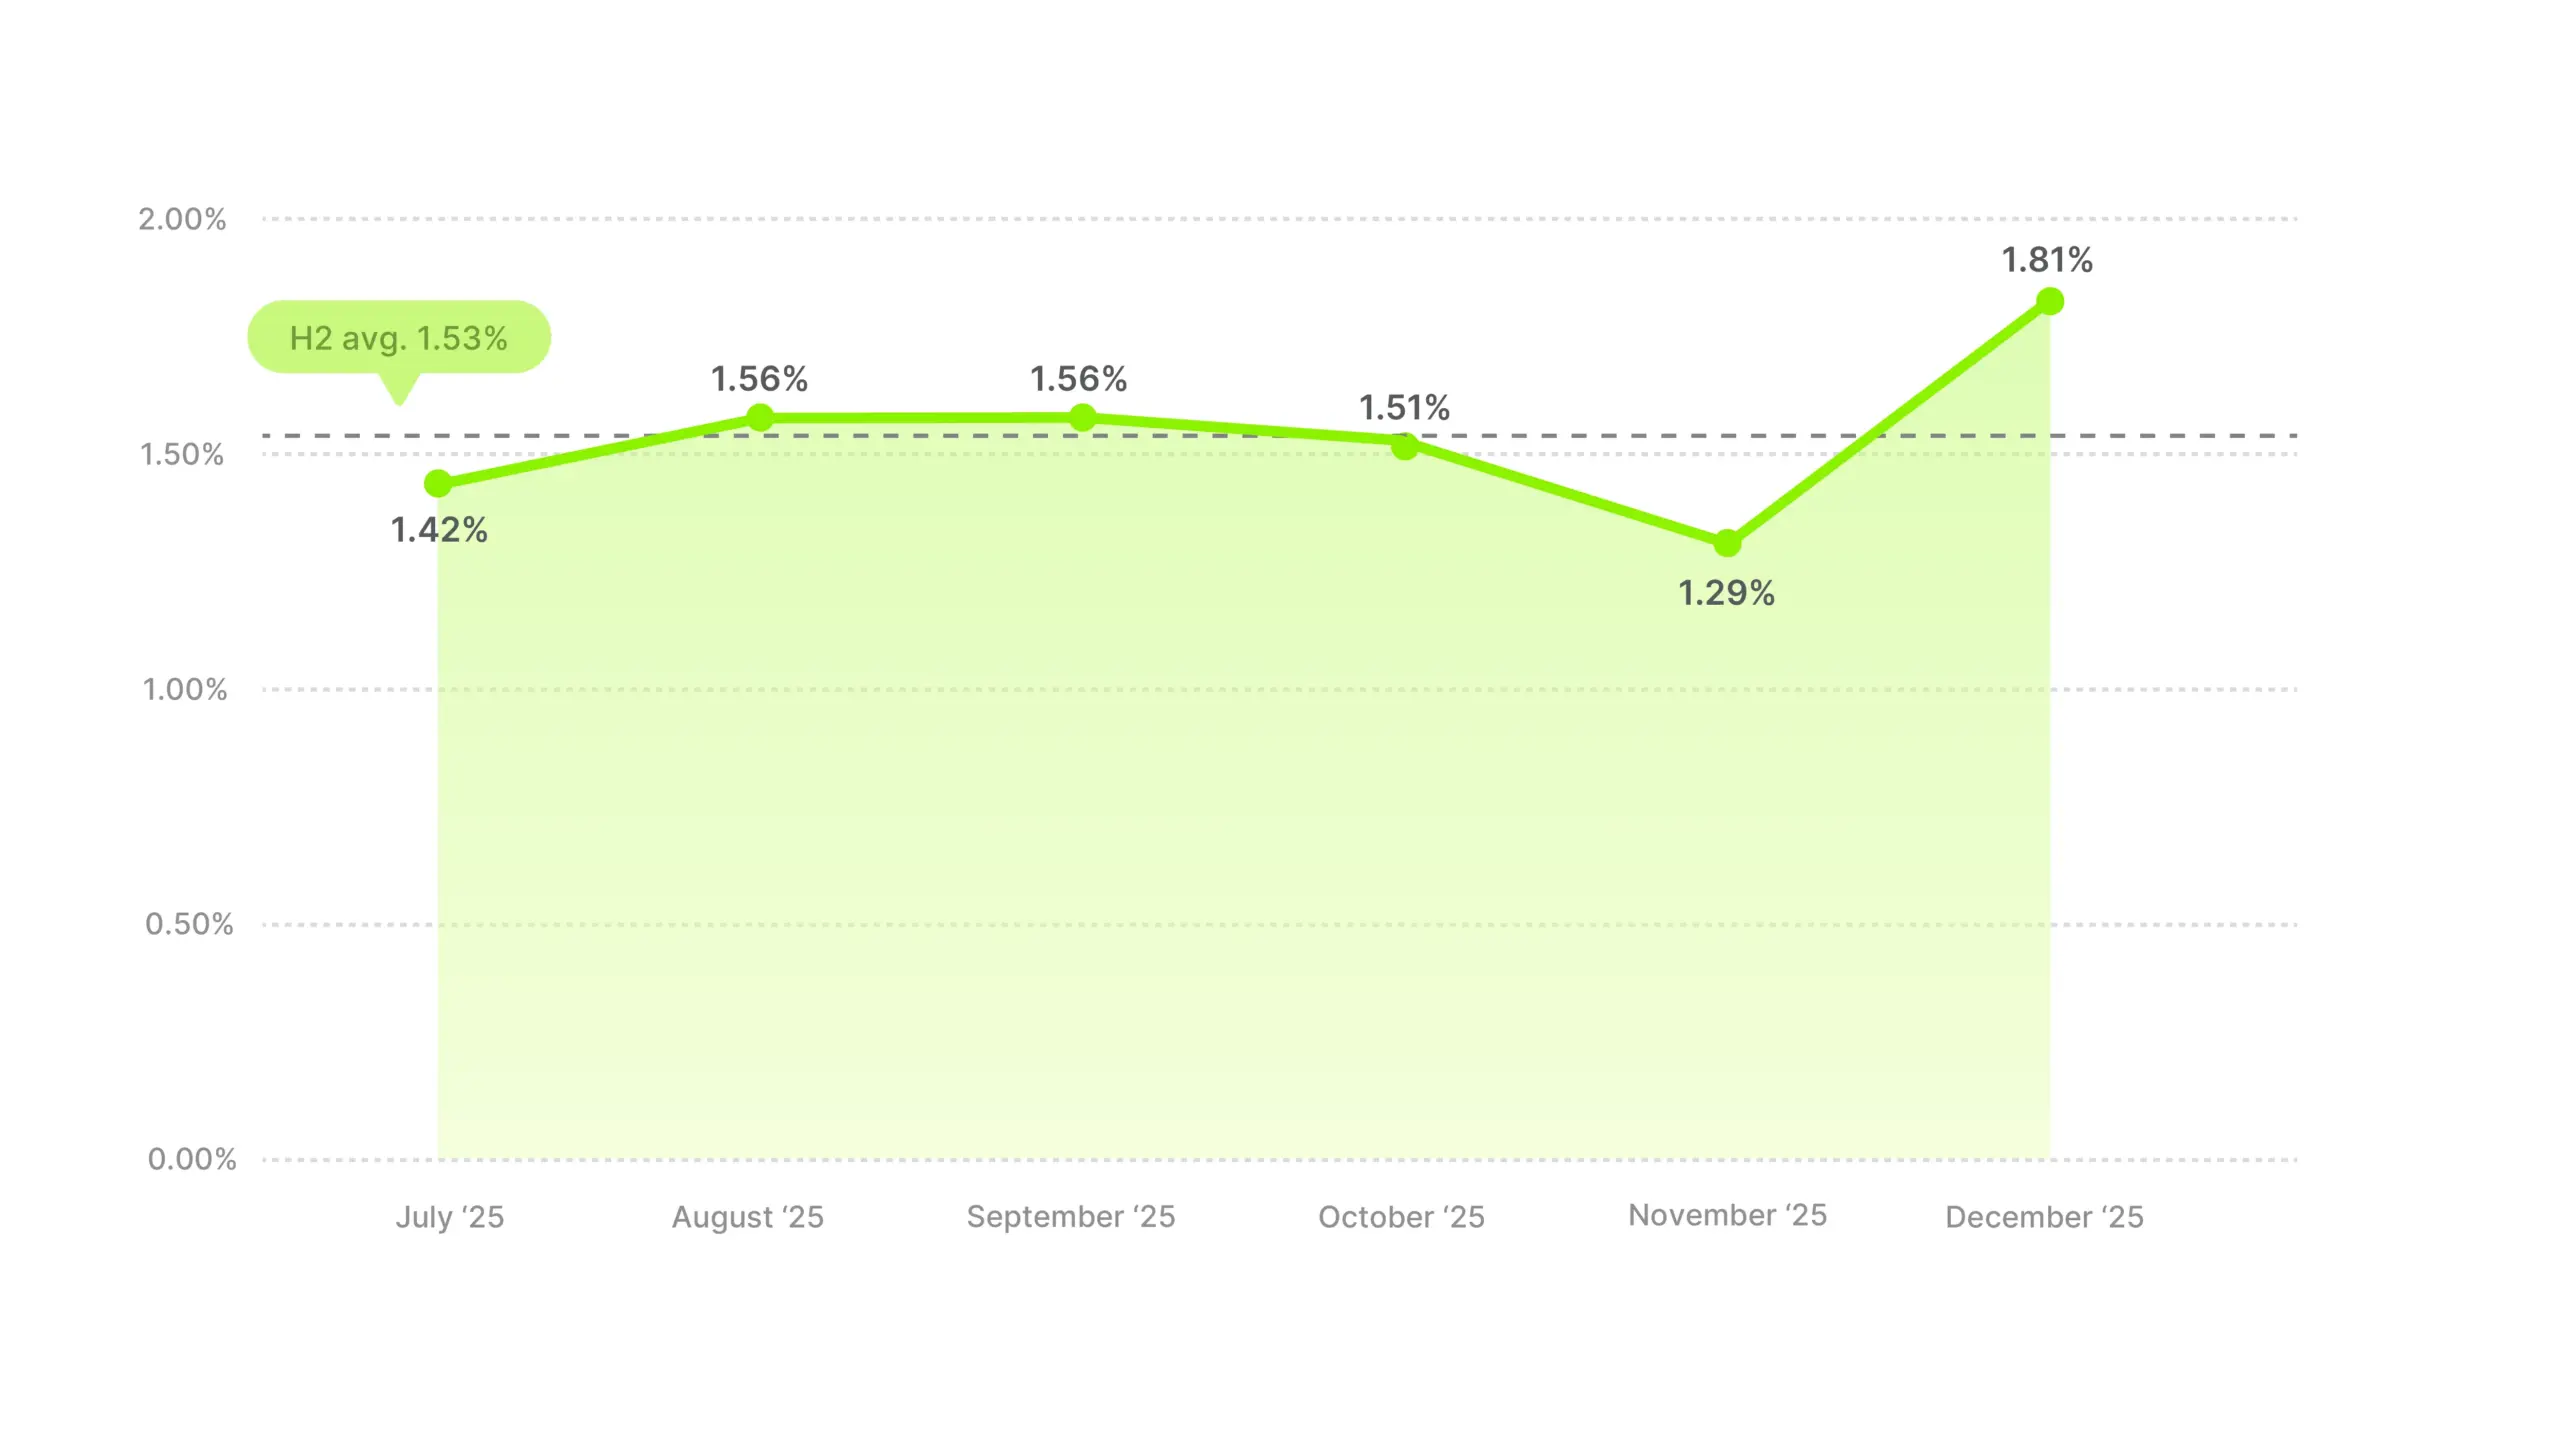
November drops to 1.29%, the lowest month, while December jumps to 1.81%, the highest. That’s a +0.52 pp swing in a single month. While most categories get a November lift, Electronics goes the opposite direction. It’s the mirror image of Apparel, which peaked in November.
The most plausible explanation is Black Friday behavior. Electronics is one of the most deal-driven categories, and if people know big discounts are coming, they may be comparing, researching, and building wishlists in November rather than clicking through video ads. Then December hits and those who didn’t buy on Black Friday become more responsive to ads as shipping deadlines and last-minute gifting create urgency. We can’t prove that from CTR data alone, but the pattern fits.
This also showed up in hook rate data, where Electronics had the lowest November hooks as well. The pattern is consistent across both metrics. November attention goes elsewhere, December is when the clicks come.
Food & Beverages averaged 1.51% for H2, slightly below the overall average and in the middle of the pack. The trend is a gentle upward climb with minor zigzags, closely tracking the overall market shape.
Industry CTR average
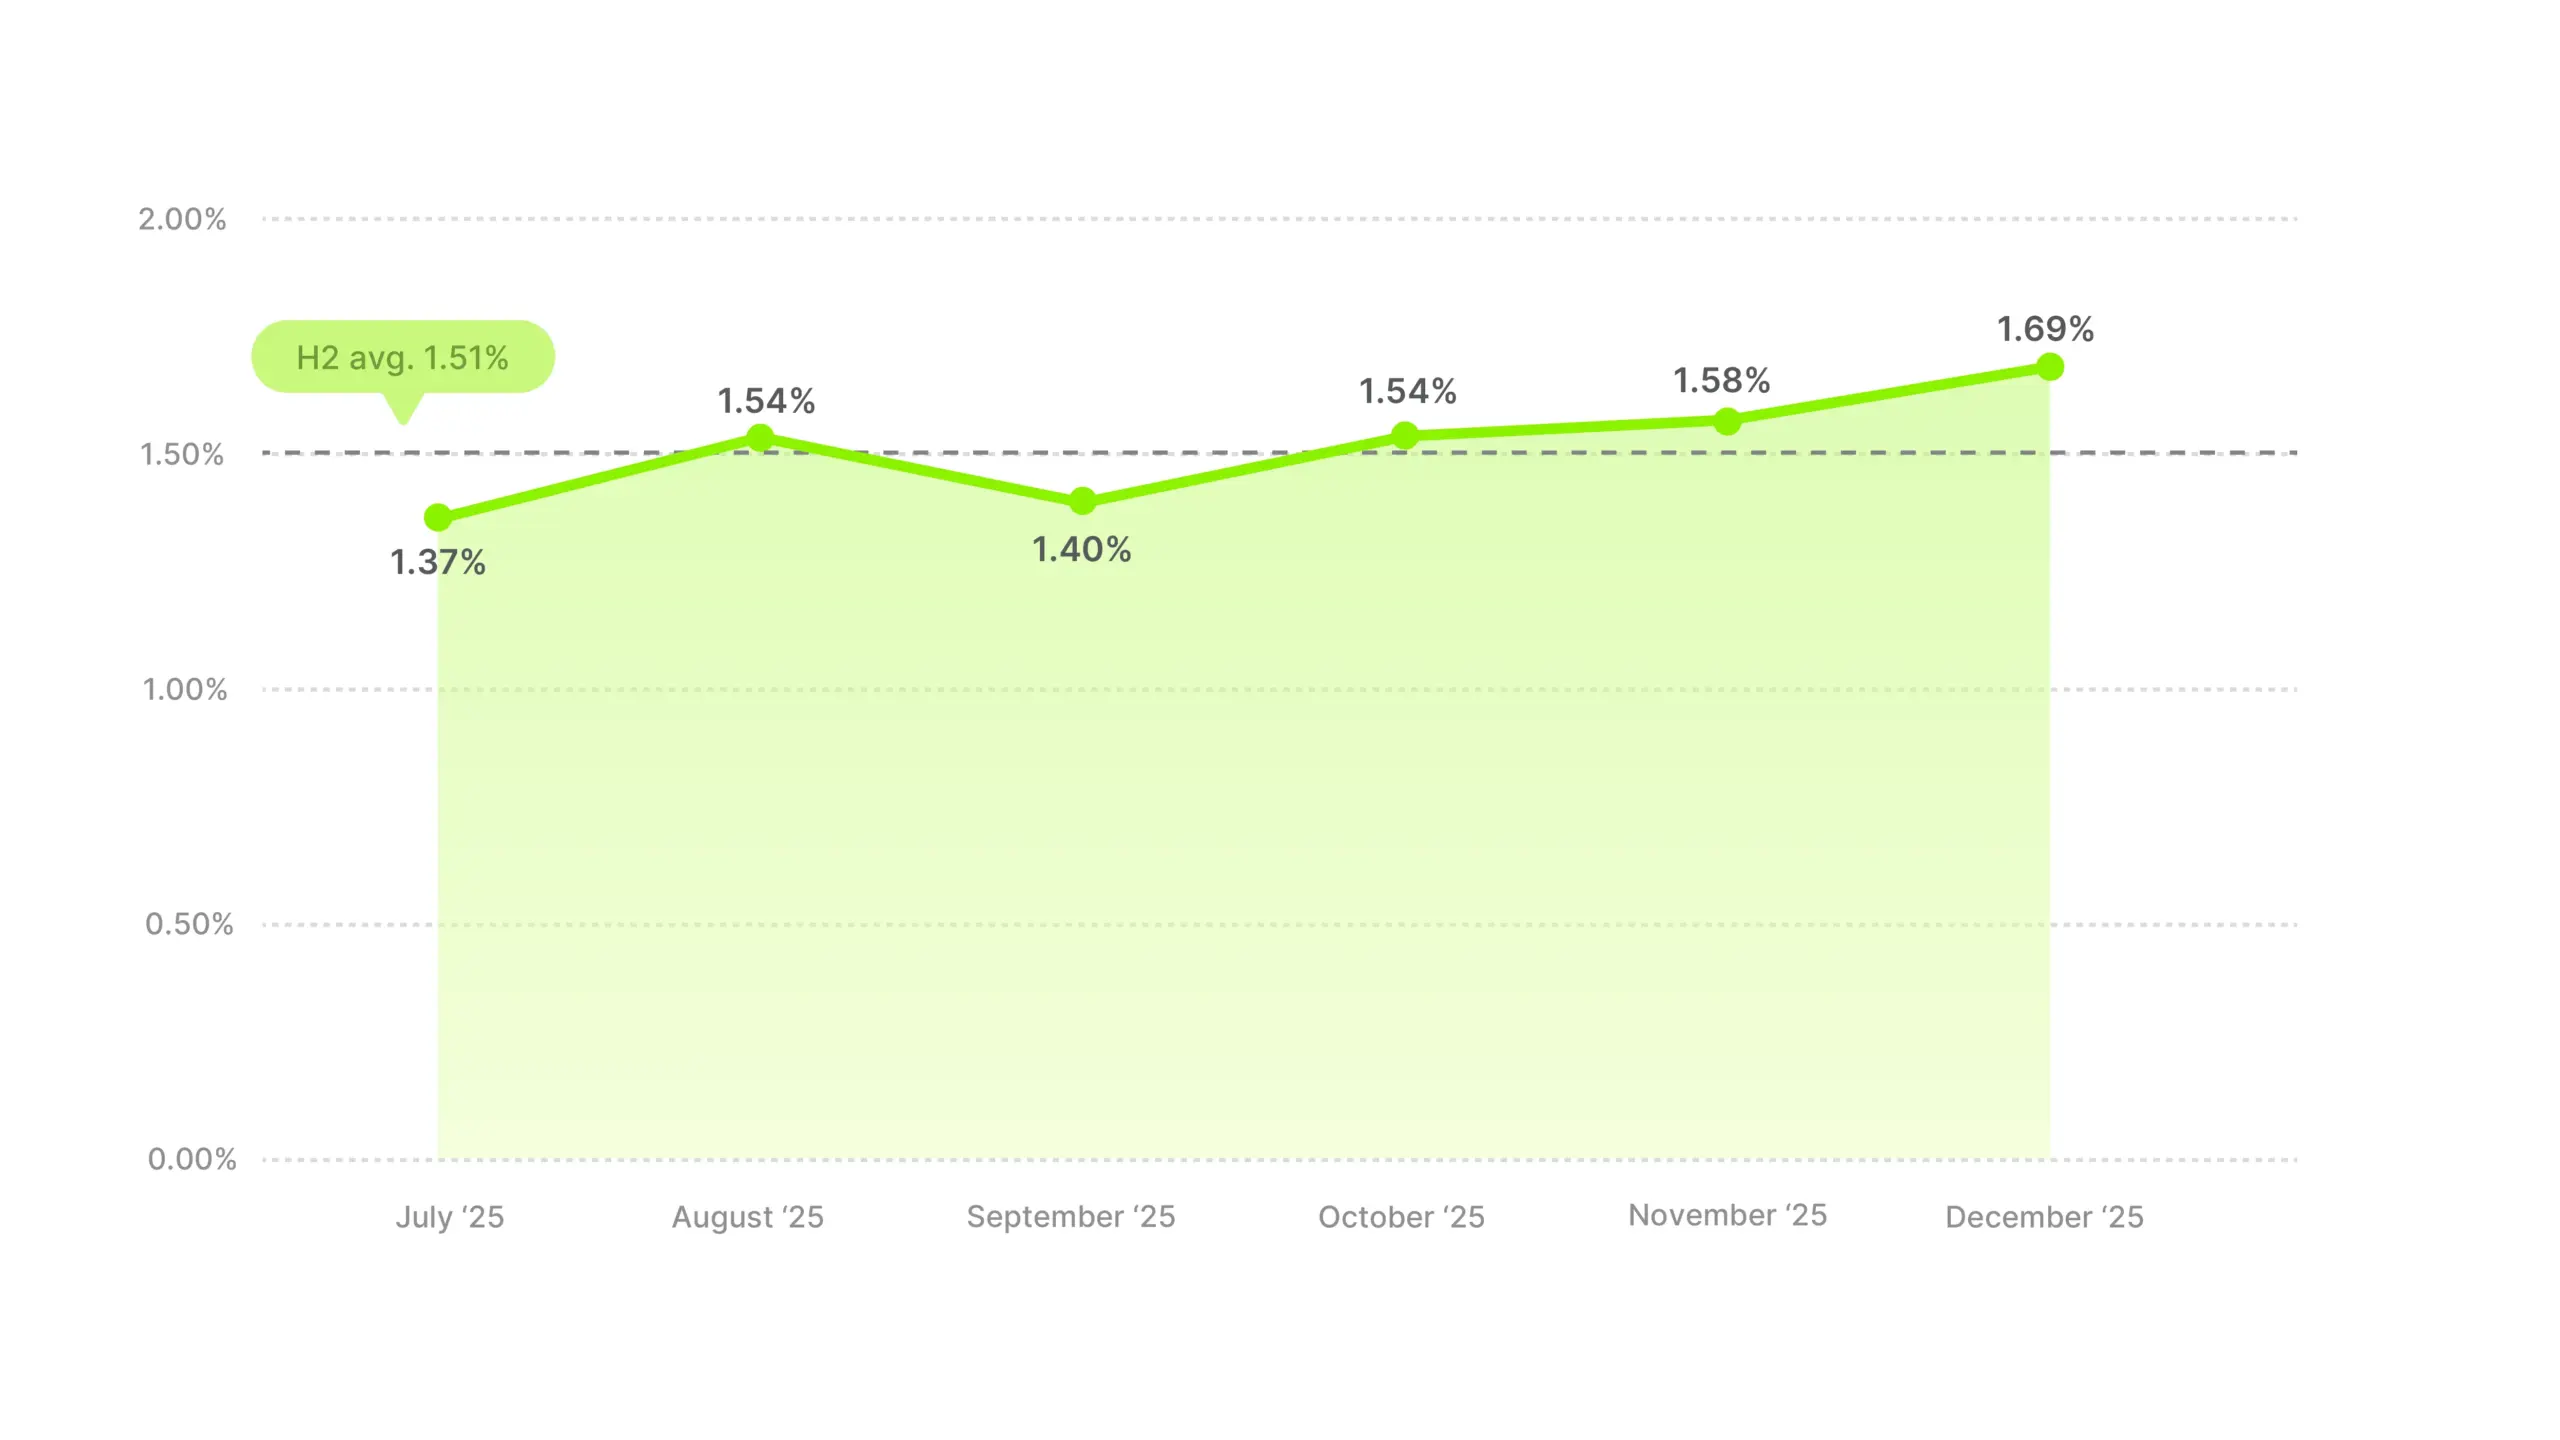
December is the peak at 1.69%, which could reflect holiday entertaining and hosting, people stocking up for parties, holiday cooking, gifting food boxes or specialty items. But the lift is gradual, not a sudden spike. The total spread across H2 is only 0.32 pp, one of the tighter ranges in the dataset.
This is one of the categories that most closely follows the overall market pattern. No dramatic seasonal moves, just a steady climb that tracks the broader trend. For food and beverage brands, 1.51% is your benchmark, and the gentle Q4 lift means leaning into holiday-relevant creative (gift boxes, entertaining, seasonal flavors) could push you slightly above that baseline when it matters most.
An interesting contrast with hook rates here. Food & Beverages was above average on hooks (25.47%) but below average on CTR. The category grabs attention well, especially in summer, but converting that attention to clicks is the harder problem.
Health & Beauty ties for the highest CTR at 1.90% and also led hook rates at 28.34%. This is the only category that dominates both metrics, meaning the full funnel from attention to click works better here for video ads than anywhere else in the dataset.
Industry CTR average
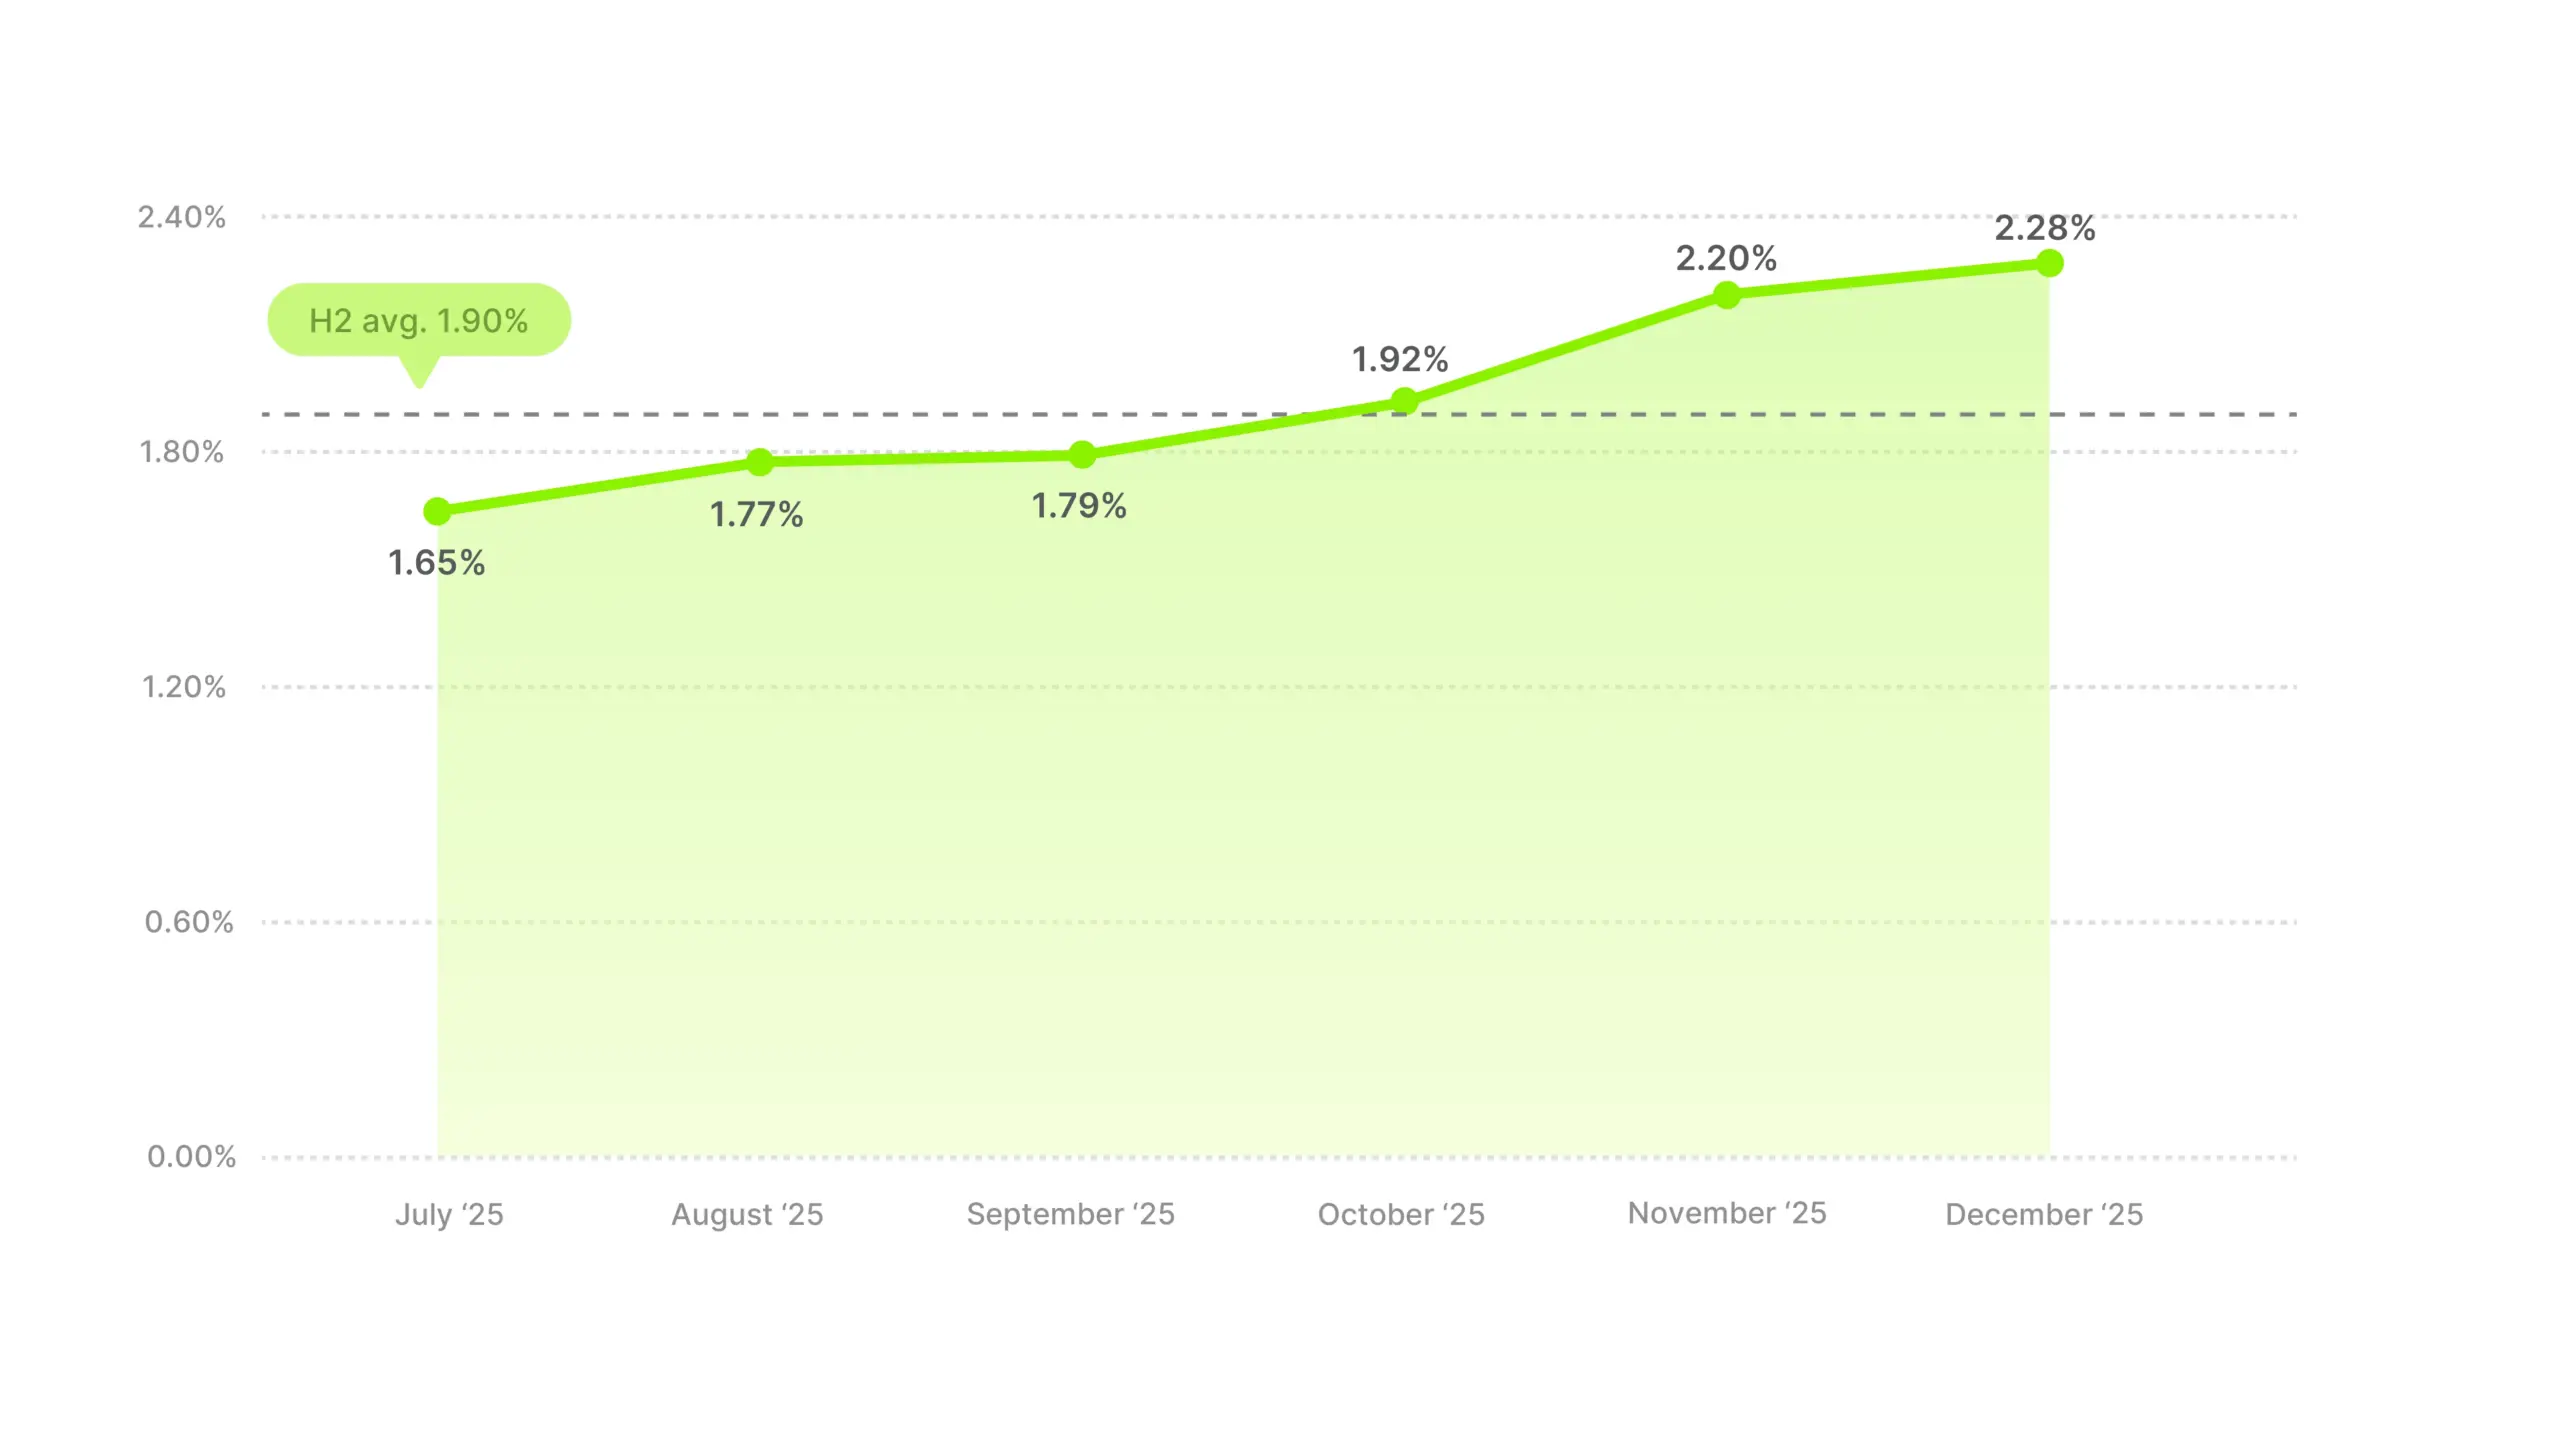
The monthly trend is almost identical to the overall market, just higher. A clean upward climb with every month higher than the last and no dips or reversals. This is the smoothest CTR curve of any category. The acceleration happens in October through November (+0.28 pp), then December pushes to 2.28%, one of the highest single-month CTRs in the entire dataset.
Health & Beauty is a strong gifting category (skincare sets, makeup kits, fragrance), which contributes to the Q4 lift. But it also has a year-round self-purchase cycle, replenishment, trying new products, which keeps the baseline high even in summer.
If you’re in this category, 1.90% is your floor. In Q4 you should be pushing toward 2.2%+. And the fact that both hook rate and CTR are strong means video ads are working across the full funnel for this vertical.
Home & Garden ties with Health & Beauty for the highest CTR, which is a surprise if you followed our hook rate data. This category was dead average on hooks (24.47%) but leads the pack on clicks. Stopping the scroll and earning the click are clearly two different problems, and Home & Garden solves the second one better than almost anyone.
Industry CTR average
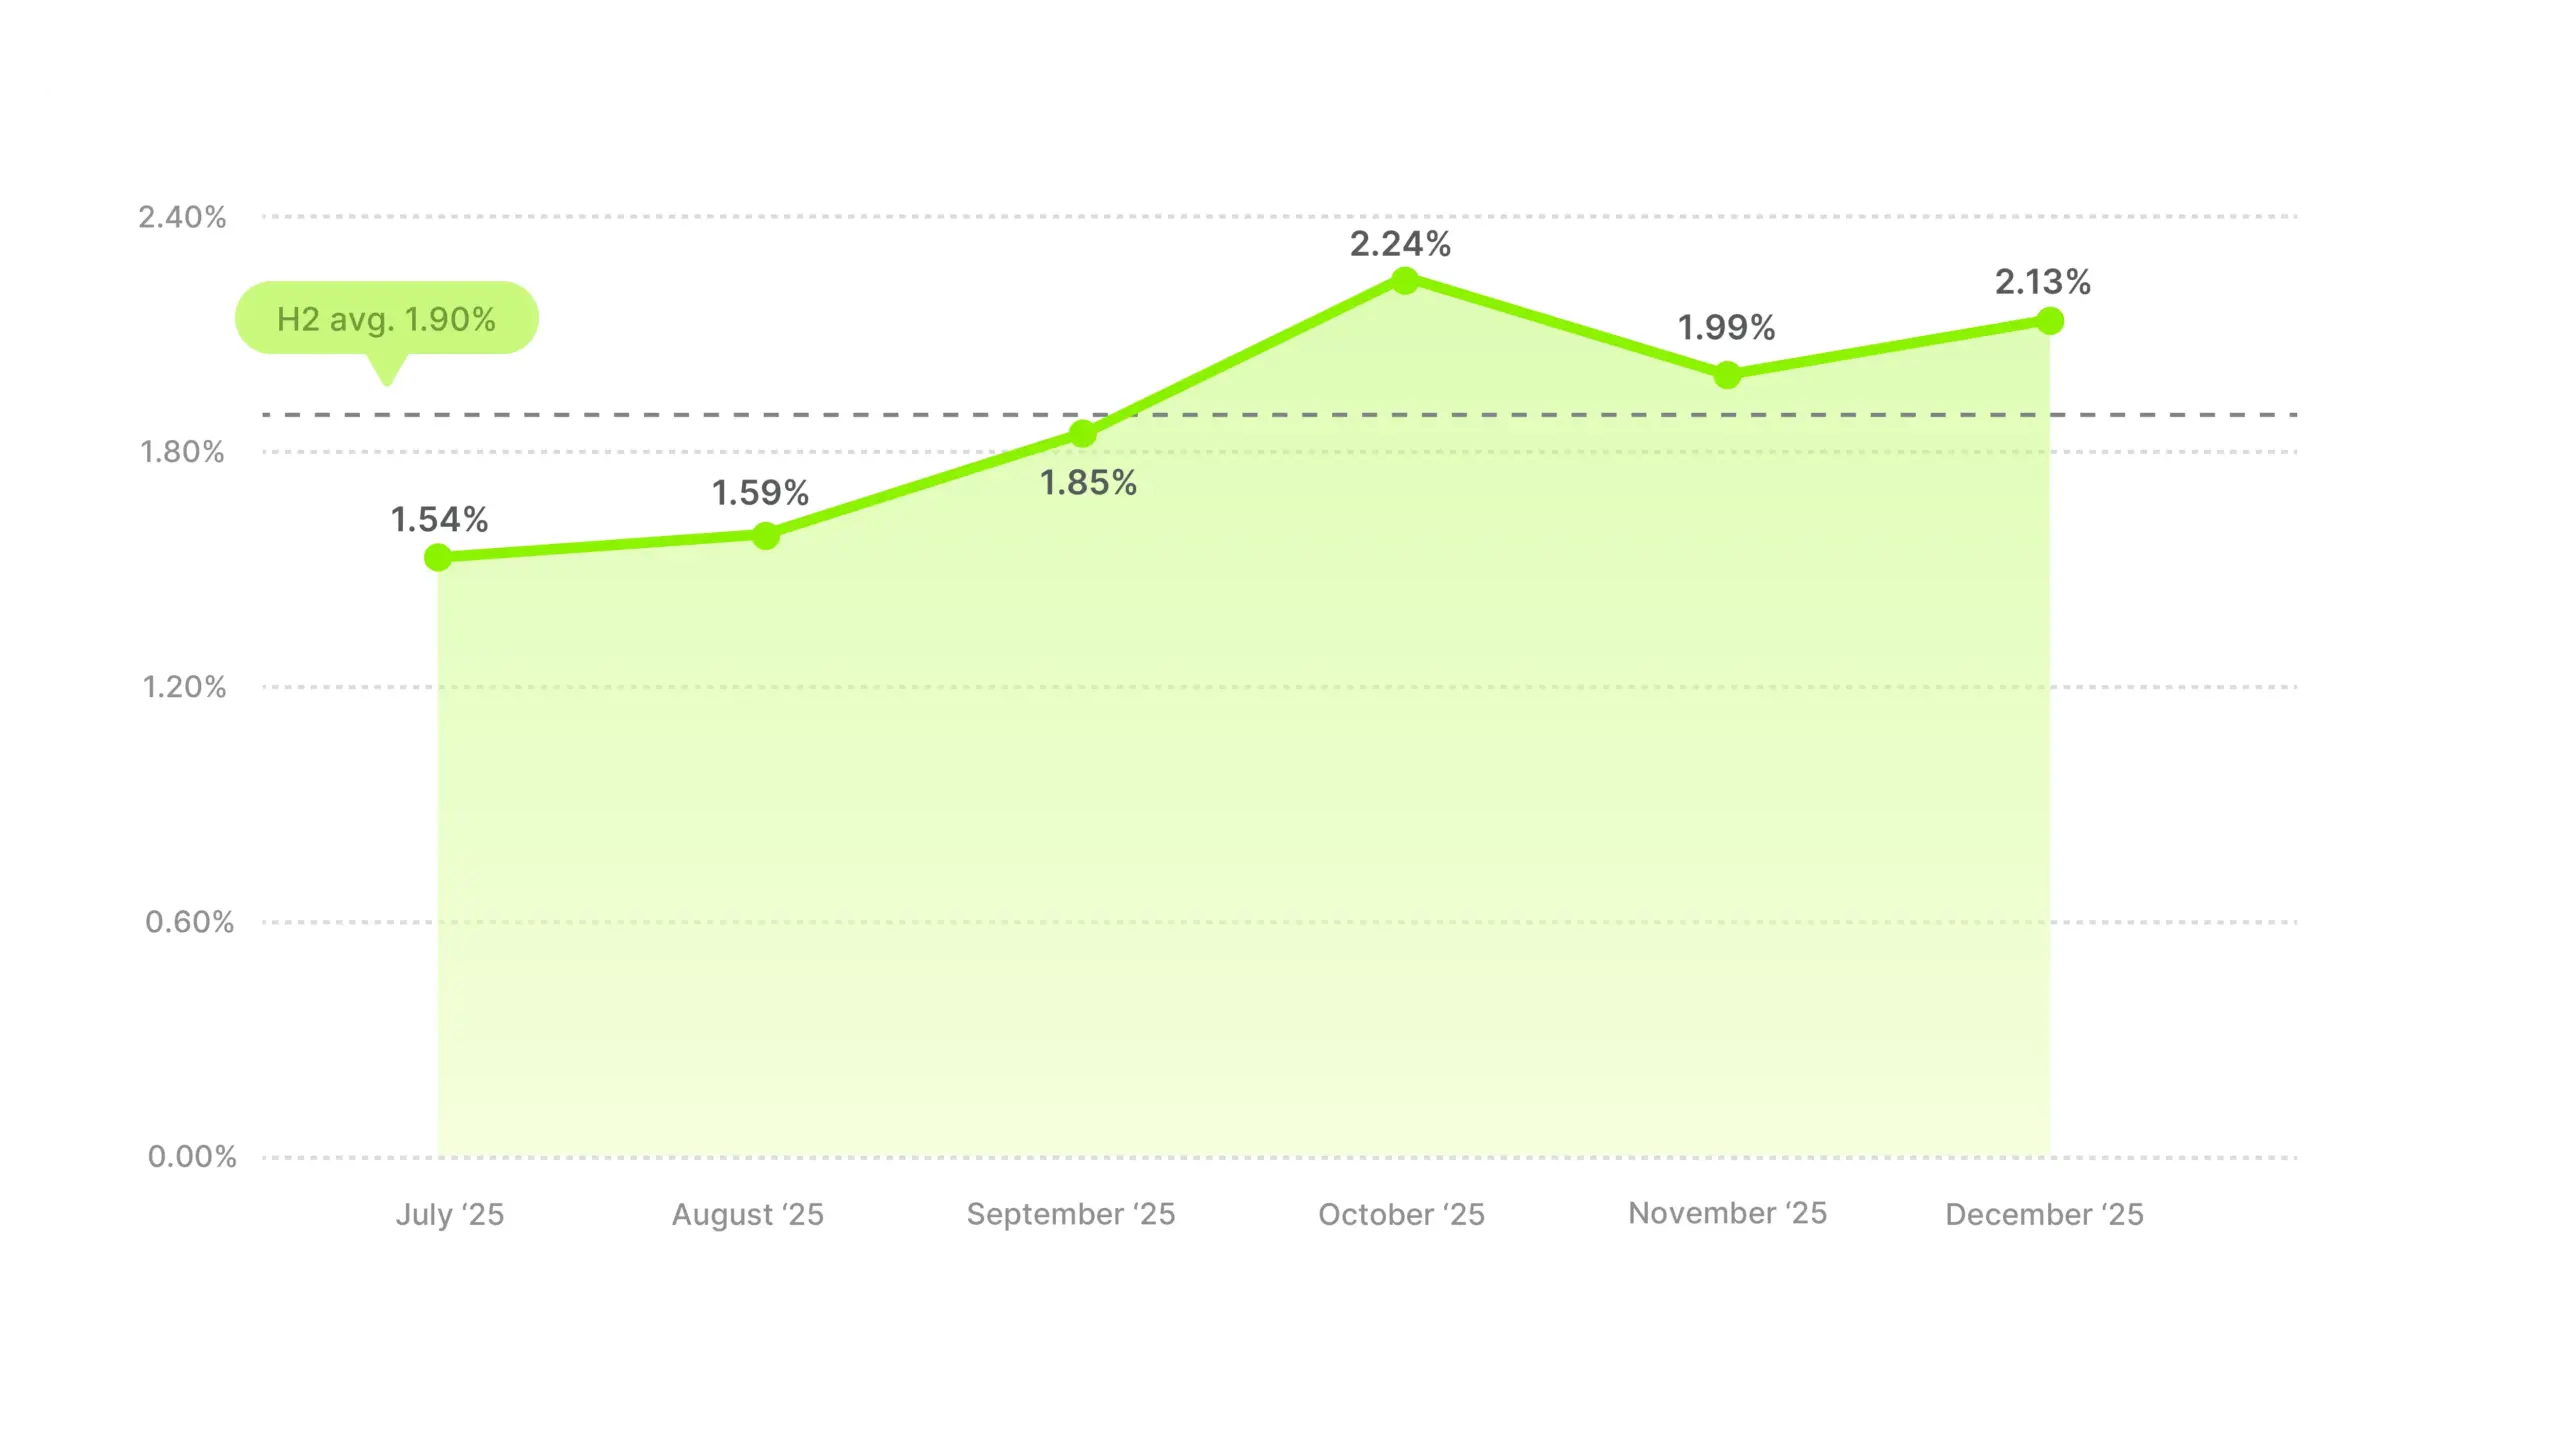
The October spike is the standout. A +0.39 pp jump from September to October is one of the largest in the dataset, and it makes sense for the category. Fall is prime home improvement and nesting season, people moving indoors, prepping for winter, refreshing spaces, and adding Halloween decorations before hosting holiday gatherings. That’s a natural trigger for clicking through to home and garden products.
November dips to 1.99%, which may reflect attention shifting to more traditional gifting categories as Black Friday approaches. December climbs back to 2.13% but doesn’t reach October’s peak, possibly driven by last-minute home prep before hosting or gift purchases in decor and kitchen subcategories.
The pattern is completely different from Health & Beauty even though they share the top CTR spot. Health & Beauty climbed smoothly all half. Home & Garden has a mid-H2 peak followed by a dip and partial recovery. If you’re planning home and garden campaigns, October is your month, not December.
Services averaged 1.47%, below the overall average but in the middle cluster. The monthly pattern is the most volatile of any category, with a 0.88 pp spread between the lowest and highest months, nearly double most other verticals.
Industry CTR average
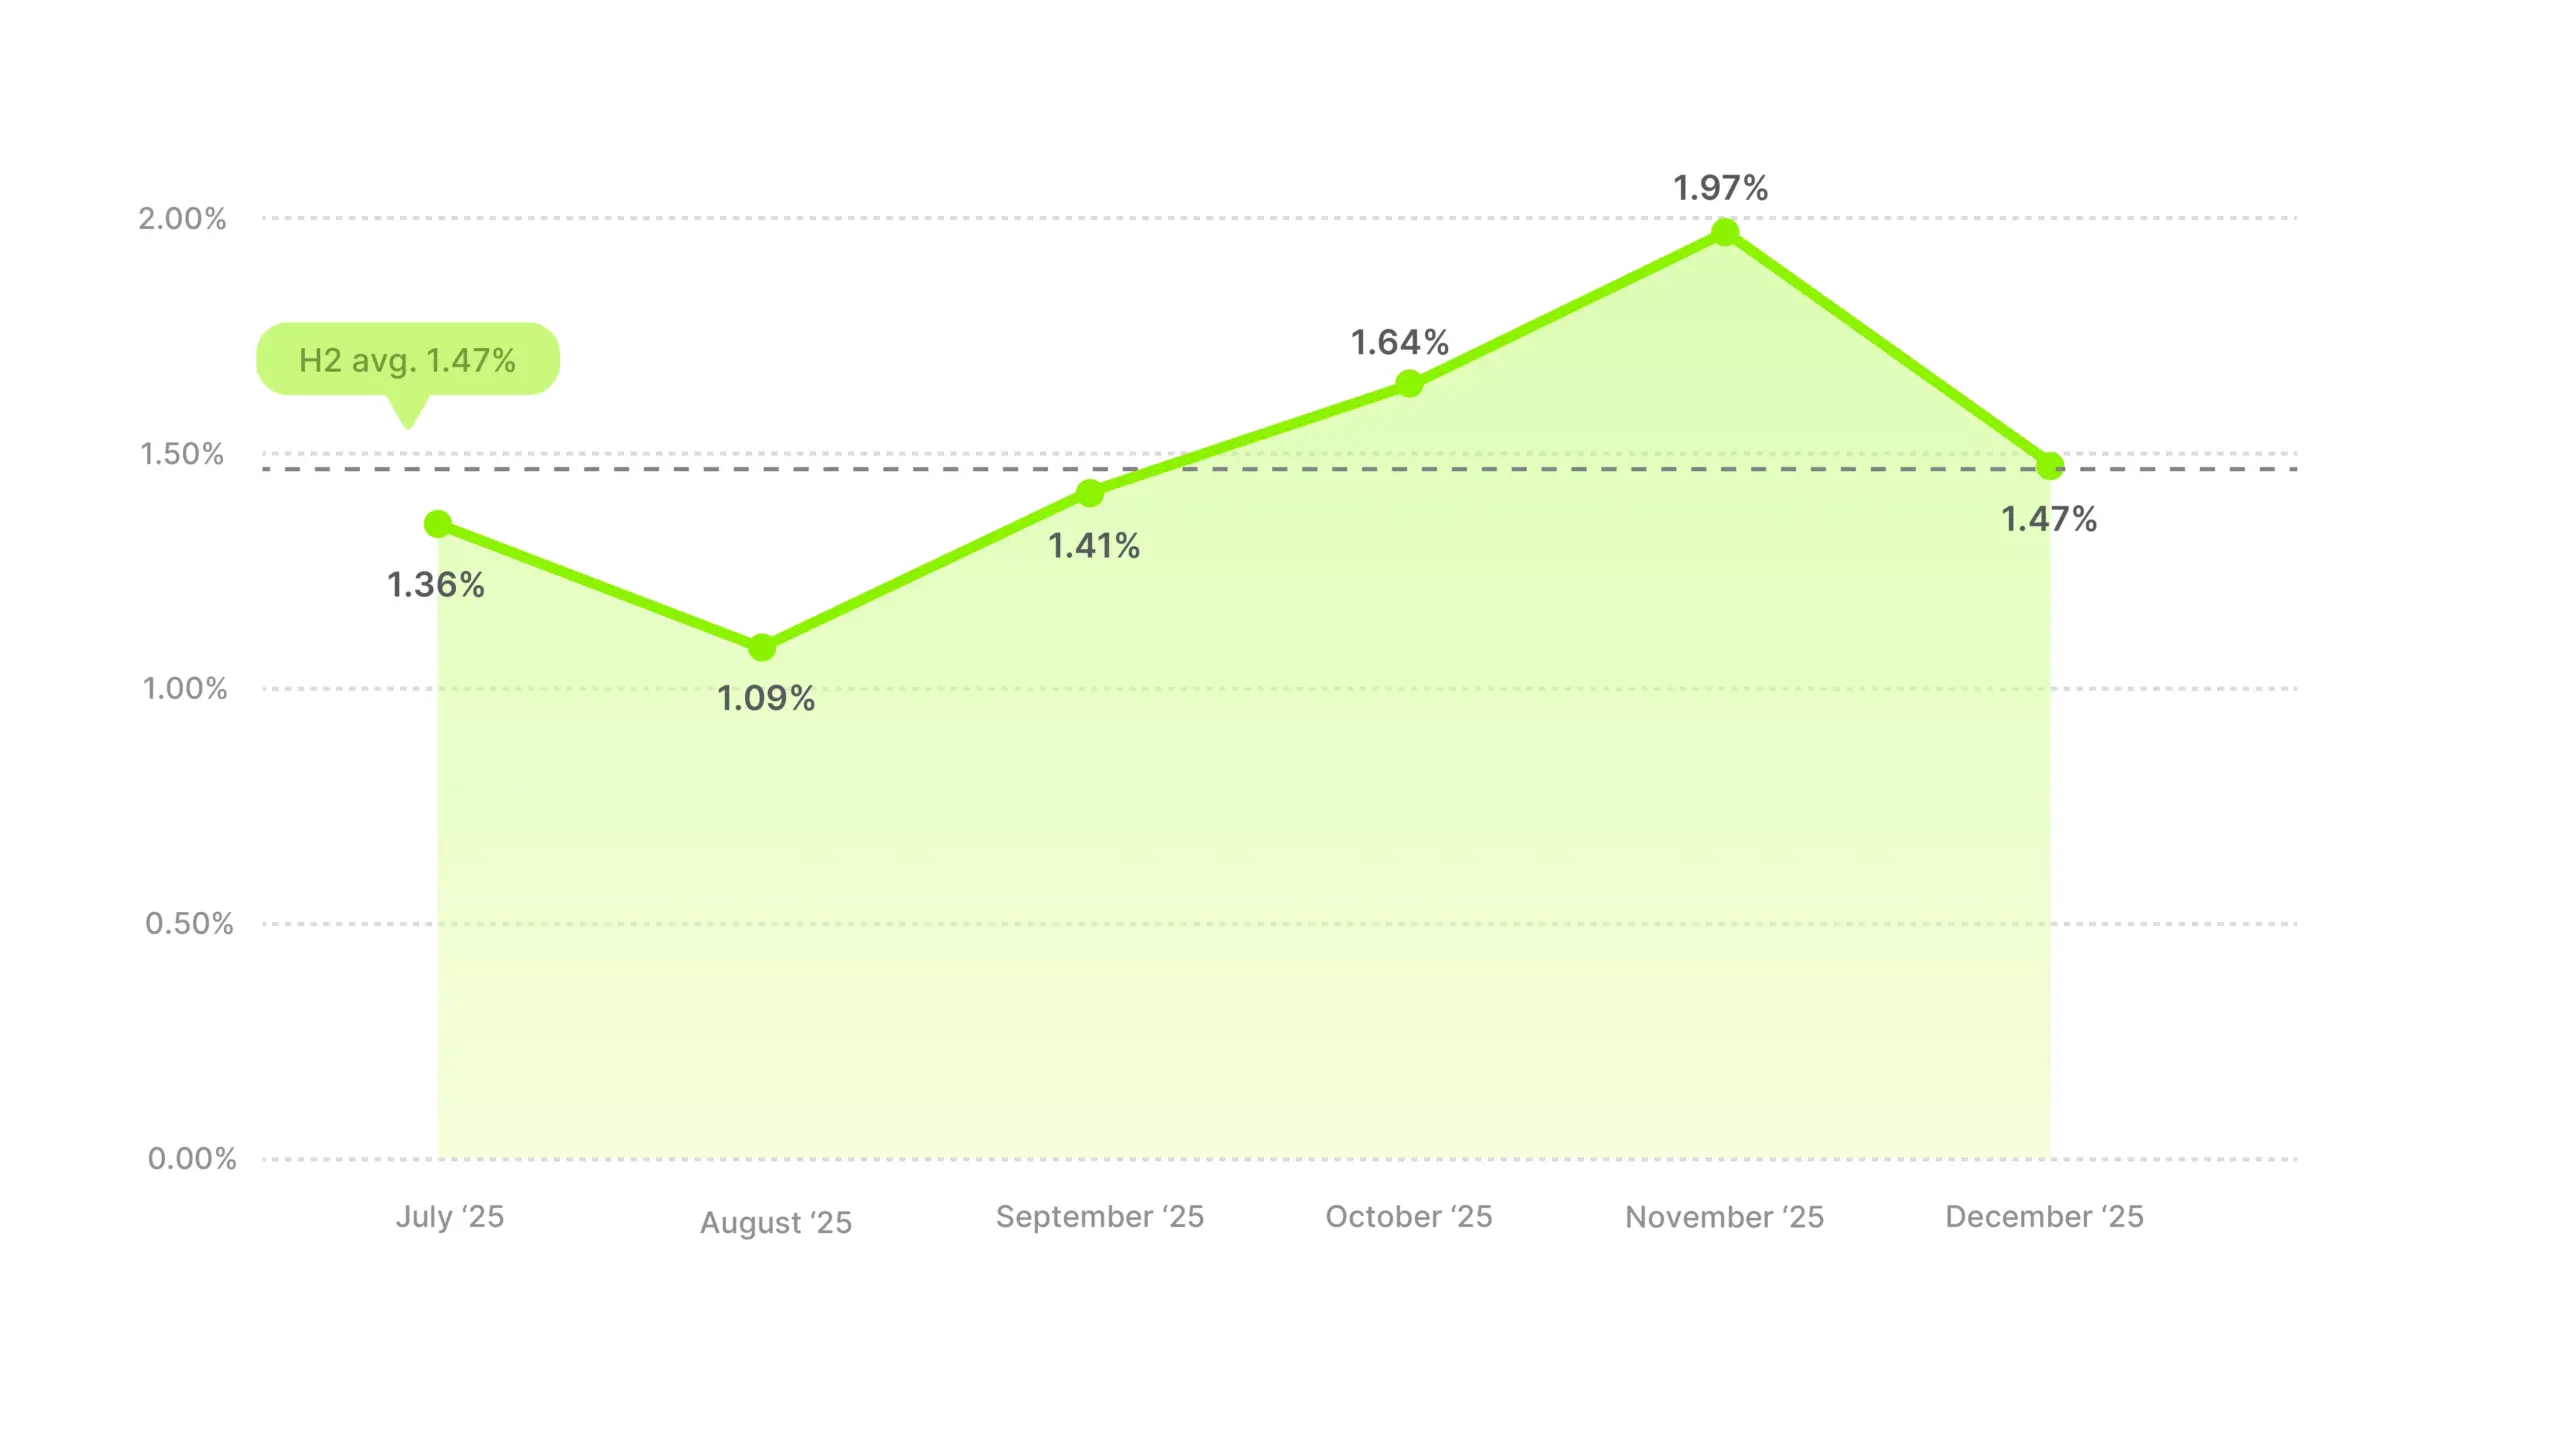
August’s dip to 1.09% is the second lowest single month of any category in the dataset (behind only Animals & Pet Supplies’ July). From there it climbs steadily to a November peak of 1.97%, then crashes back to 1.47% in December, giving back the entire Q4 lift in a single month.
November’s spike could reflect end-of-year service purchases, people locking in subscriptions, memberships, and service contracts before year-end. By December, those decisions are made and there’s no more intent to capture, which would explain why the lift completely evaporates.
Services is also the second-lowest hook rate category, so it’s struggling on both attention and clicks. The November spike suggests there is a window when this category can perform, but it’s narrow and timing-dependent.
Software’s 1.59% CTR is above the overall average, which is notable for a category competing via video ads. But the real story is December, where Software posted the single largest month-over-month CTR gain of any category in the entire dataset.
Industry CTR average
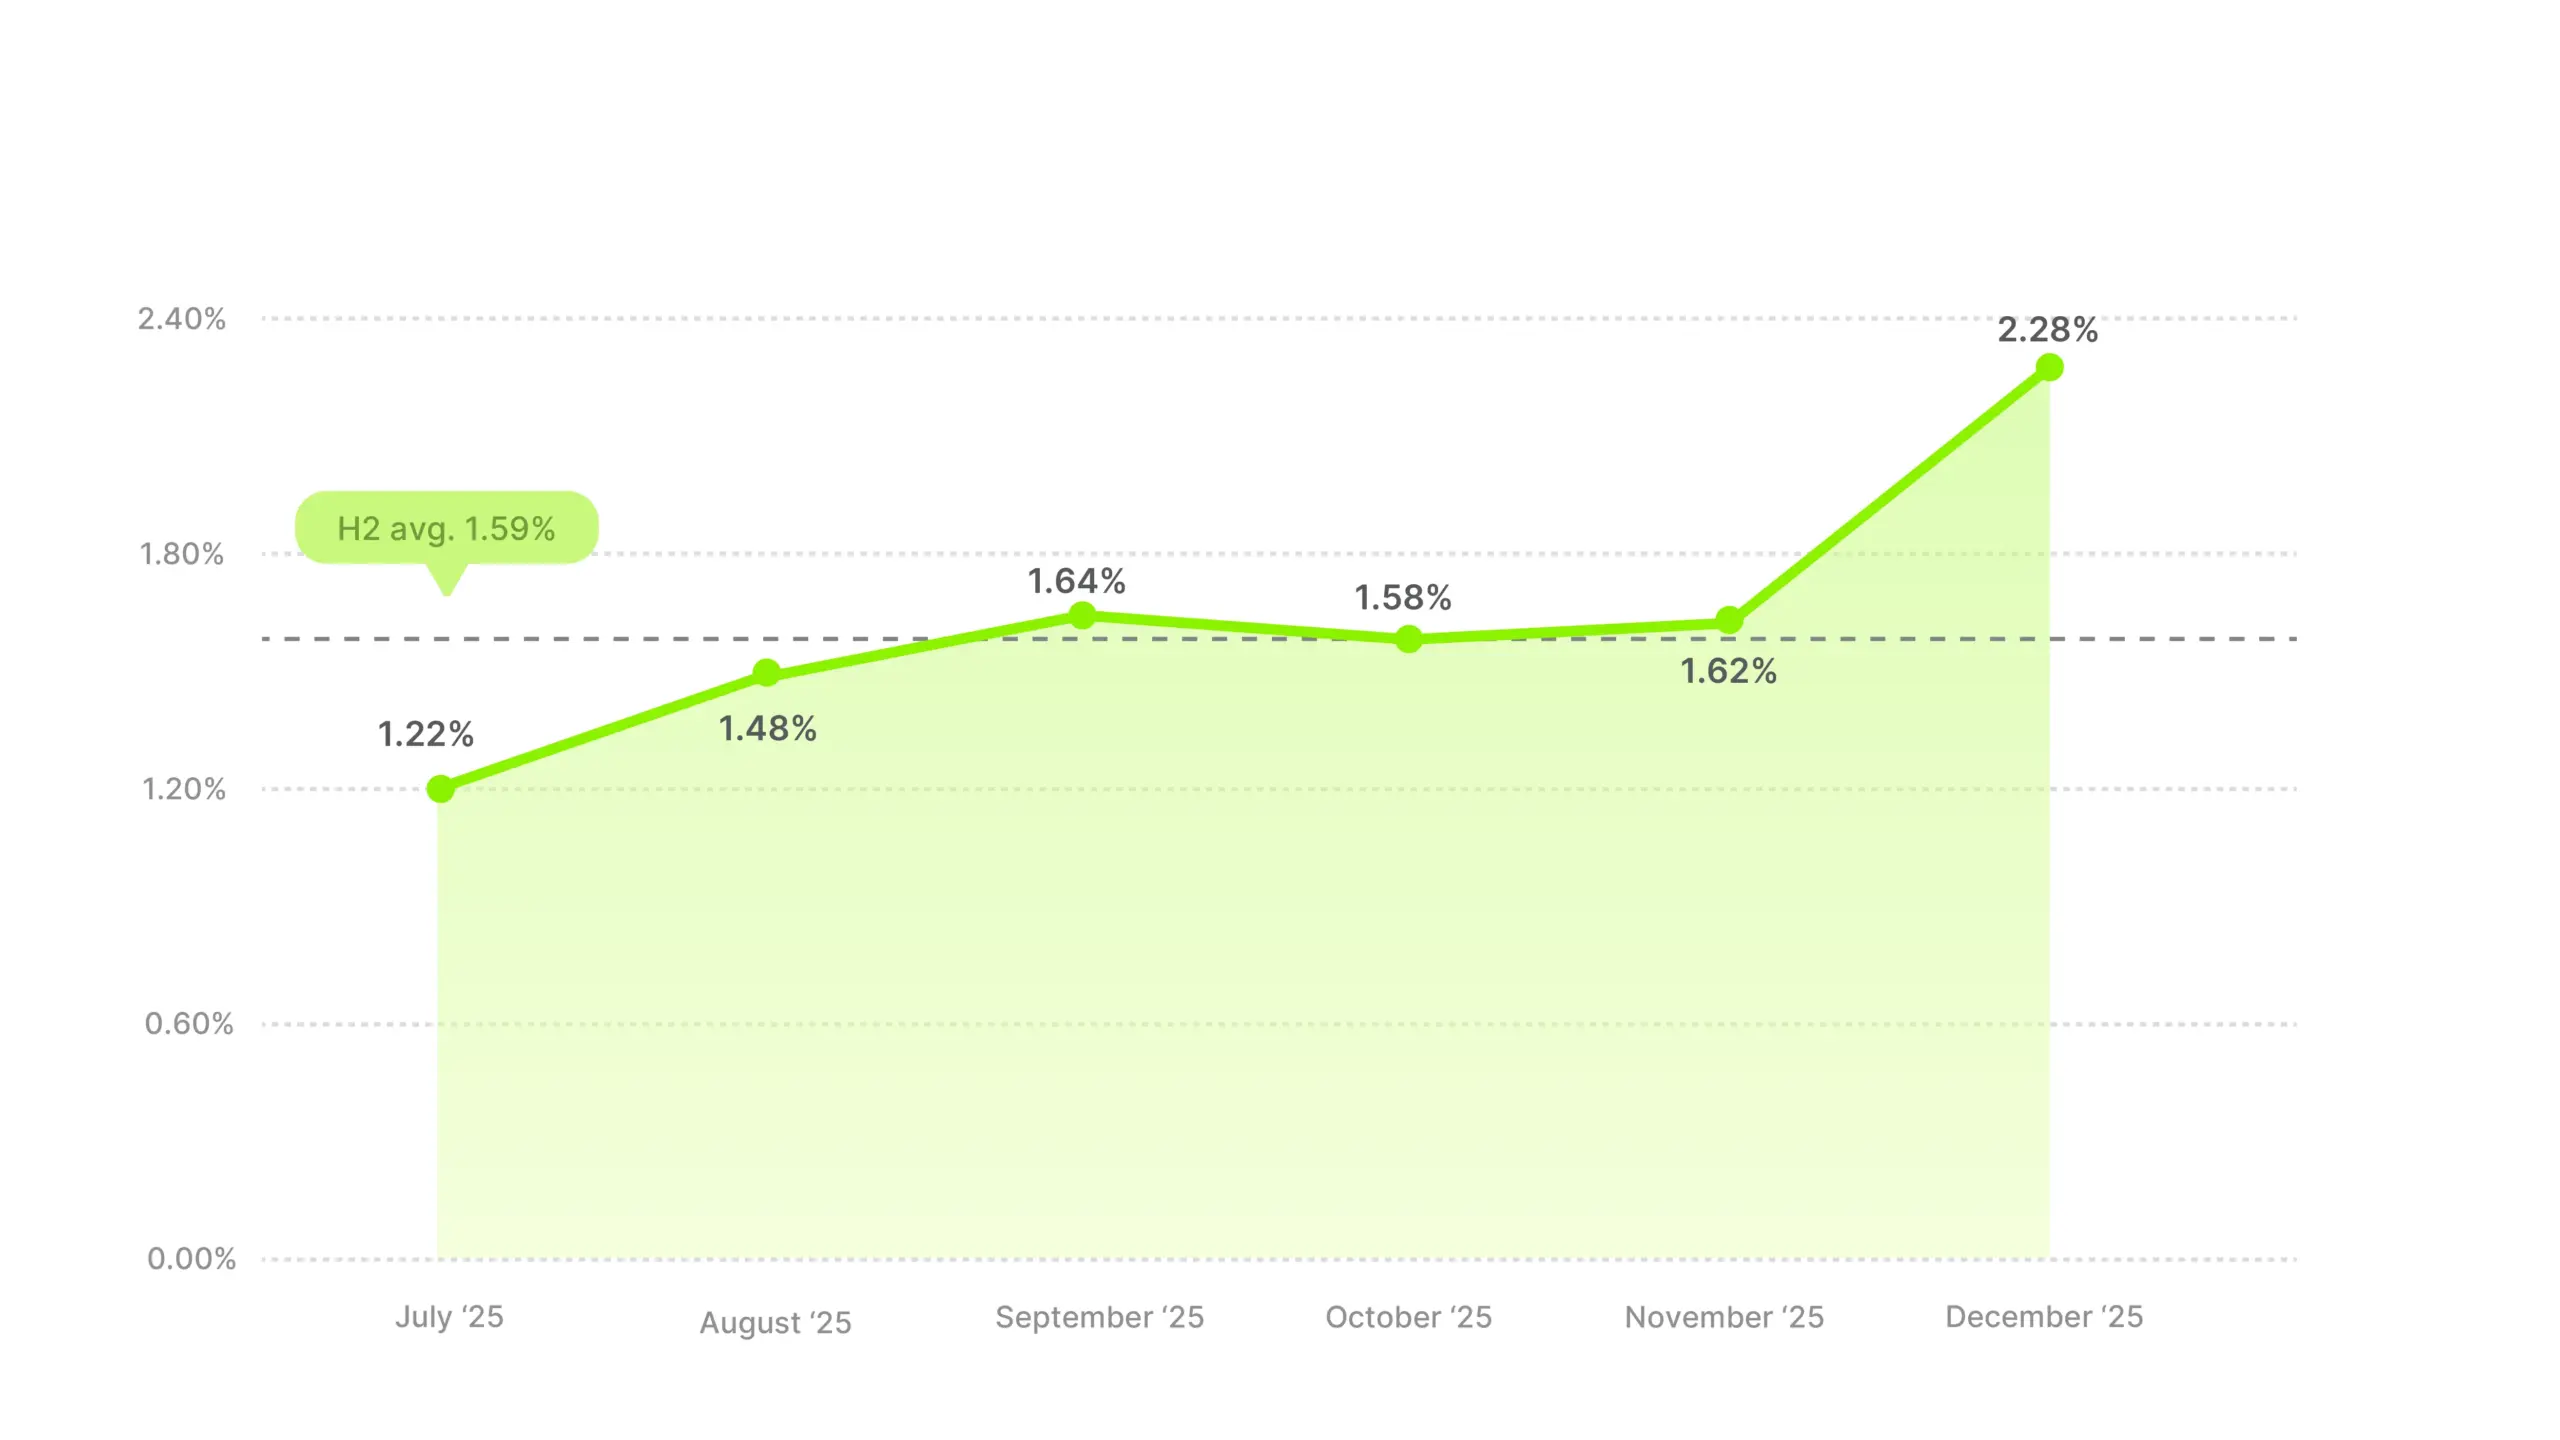
September through November is essentially flat, staying around the average after the early-H2 climb. Then December breaks out with a 1.62% to 2.28%, a +0.66 pp jump in a single month. That’s the most dramatic move in any category across the entire dataset.
The December spike most likely reflects end-of-year budget spending. Software purchasing often follows budget cycles, with teams rushing to use remaining annual budgets before they reset. Annual subscription renewals, new tool purchases for the new year, end-of-year SaaS deals. The same dynamic appeared in Business & Industrial’s November peak, but it’s much more pronounced here.
If you’re a software brand, December is your window. Plan your heaviest video spend around it. And if you also read our hook rate data, you’ll remember that Software’s hook rate was also improving through Q4. Both metrics pointing in the same direction means Q4 is when your video ads work hardest across the full funnel.
Sporting Goods posted a 1.47% CTR, below the overall average, with one of the flattest patterns in the dataset. Only 0.26 pp of spread across six months, no meaningful trend in either direction, and no real Q4 lift.
Industry CTR average
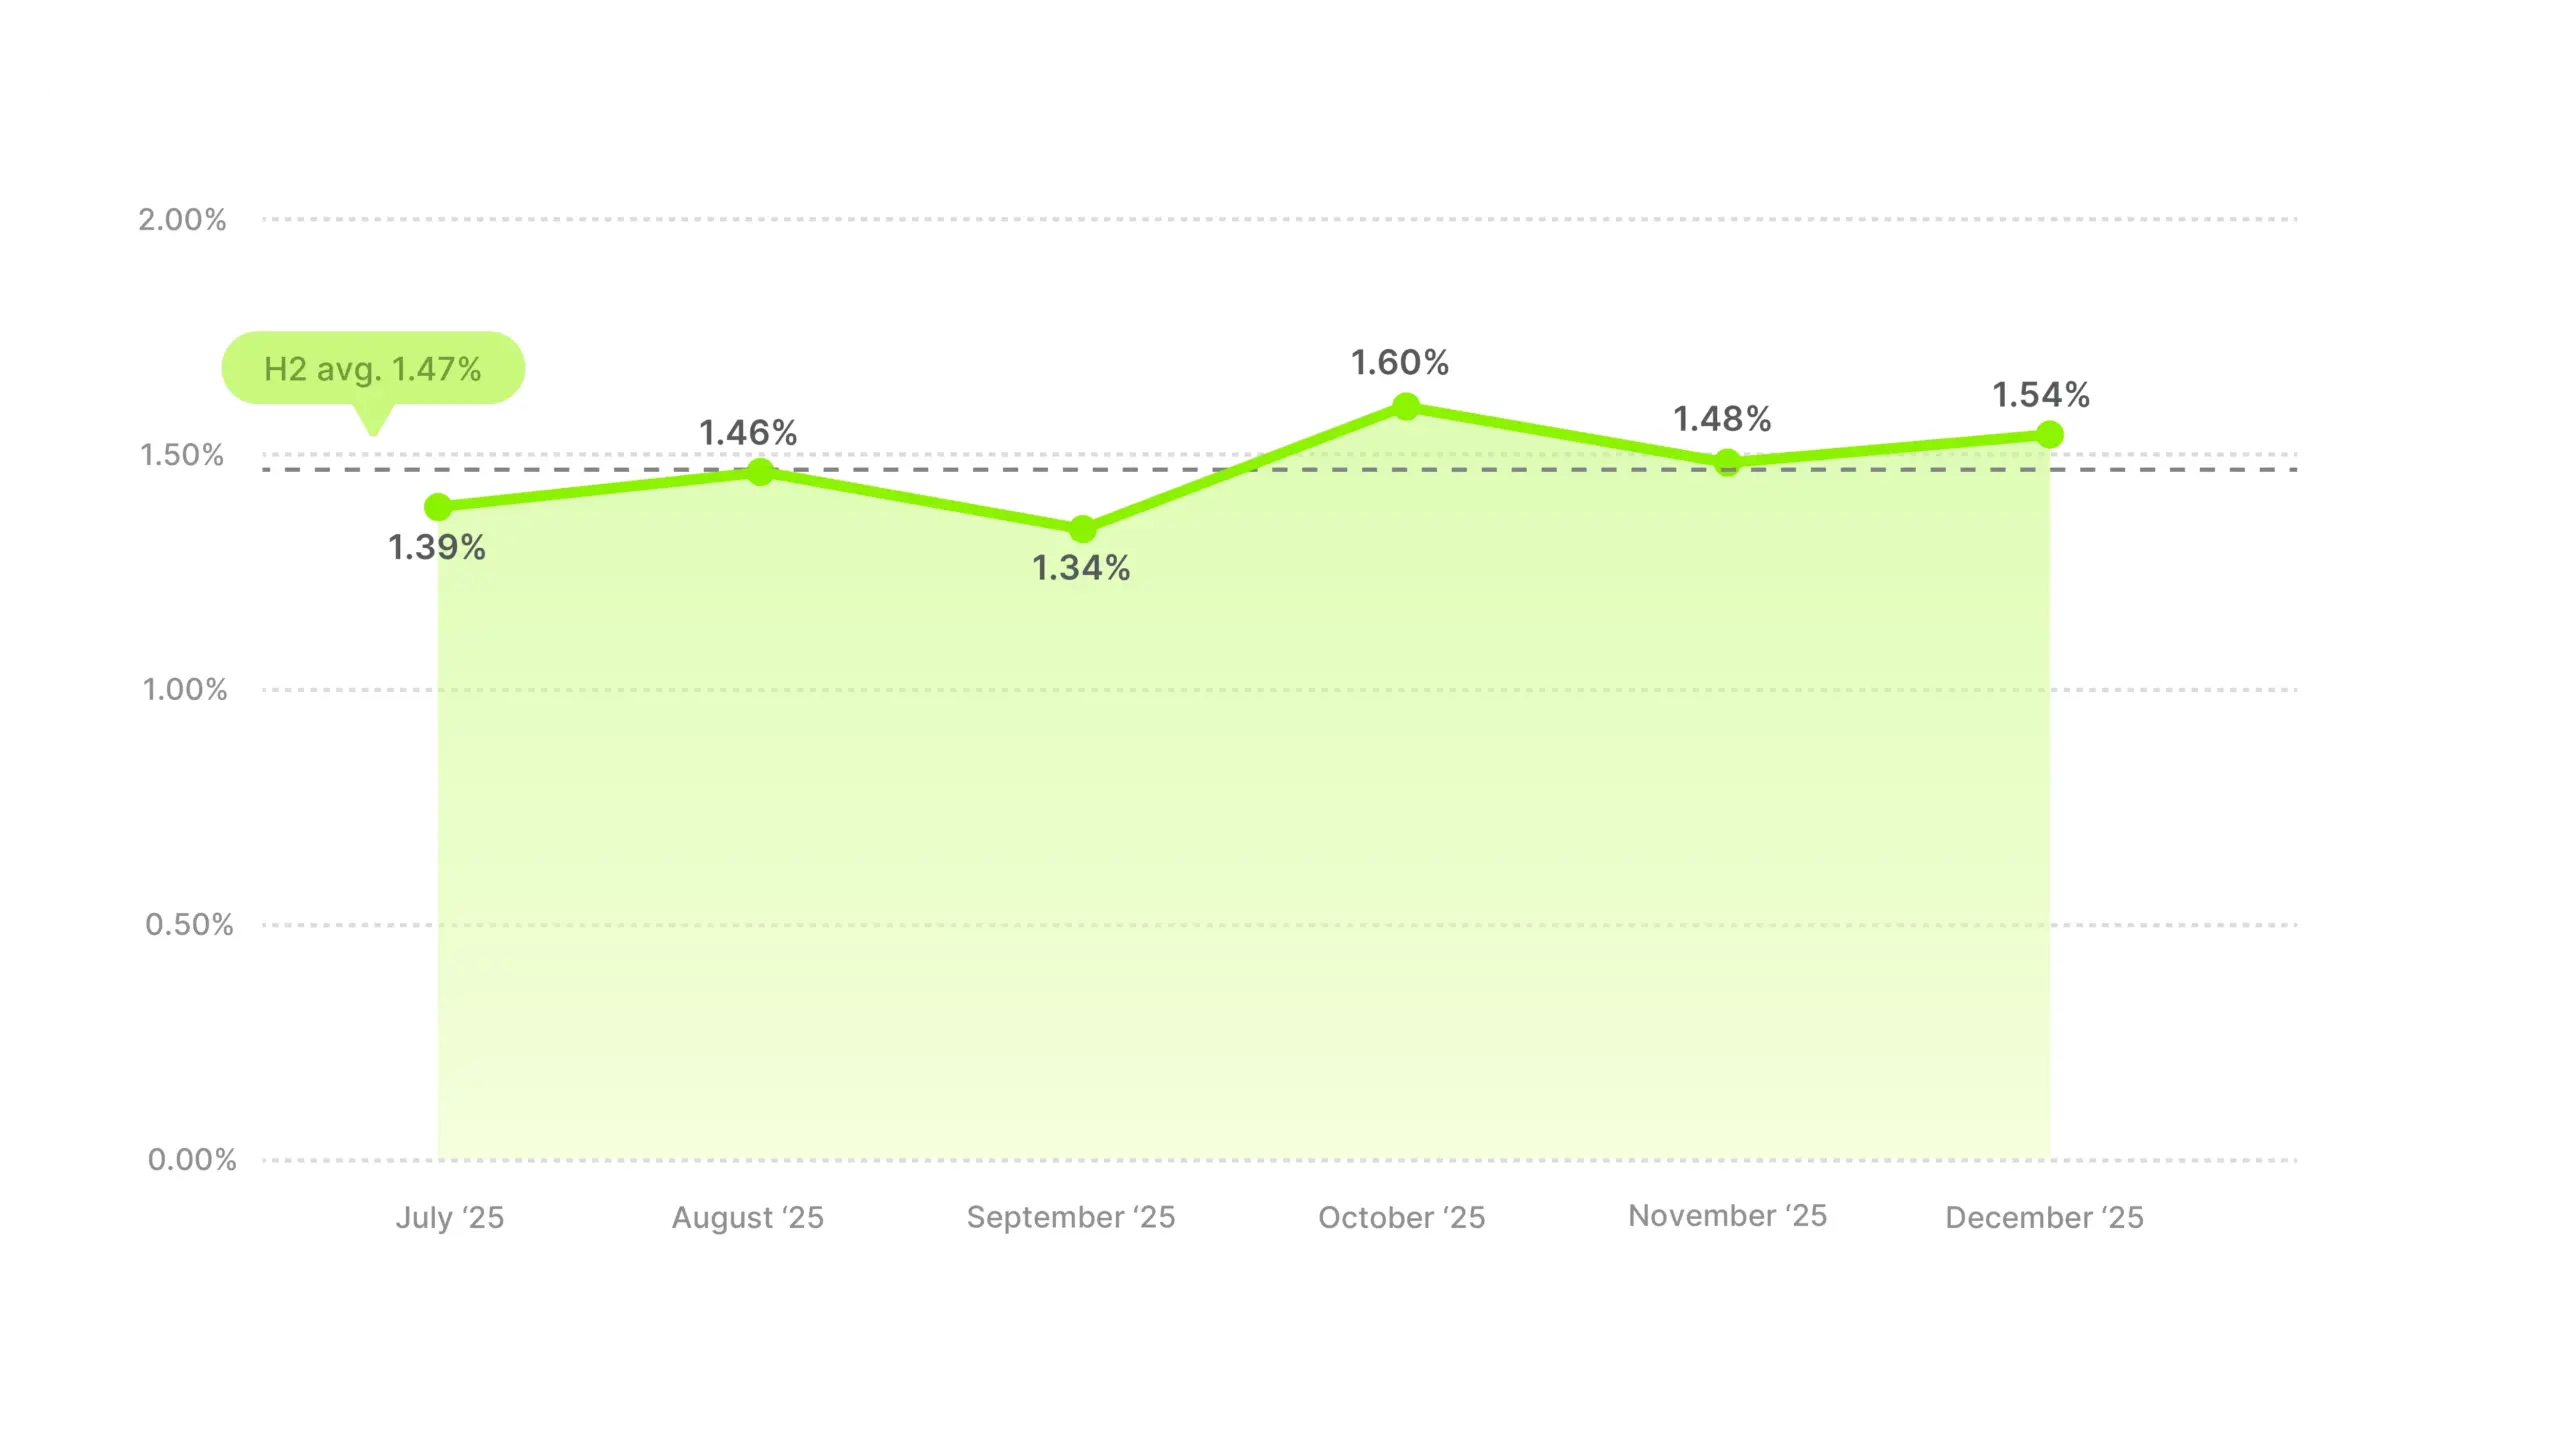
October’s 1.60% is the peak, barely above the category average, and it doesn’t hold. Unlike most categories, there’s no November or December surge. The pattern mirrors what we saw in hook rates for this category, flat, below average, no seasonal pattern to exploit or avoid.
Sporting Goods is a category where CTR improvements are a creative challenge, not a timing one. Your benchmark is 1.47% regardless of month, and no seasonal tailwind is coming to help. If you’re going to beat that number, it has to come from the creative itself.
Toys & Games had the second-lowest CTR at 1.30%, which is a striking contrast to its second-highest hook rate (28.23%). This category is great at capturing attention but struggles to convert it into clicks. The disconnect between hook performance and CTR is the widest of any category in the dataset.
Industry CTR average
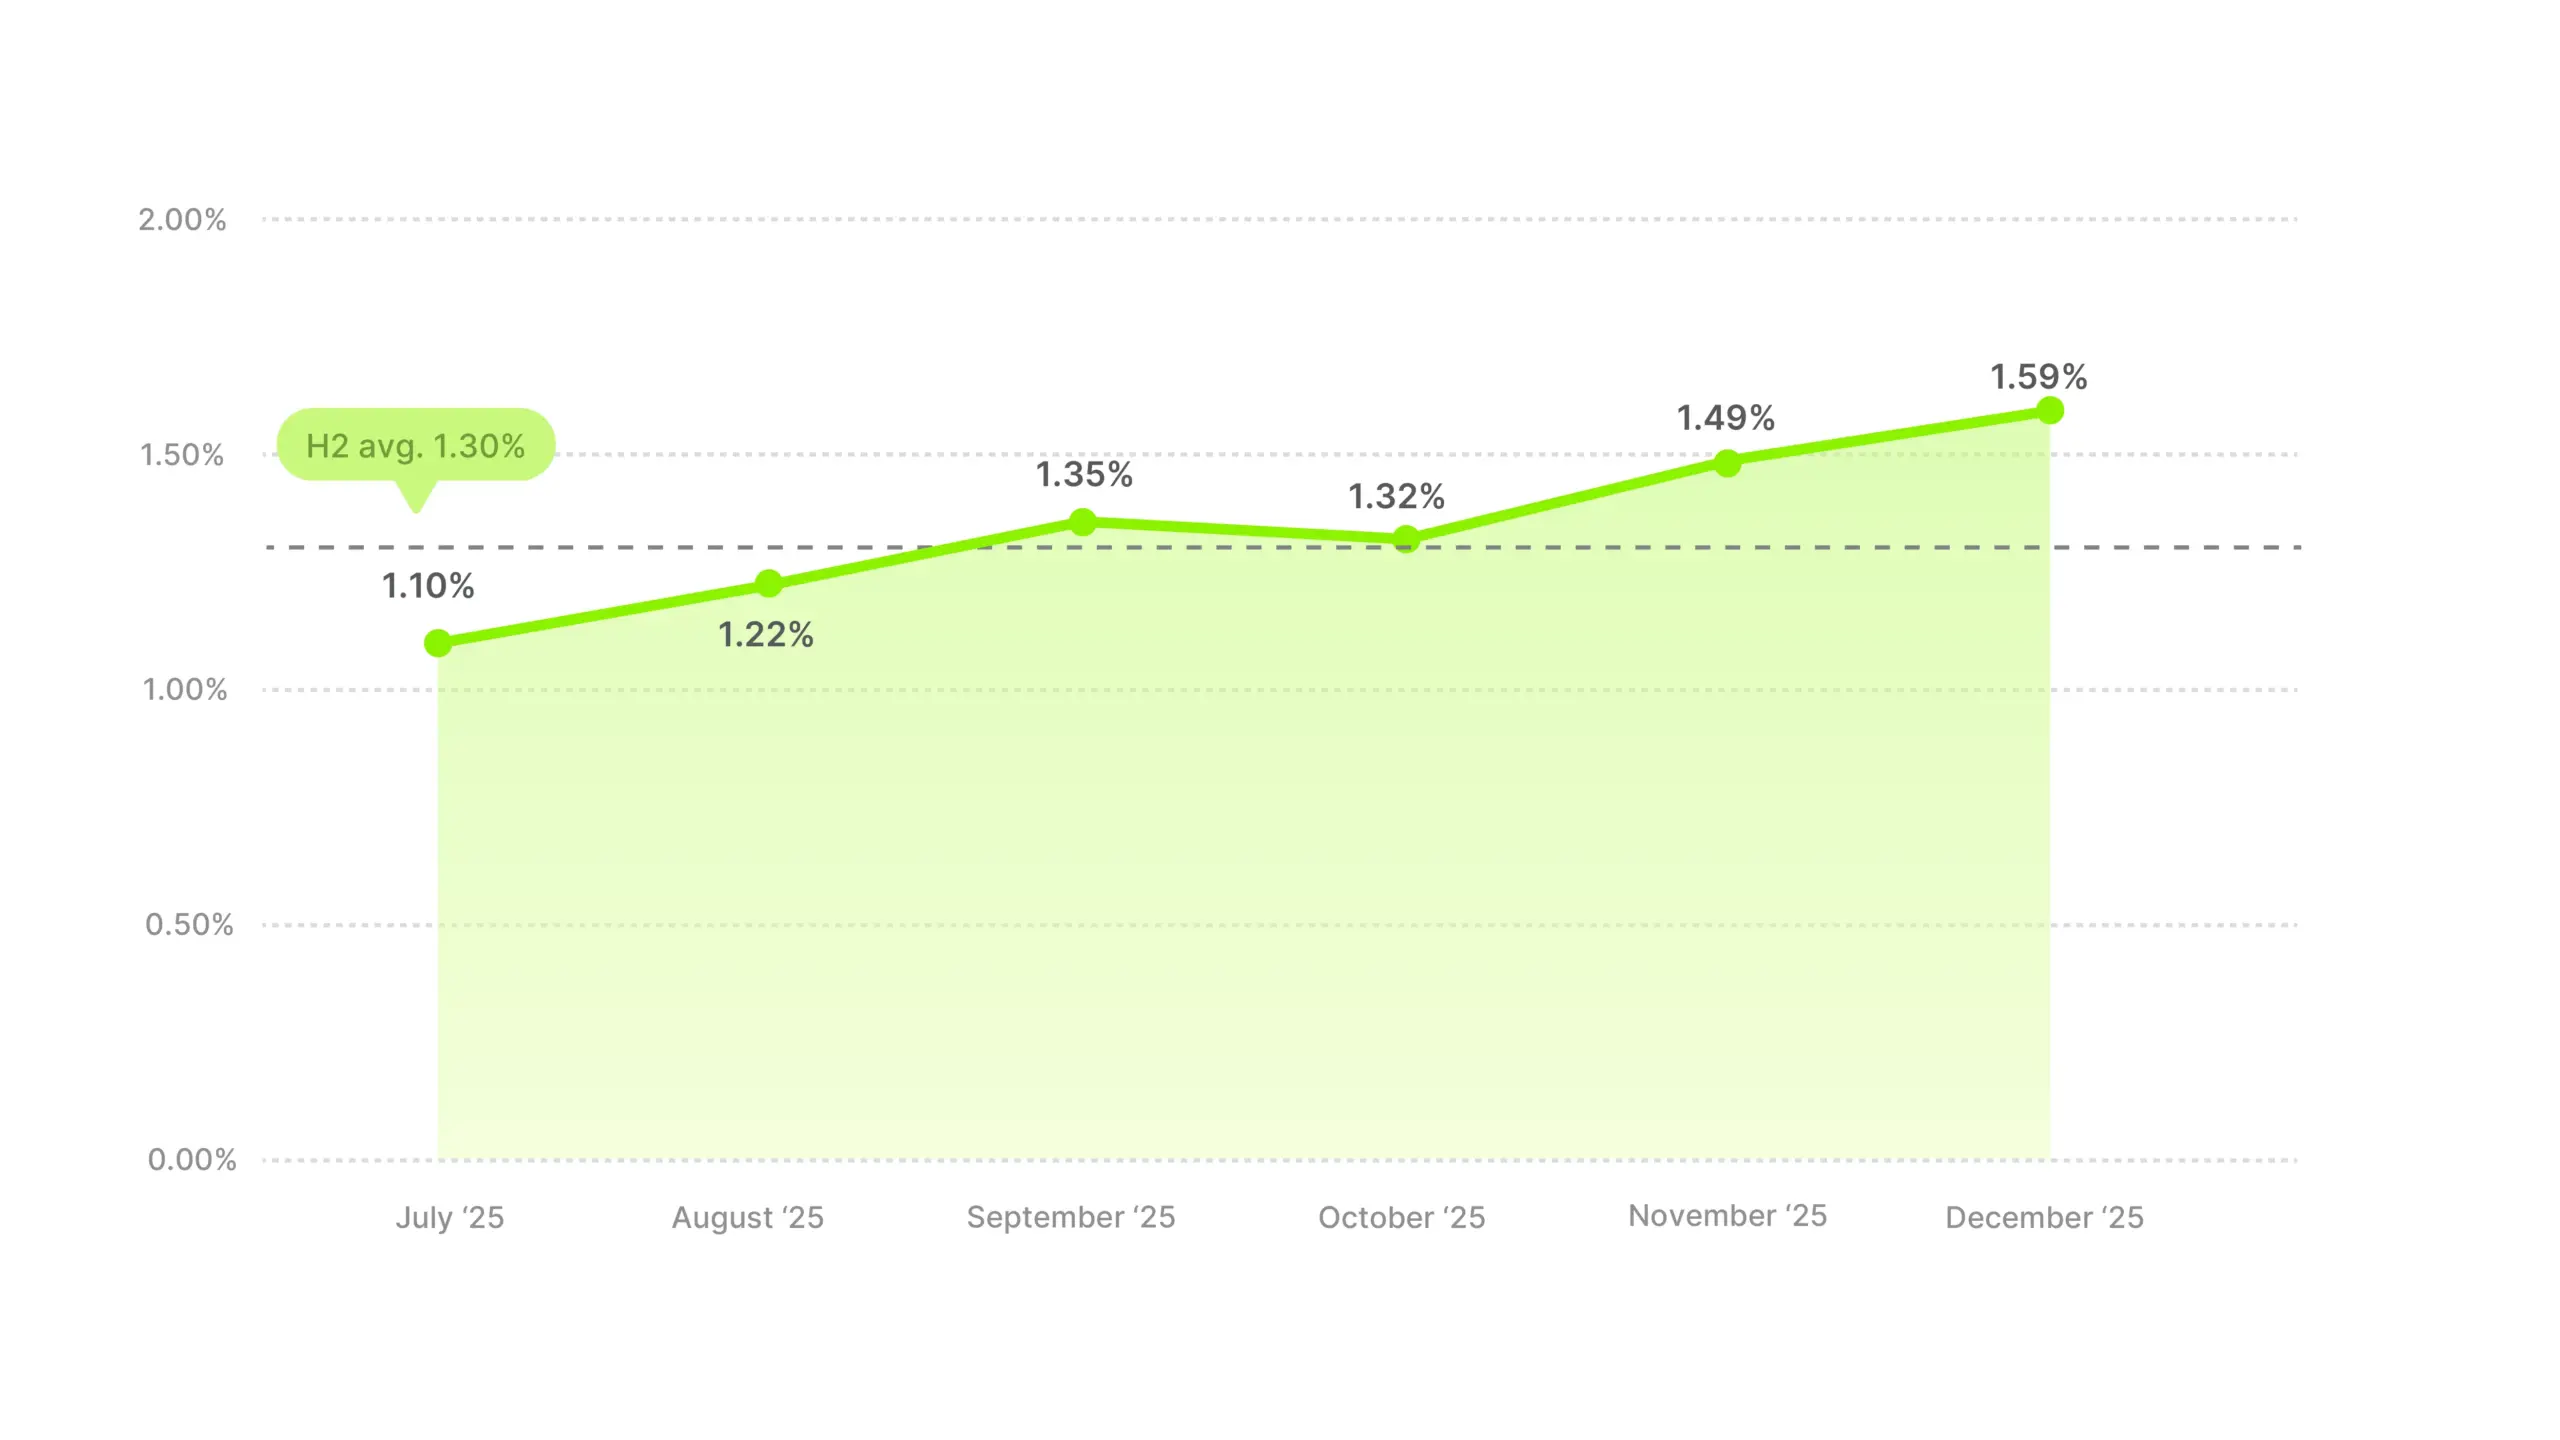
There is a clear upward trend, climbing from 1.10% in July to 1.59% in December. December actually lands above the overall H2 average of 1.56%, so a category that looks weak on the full-half number finishes strong.
This is a classic gifting category and the data shows it. The steady climb into November and December aligns with gift shopping ramping up. The H2 average of 1.30% is dragged down by weak summer months when there’s less reason to click through to buy toys outside of birthdays.
If you’re in Toys & Games, the high hook rate means your opening creative is working. The CTR gap suggests the problem is what happens after the hook, because the mid-video content or the CTA isn’t converting attention into action. That’s a different creative fix than most categories need.
The “Other” category aggregates industries that don’t fit neatly into the named verticals. At 1.58%, it sits slightly above the overall average, but as a blend of unrelated industries, the number works as a reference point rather than a competitive benchmark.
Industry CTR average
The first four months are the flattest of any category, with August through October showing just 0.02 pp of movement. The only real move is the November jump of +0.21 pp, and the rest is noise. Same pattern we saw with hook rates for this category. When you blend enough different industries together, individual effects cancel out and you get something that tracks the market.
If your industry falls into this bucket, your real benchmark is your own historical CTR or the closest named category in this report.
Methodology
Data source: This analysis covers 80,069 Meta video ads that ran between July 1 and December 31, 2025.
Inclusion criteria: Video ads with a sales objective, reliable metrics, and more than 1,000 impressions.
CTR definition: Link clicks divided by impressions. It measures how effectively a video ad drives viewers to click through to your destination, whether that’s a product page, landing page, or other URL.
Industry classification: Ads were categorized into 14 industry verticals based on advertiser product category. “Other” aggregates industries with insufficient volume for standalone analysis. Vehicles & Parts was excluded due to insufficient sample size.
A note on interpretation: The performance metrics in this report reflect historical advertising data and are provided for benchmarking purposes. They should not be interpreted as a guarantee or prediction of future ad performance. Categories with smaller sample sizes (Baby & Toddler, Software, Services, Electronics) are more susceptible to individual-advertiser effects on the average.