Video Ad Performance Metrics Demystified: Mastering CTR, CPA, CPM, CPC & KPIs
In 2025, digital video ad spend in the U.S. is projected to hit $72 billion, rising 14% from 2024 and growing two to three times faster than total media. Digital video is also expected to capture nearly 60% of all U.S. TV/video ad spend, further accelerating its dominance over linear TV.
But high spend doesn’t guarantee high returns.
To succeed, marketers must go beyond gut instinct and ground every campaign in performance data. That means tracking the right metrics, analyzing creative inputs, and understanding what “good” really looks like, especially for UGC.
In this guide, we’ll break down the key ad performance metrics, how to track them, what they reveal about your campaigns, and how platforms like Billo help brands iterate smarter, faster, and with less guesswork.
TL;DR
Understanding Video Ad Performance on Social Media
Social video has officially overtaken linear TV. In 2025, digital video will account for nearly 60% of total U.S. TV/video ad spend, up from 52% in 2024 and just 29% in 2020 – marking a dramatic shift in how audiences engage with content and how brands allocate their budgets (IAB, 2025 Video Ad Spend Report).
Platforms like TikTok, YouTube, and CTV services are now the dominant ad channels, expected to absorb over $62.9 billion in U.S. ad spend this year alone. These environments demand mobile-first, creator-driven, and highly optimized creative.
That means analyzing paid ad performance isn’t optional, it’s foundational. From completion rate and watch time to click-through and conversion metrics, the stakes are high. Success comes from knowing how your video is performing in real time and optimizing quickly to match platform dynamics and viewer behavior.
Key Metrics for UGC Video Ad Performance
To effectively measure and optimize ad performance, marketers must master several key metrics. Let’s discuss performance based marketing stats in more details.
1. Click-through rate (CTR)
Click-through rate measures how well your ad compels viewers to take action. It’s calculated as:
CTR = (Clicks ÷ Impressions) × 100
In the world of UGC video ads, CTR offers a direct pulse on creative resonance. Are people intrigued enough to click?
Typical CTR benchmarks for video ads fall between 1 – 3%, though this varies by platform and audience (eMarketer). Ads with a strong hook, clear value prop, and native-feeling execution tend to outperform.
To improve ad performance, test different creator styles, messaging angles, and visual pacing. Even small shifts (like emphasizing a benefit earlier) can lift CTR significantly and signal a winning creative.
2. Cost-per-acquisition (CPA)
Cost-per-acquisition reveals how efficiently your ad drives conversions. It’s calculated as:
CPA = Total Ad Spend ÷ Conversions
This metric is especially critical for performance marketers – it tells you how much you’re paying to get a customer to act. Top-performing UGC campaigns often aim for CPAs that are 20 – 30% lower than industry averages, signaling not just creative resonance, but true funnel efficiency.
To drive down CPA, focus on alignment across your ad creative, offer, and landing page. UGC that reflects real use cases and social proof tends to convert more affordably, especially when paired with high-relevance targeting and compelling CTAs.
3. Conversion rate
Conversion rate tracks how well your ad traffic turns into actual outcomes. Think signups, purchases, downloads. It’s calculated as:
Conversion Rate = (Conversions ÷ Clicks) × 100
This metric uncovers the effectiveness of your post-click experience. A strong conversion rate typically signals tight alignment between your ad’s promise and your landing page’s delivery.
UGC videos that lead with authentic stories or product demos tend to create higher trust – boosting conversion rates. To optimize, look at which creator styles or hooks produce not just clicks, but meaningful actions. Then double down on what’s working.
4. Cost per thousand impressions (CPM)
Cost per thousand impressions is your go-to metric for measuring reach efficiency. It’s calculated as:
CPM = (Total Ad Cost ÷ Impressions) × 1,000
While CPM doesn’t directly measure engagement or ROI, it’s crucial for awareness campaigns and comparing costs across channels. A lower CPM means you’re getting your ad in front of more people for less This is ideal when your goal is visibility and brand recall.
When used alongside engagement metrics like watch time or video completion rate, CPM helps you balance scale with performance, especially in paid social and CTV placements.
5. Cost-per-click (CPC)
Cost-per-click measures how much you’re paying for each user interaction. It’s calculated as:
CPC = Total Ad Spend ÷ Clicks
This metric is essential for managing paid social and search budgets, especially when optimizing for engagement or traffic. For video ads, CPC typically ranges from $0.05 to $0.30, depending on targeting, platform, and creative quality (eMarketer).
To lower CPC, refine your targeting and creative. UGC ads with relatable creators, snappy visuals, and platform-native tone often outperform because they feel organic – earning clicks more cost-effectively.
Inputs to Track for UGC Video Ad Success
Tracking metrics alone isn’t enough. To truly improve ad performance, brands must analyze the creative variables behind the results.
Start with creative inputs: hook style, video length, creator identity, and messaging framework. These elements shape viewer behavior. Strong hooks and authentic storytelling often lead to better engagement and retention.
Then, monitor engagement and attention metrics like watch time, completion rate, and shares. These indicators highlight where viewers drop off or stay engaged. Pinpointing which creatives spark authentic interest beyond the surface-level metrics.
By layering creative analysis on top of performance data, brands can iterate smarter and produce UGC that consistently drives results.
Defining Success: What “Good” Looks Like for UGC Video Ads
Success in UGC advertising isn’t just about hitting benchmarks. It’s about knowing which signals matter most.
Start with engagement signals. High likes, comments, and shares indicate strong resonance. But deeper metrics like video completion rate (VCR) are more telling. A VCR of ≥70% suggests the creative is holding attention and delivering value through storytelling (eMarketer).
Then, layer in performance: above-industry CTR, a CPA below your benchmark, and a conversion rate that outpaces peers all point to efficient funnel performance. And don’t overlook the first few seconds – 90% of ad recall happens within the first six, and 66% of video ads are now under 30 seconds.
To win, you need scroll-stopping intros, strong mid-funnel messaging, and a clear path to action. All delivered through authentic creator content.
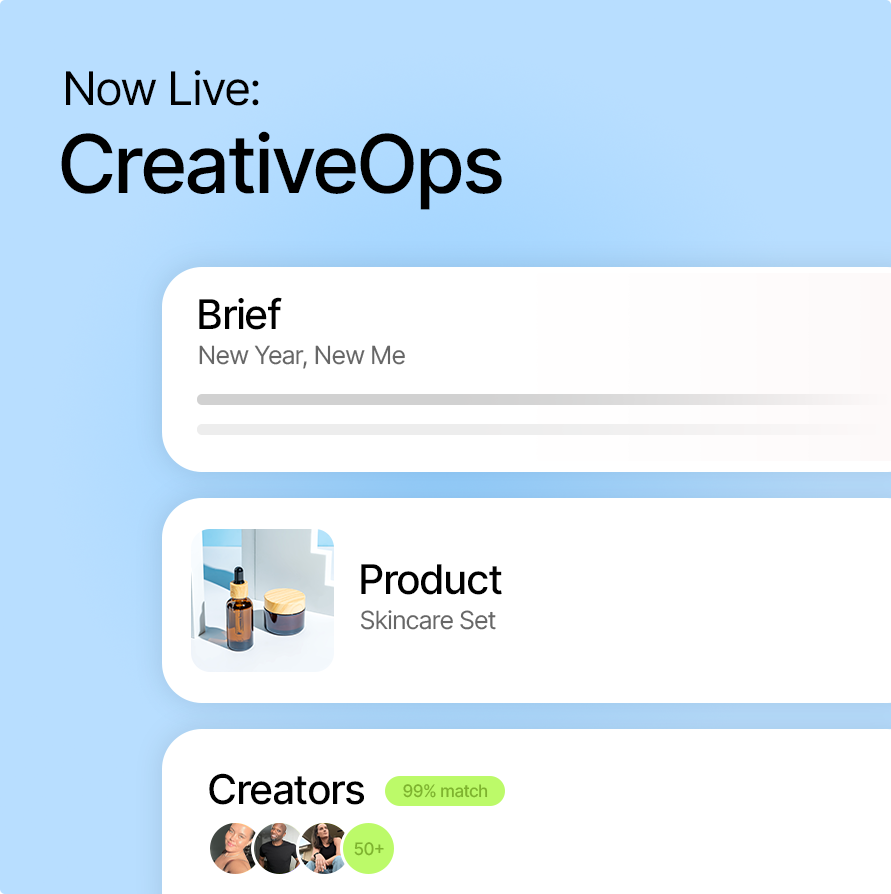
How Billo Empowers UGC Video Ad Performance Analysis
Optimizing UGC ad performance starts with the right tools – and that’s exactly what Billo delivers.
Billo’s Creative Performance Engine equips brands with real-time dashboards that surface critical metrics like ROAS, CTR, and hook rate. Plus creator-level insights to see who’s driving actual results. This makes rapid iteration easier than ever, helping you scale what’s working and cut what’s not.
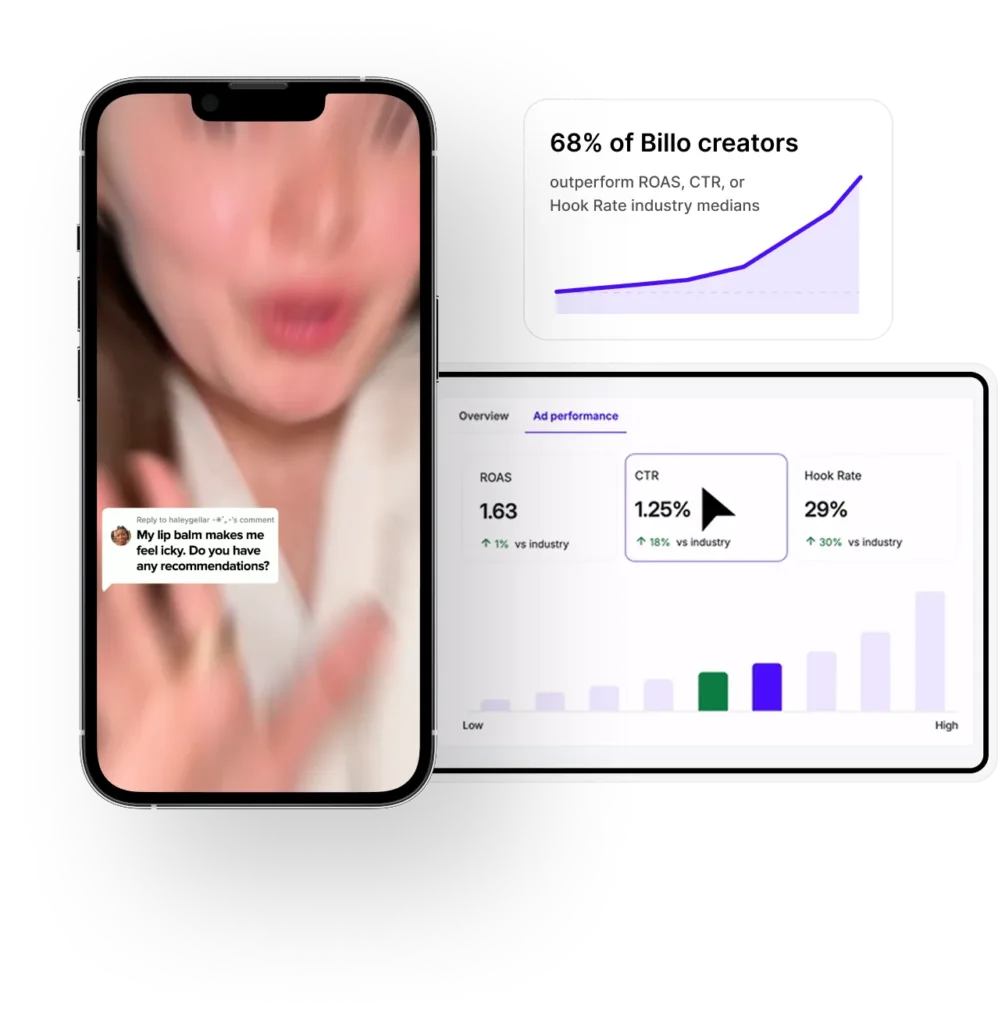
Explore how Billo helps brands make smarter creative decisions with its Creative Performance Engine and how UGC videos get optimized faster with data-powered video editing.
Summary & Next Steps
Winning with UGC video ads in 2025 means more than just creating content, it’s about mastering ad performance.
Track standardized metrics like CTR, CPA, CPM, and completion rate to benchmark success. Pair those with creative inputs, like hook style, video length, creator identity to learn what truly drives results. Then use that insight to iterate fast.
That’s where Billo gives you an edge. With real-time dashboards, creator-level analytics, and automated reporting, you can stop guessing and start scaling what works.
Ready to boost your UGC ad results? Explore Billo’s Performance Hub to get insights on your ads or browse more strategies in our guide to social media advertising.
FAQs
What completion rate should I aim for?
How often should I report on video ad performance?
Which metric matters most?
Can I compare metrics across platforms?
SEO Lead
Passionate content and search marketer aiming to bring great products front and center. When not hunched over my keyboard, you will find me in a city running a race, cycling or simply enjoying my life with a book in hand.
Make creator marketing a data-backed growth channel

Related from Creative Insider

The Creative Operations Setup Paid Social Actually Needs

How Many Ad Creatives Do You Need? 2026 Benchmarks for DTC Brands

“Creative Is the New Targeting” – But Only If You Structure It Right


