
What stood out
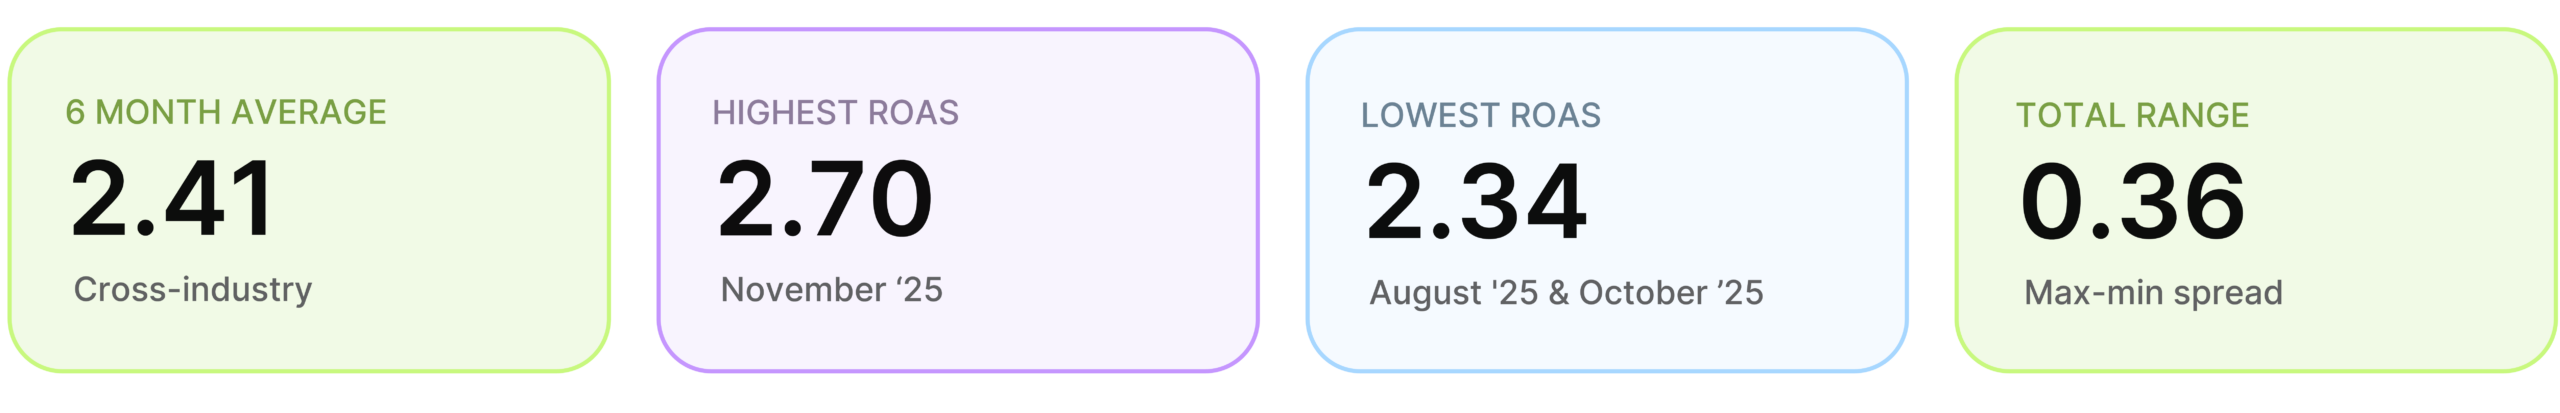
1. ROAS barely moved across the six months. The spread between the best month (November at 2.70) and the worst (August and October at 2.34) was 0.36. Video ads held a steady return across all six months.
2. Your category tells you more than the month does. Apparel averaged 4.11. Animals & Pet Supplies averaged 1.66. That 2.45 gap between top and bottom verticals is nearly seven times wider than the full month-to-month spread across H2. If you’re benchmarking against 2.41, the headline number is probably hiding more than it’s revealing.
3. Categories fall into three seasonal patterns. Q4 gifting verticals peak in November or December. Self-use and necessity verticals peak earlier. And Apparel runs its own pattern: ROAS declines through Q4 as brands scale aggressively, trading return per dollar for total revenue growth. “Plan for Q4” only helps if you know which pattern your category follows.
Overall ROAS trend, H2 2025
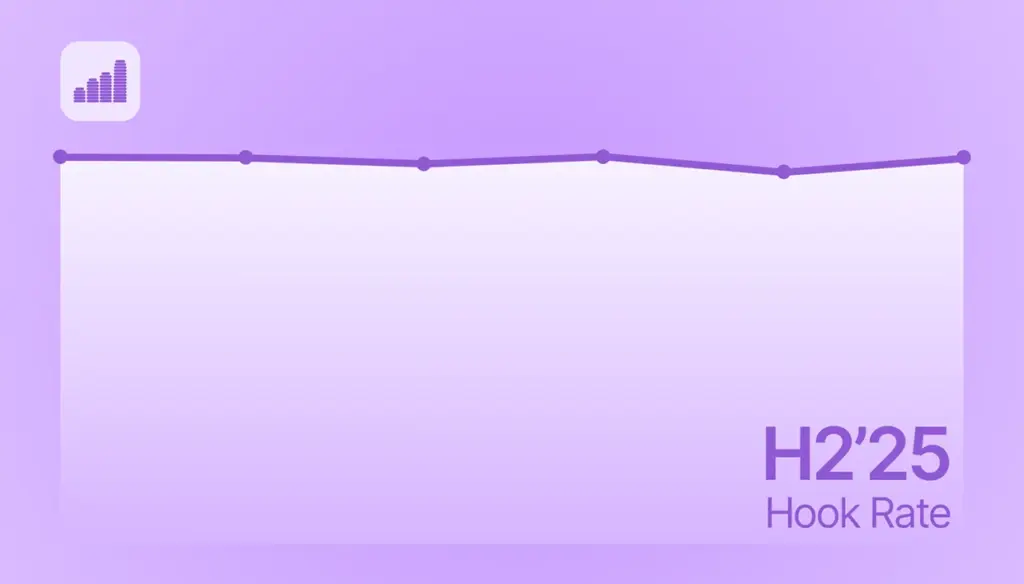
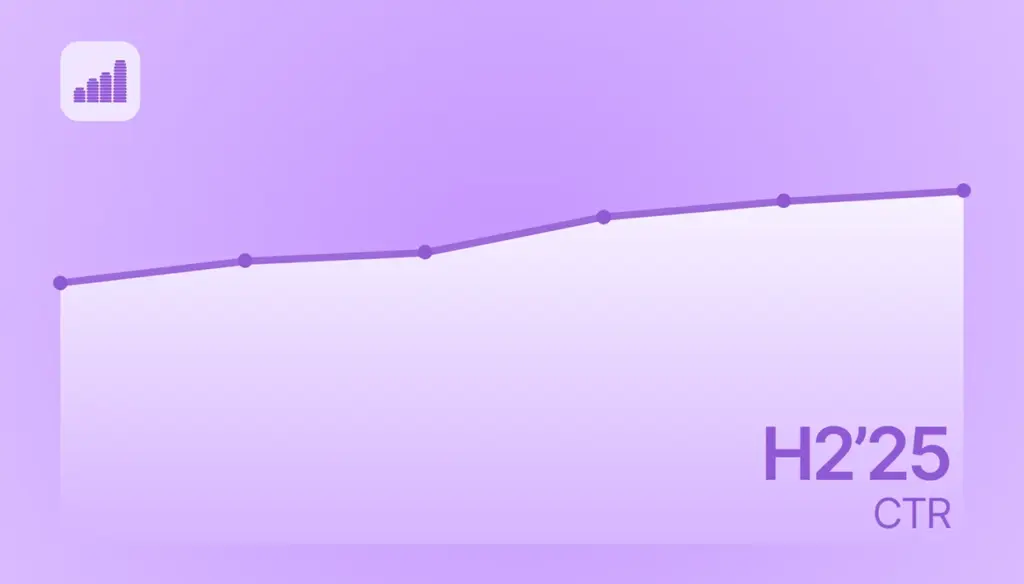
If our CTR data told a directional story (climbing every month) and hook rate held almost perfectly flat, ROAS sits somewhere between the two. The monthly average moved between 2.34 and 2.70 and never left that band. A spread of 0.36 across six months is tight for any metric, especially one that depends on the full funnel working together.
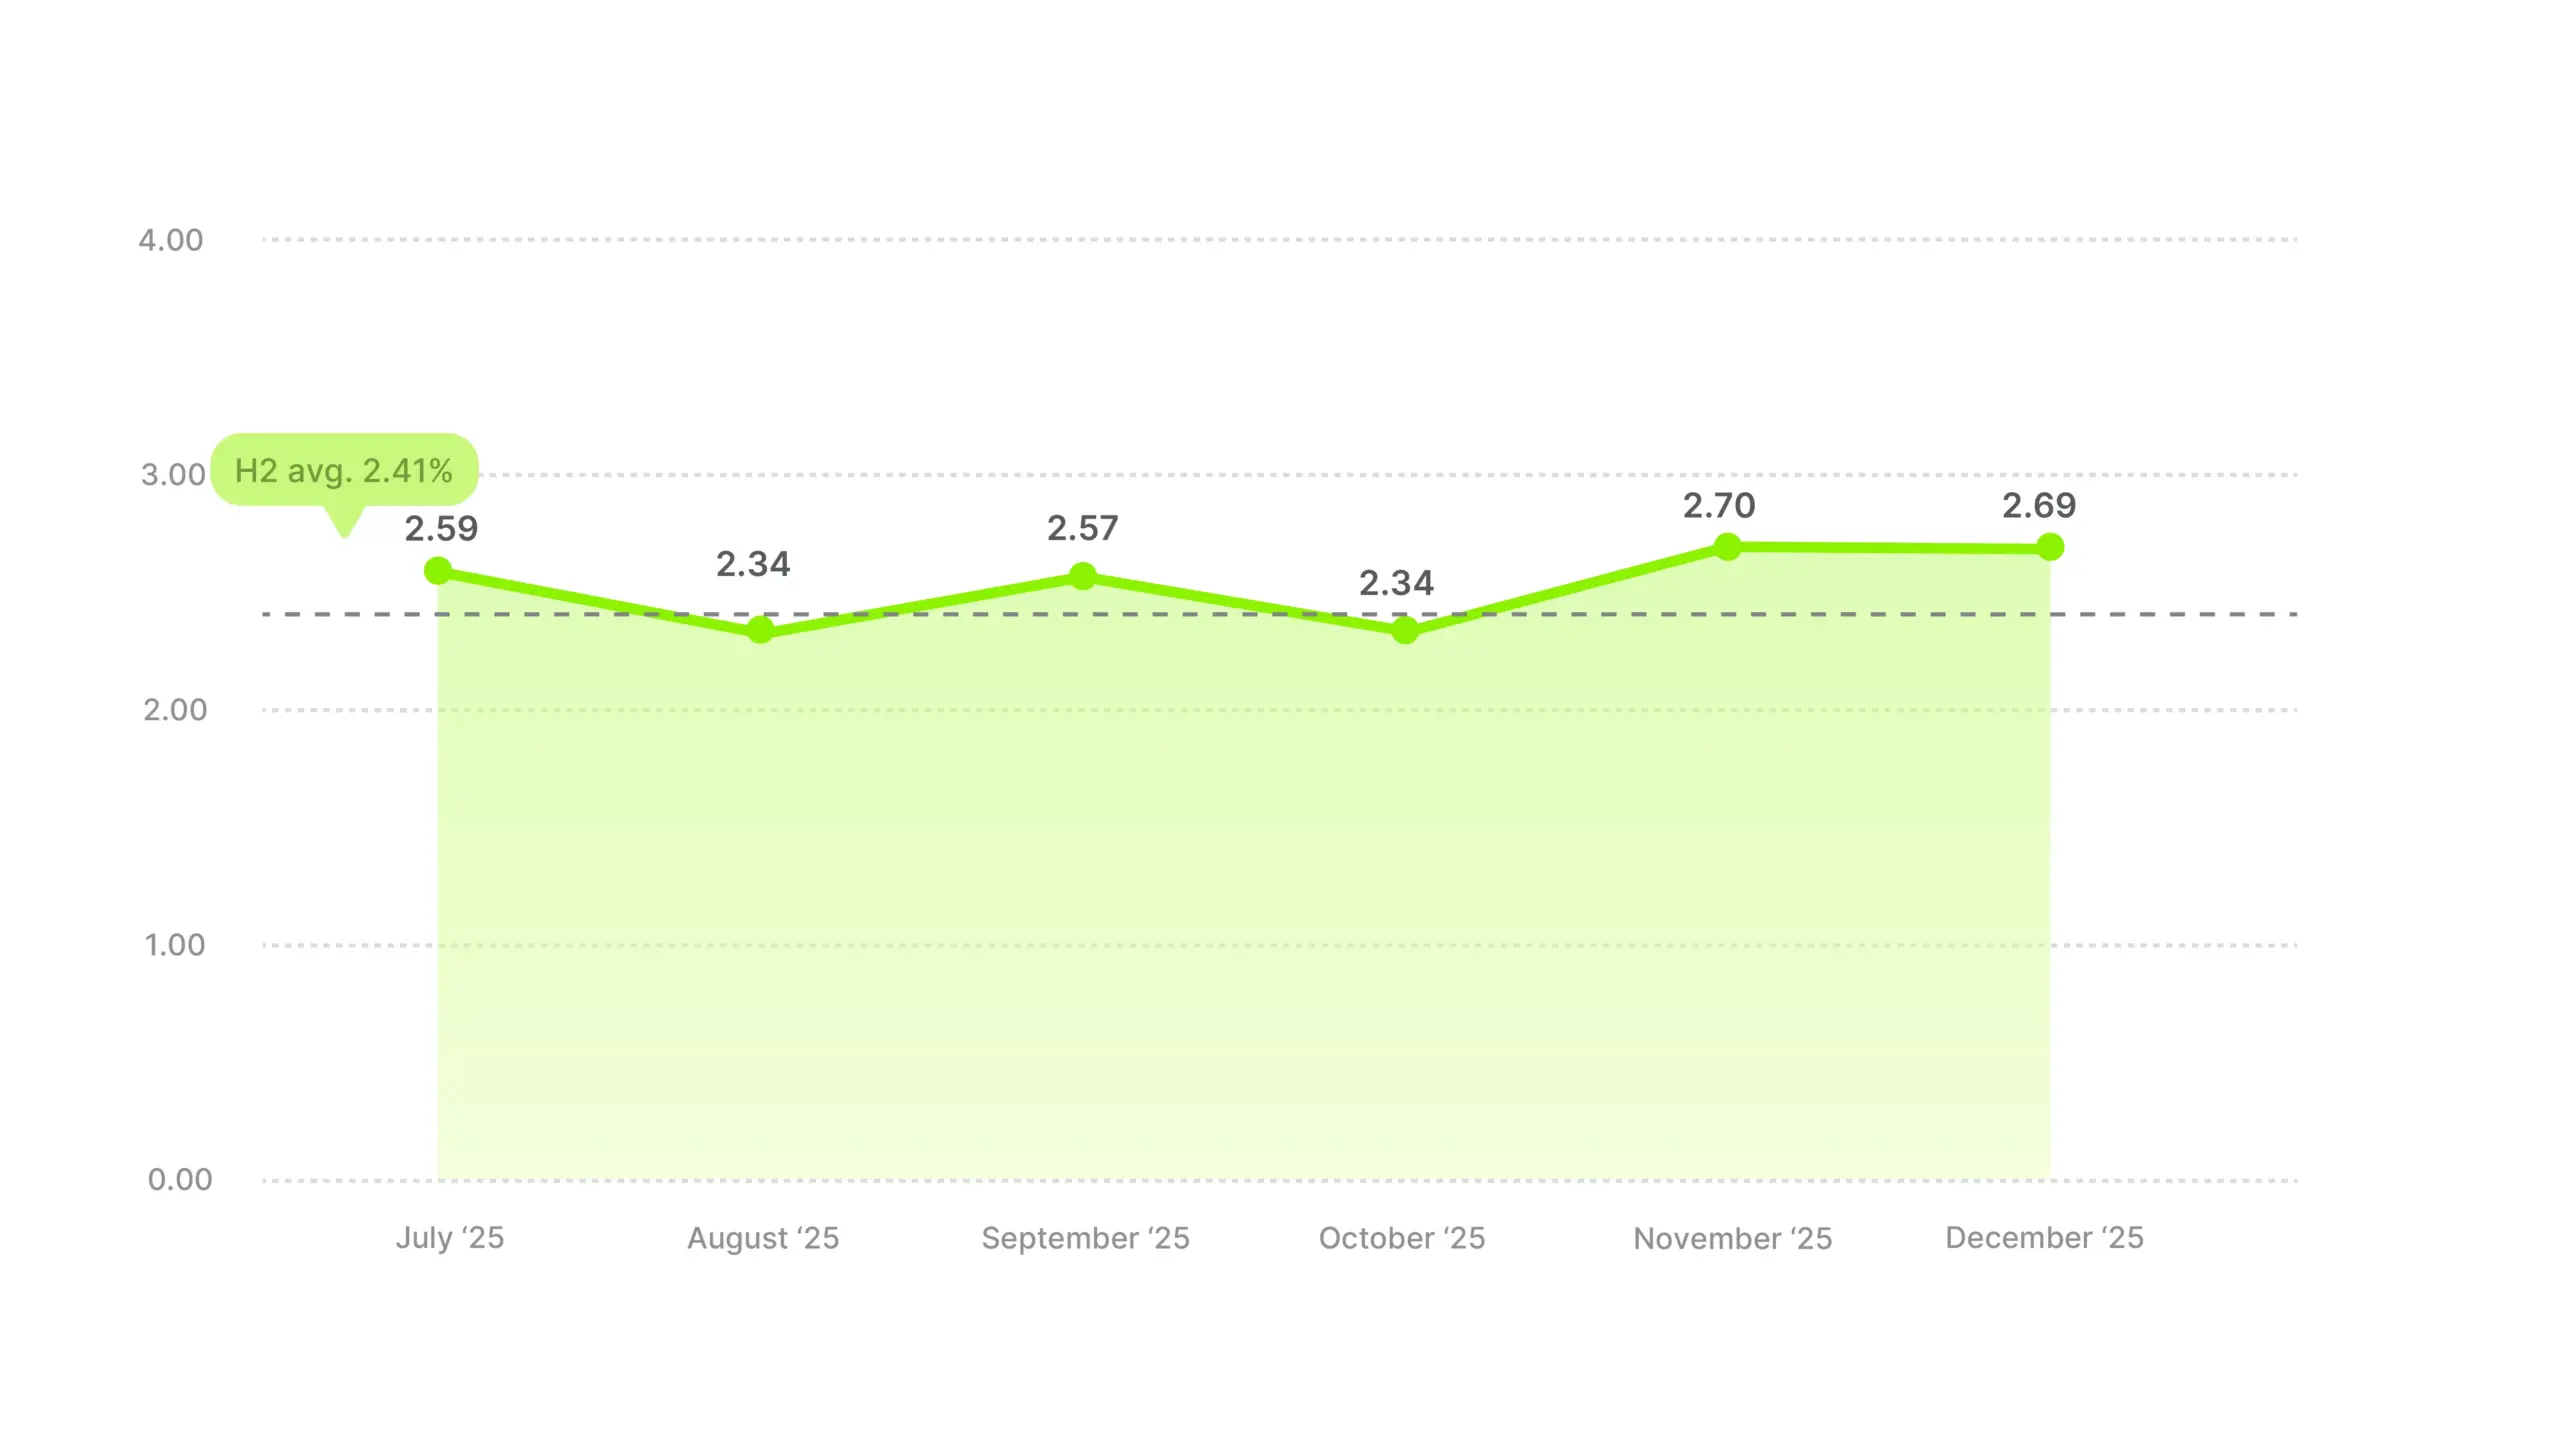
The monthly shape is a shallow zigzag. 2.59 in July, then a dip to 2.34 in August, a recovery to 2.57 in September, another drop to 2.34 in October, a peak at 2.70 in November, and 2.69 in December. Two dips, two peaks, nothing extreme in either direction.
The October dip is probably the most telling pattern in the whole dataset. It shows up not just in the cross-industry average, but across many individual categories too. The most likely driver is pre-Black Friday delay. Consumers see ads in October but hold off on purchases, waiting for November discounts. November’s jump to the H2 peak lines up neatly with that theory, because the same audiences likely convert once the deals begin.
November and December are the peak, but barely. 2.70 and 2.69 are almost identical. The Q4 lift exists at the aggregate level, but it isn’t dramatic. A more useful read might be that the two months played different roles. November looks like the efficiency peak, with return-per-dollar slightly higher. December looks like the scale peak, with higher total spend and ROAS holding close to November’s number rather than breaking past it.
Use 2.41 as your H2 2025 reference point, but read it through your category’s lens.
ROAS benchmarks by industry
The 2.41 cross-industry number hides a lot of variance. The top category (Apparel) ran 2.45 above the bottom (Animals & Pet Supplies). For context, the CTR spread across the same dataset was 0.64 pp, and the hook rate spread was 8.5 pp. No other metric we’ve measured has this much variation.
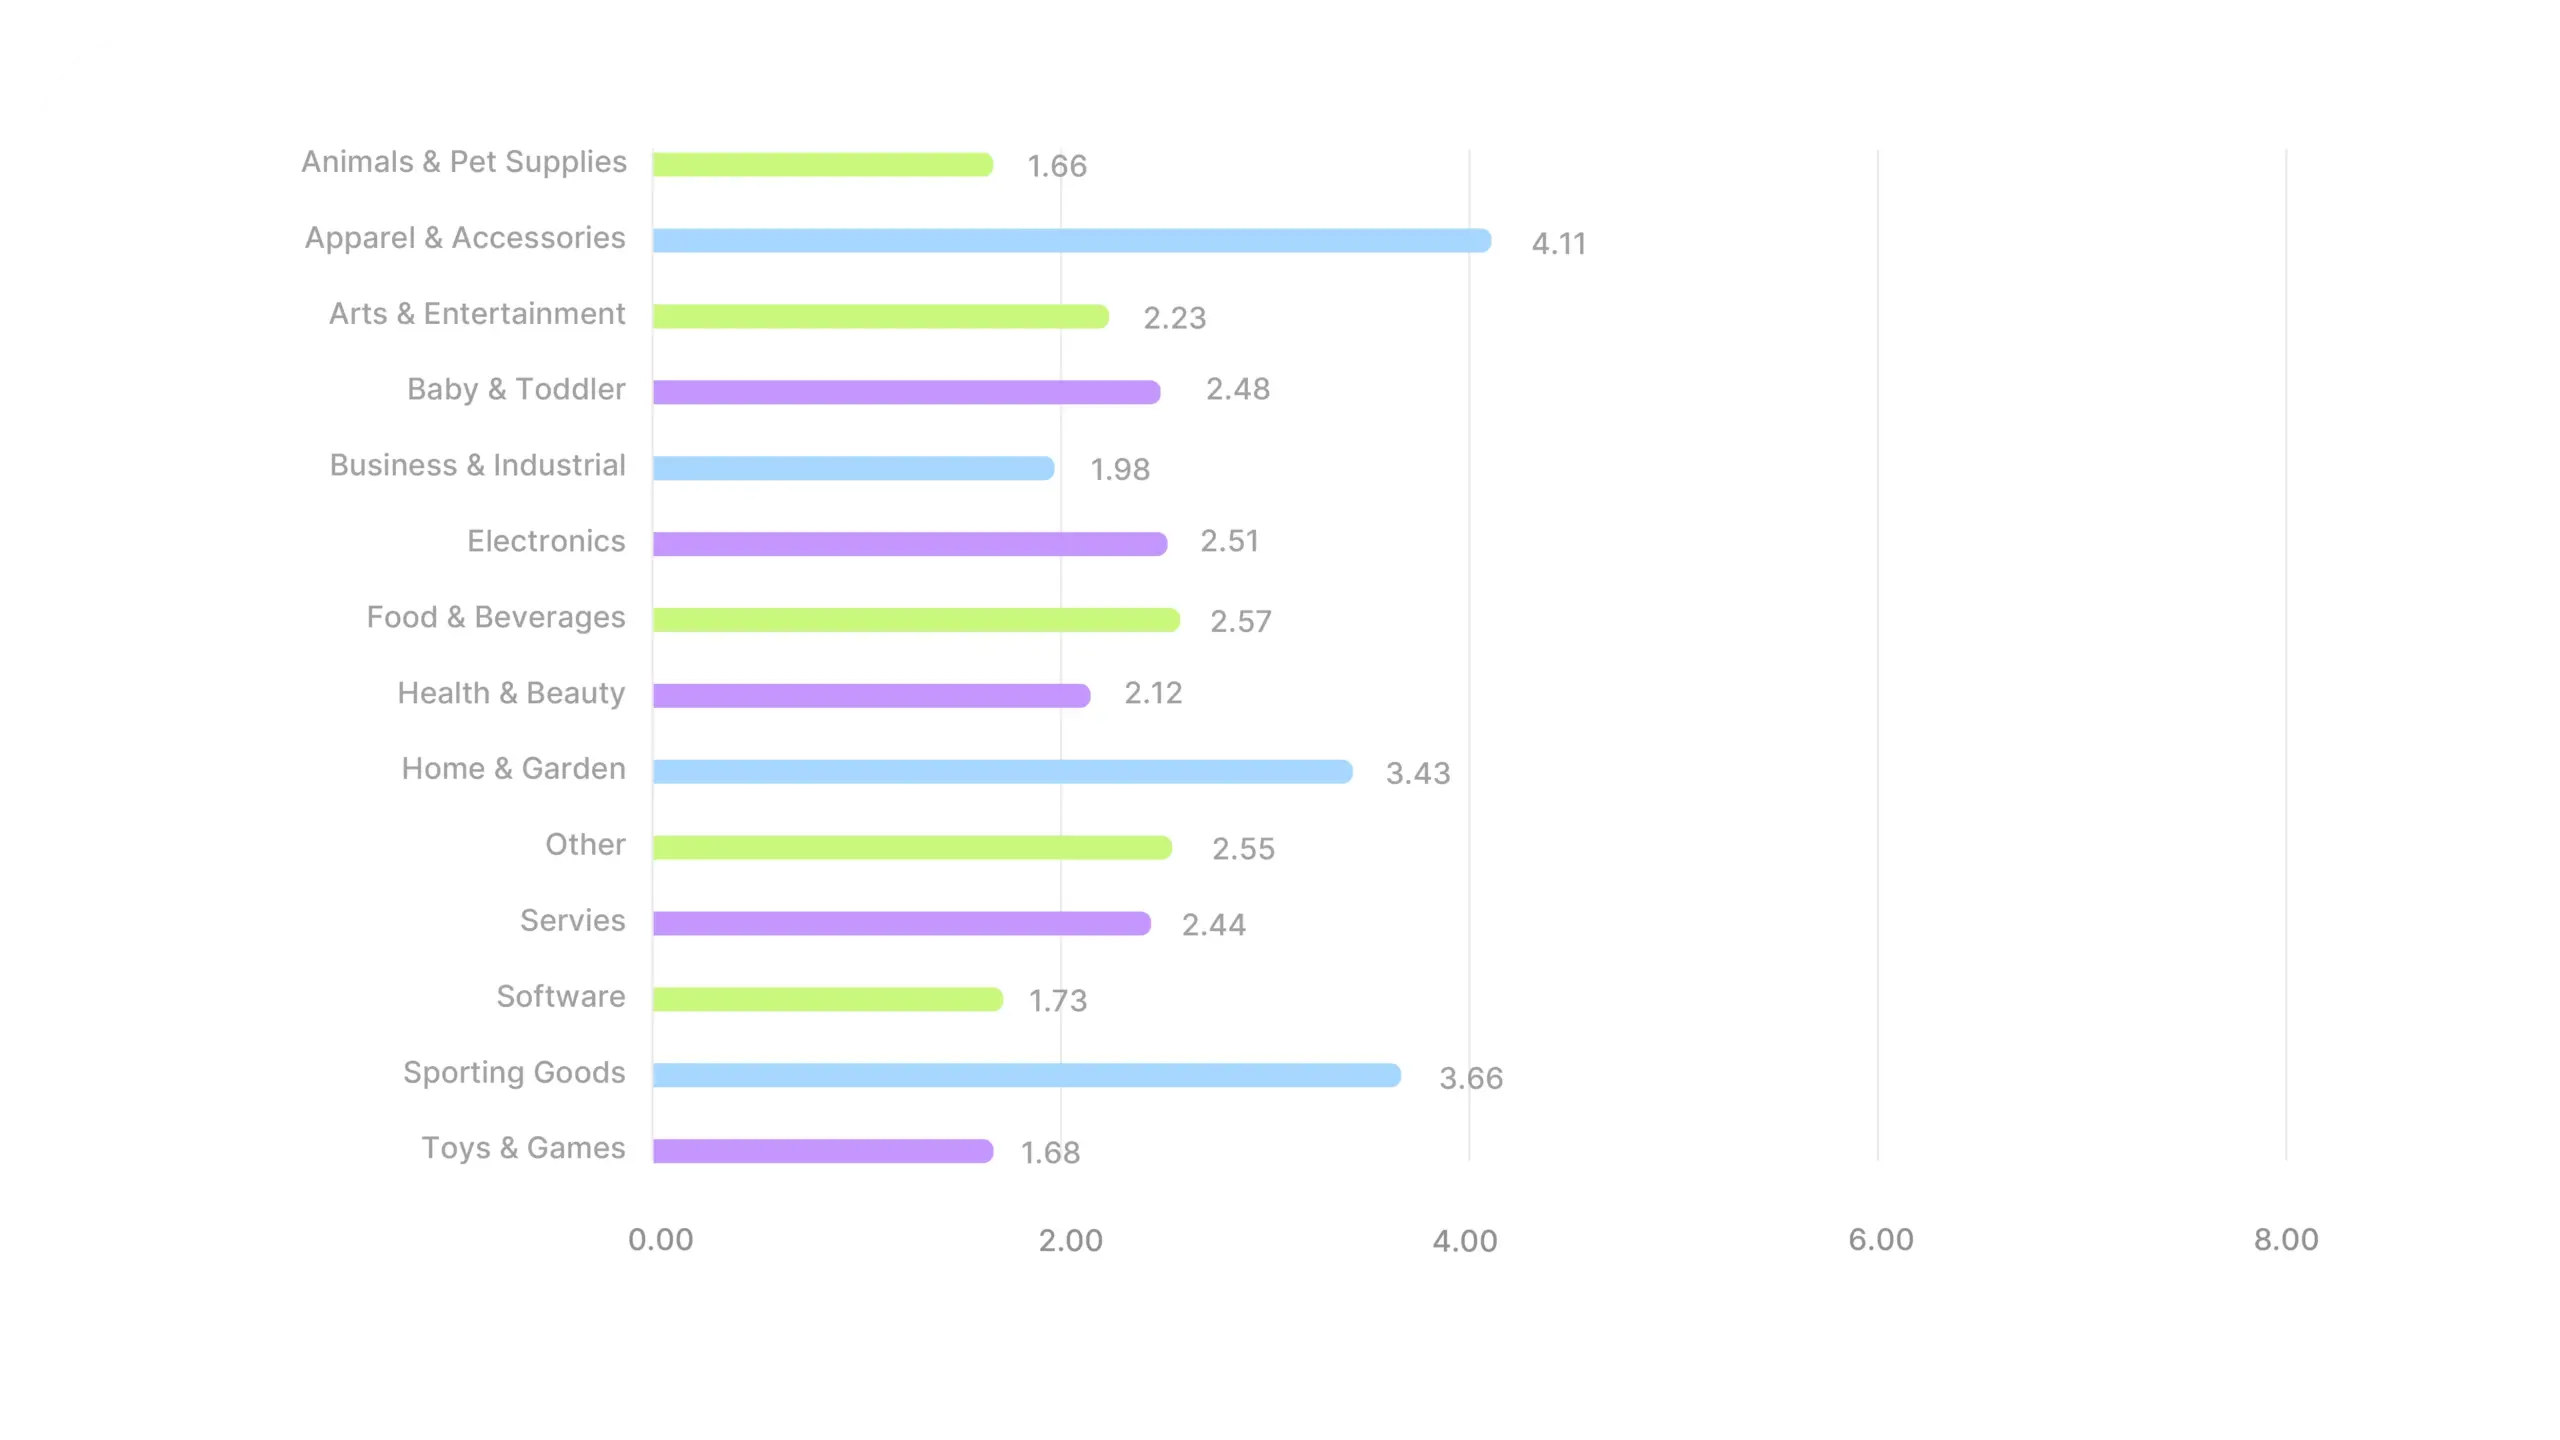
Apparel runs in its own tier at 4.11, almost double the H2 average and well clear of second-place Sporting Goods at 3.66. The “see it, want it, buy it” dynamic seems to meet the category where buying intent is already visual and immediate. Video ads work harder here than anywhere else in the data.
Home & Garden follows at 3.43, though that number is skewed by a single outlier month (July, covered in the deep dive). The rest of the pack clusters within half a point of the overall average, with four categories (Business & Industrial, Software, Toys & Games, Animals & Pet Supplies) trailing meaningfully below 2.00.
Health & Beauty at 2.12 is the surprise of the report. The category led hook rate at 28.34%, tied for top CTR at 1.90%, and now sits below the H2 ROAS average. Viewers stop, viewers click, but fewer viewers convert than the earlier funnel metrics would suggest. The category’s reach seems to outpace immediate buying intent.
Toys & Games tells a similar story with a steeper gap. Second-highest hook rate (28.23%), second-lowest CTR (1.30%), and one of the lowest H2 ROAS numbers (1.68). The opening of the ad works. The conversion step, at least outside the gifting window, likely doesn’t.
Software at 1.73 tracks with what we saw on hook rate and CTR. The category struggles across every metric we’ve measured, and ROAS confirms the pattern.
Industry deep dives
Animals & Pet Supplies is among the lowest ROAS categories in the dataset, but the H2 average undersells what actually happened across the half year.
Industry ROAS average
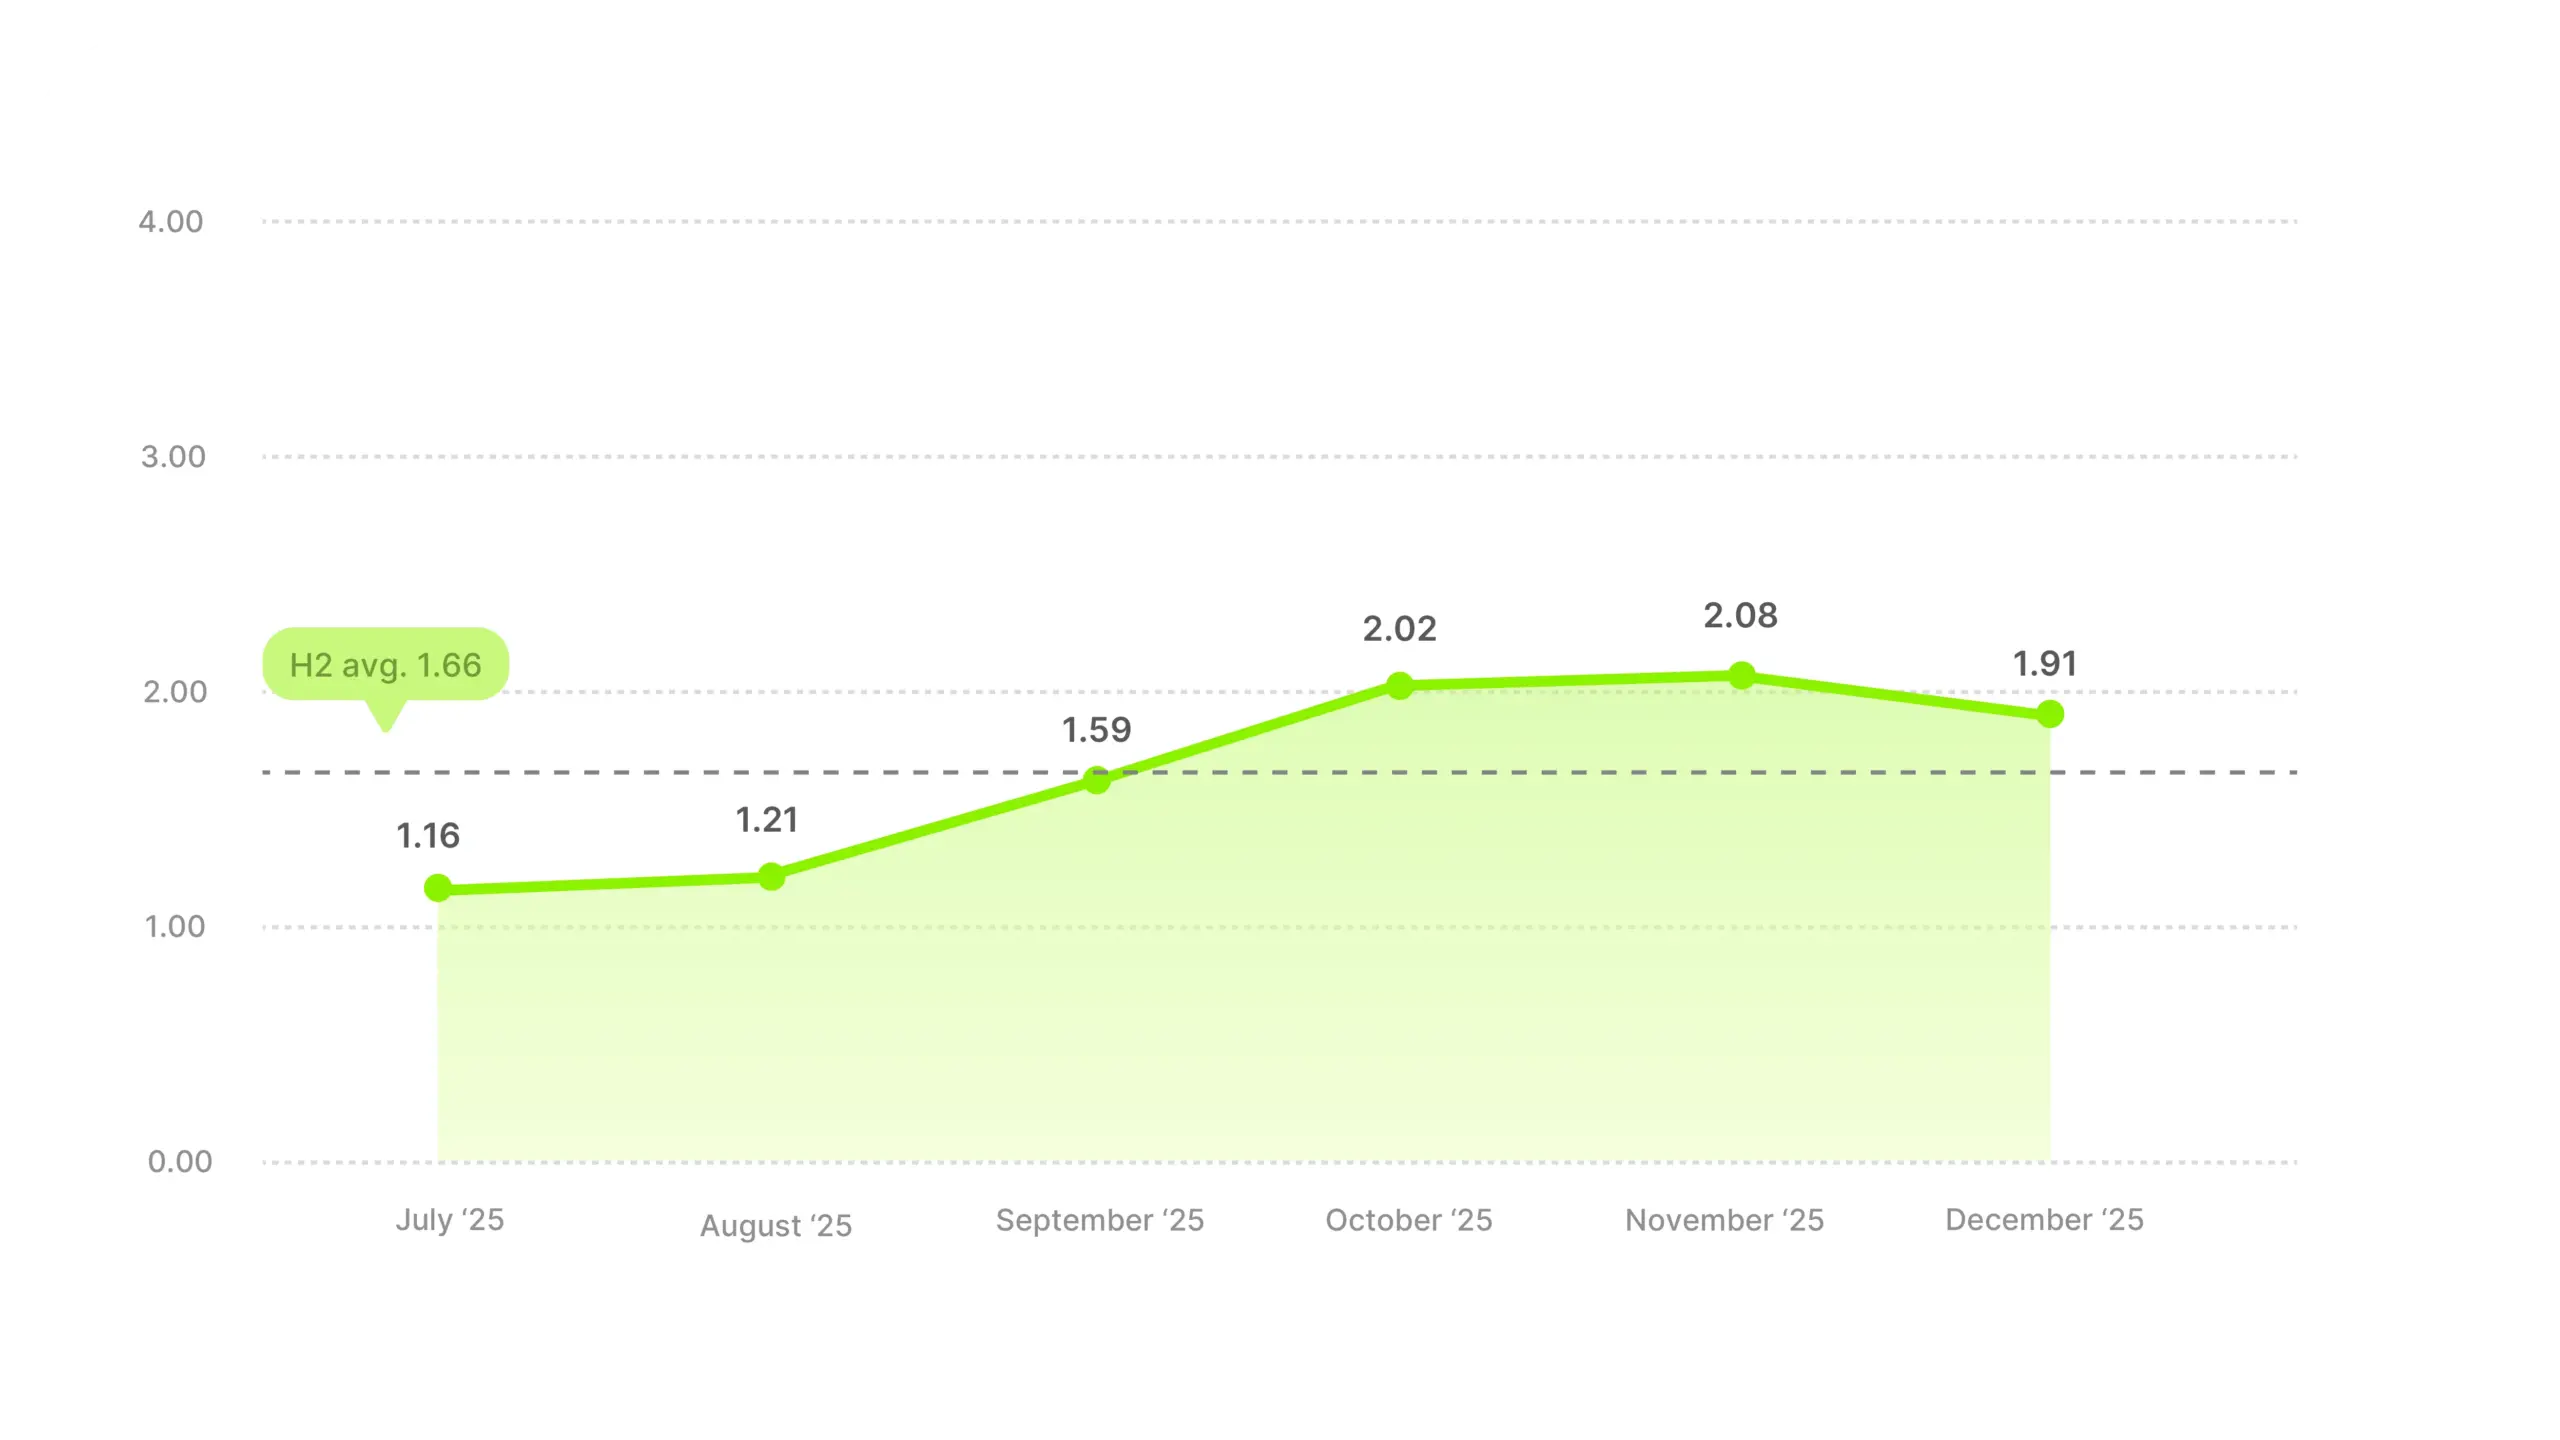
July at 1.16 and August at 1.21 are rough, both well below break-even comfort. The category only climbs into a confident return around September (1.59), then rises steadily through October (2.02) and November (2.08). That’s nearly 80% growth across five months, one of the sharpest upward trajectories in the data.
The pre-Black Friday dip that shows up in most categories doesn’t appear here. September-to-October jumped from 1.59 to 2.02, roughly 27% in a single month. Pet purchases may simply be less discretionary than most. People tend to buy what their pet needs, when their pet needs it, and don’t delay for a sale.
December pulls back to 1.91, inverted from the broader market (where December stayed close to November). One likely reason is that pet supplies don’t benefit from holiday gifting the way other categories do. Once the Q4 consumer tailwind fades, so does the lift here.
Apparel & Accessories posted the highest H2 ROAS of any category at 4.11. That headline number undersells how well video works in this vertical. But the monthly trajectory needs context, because read the wrong way, it looks like things fell off.
Industry ROAS average
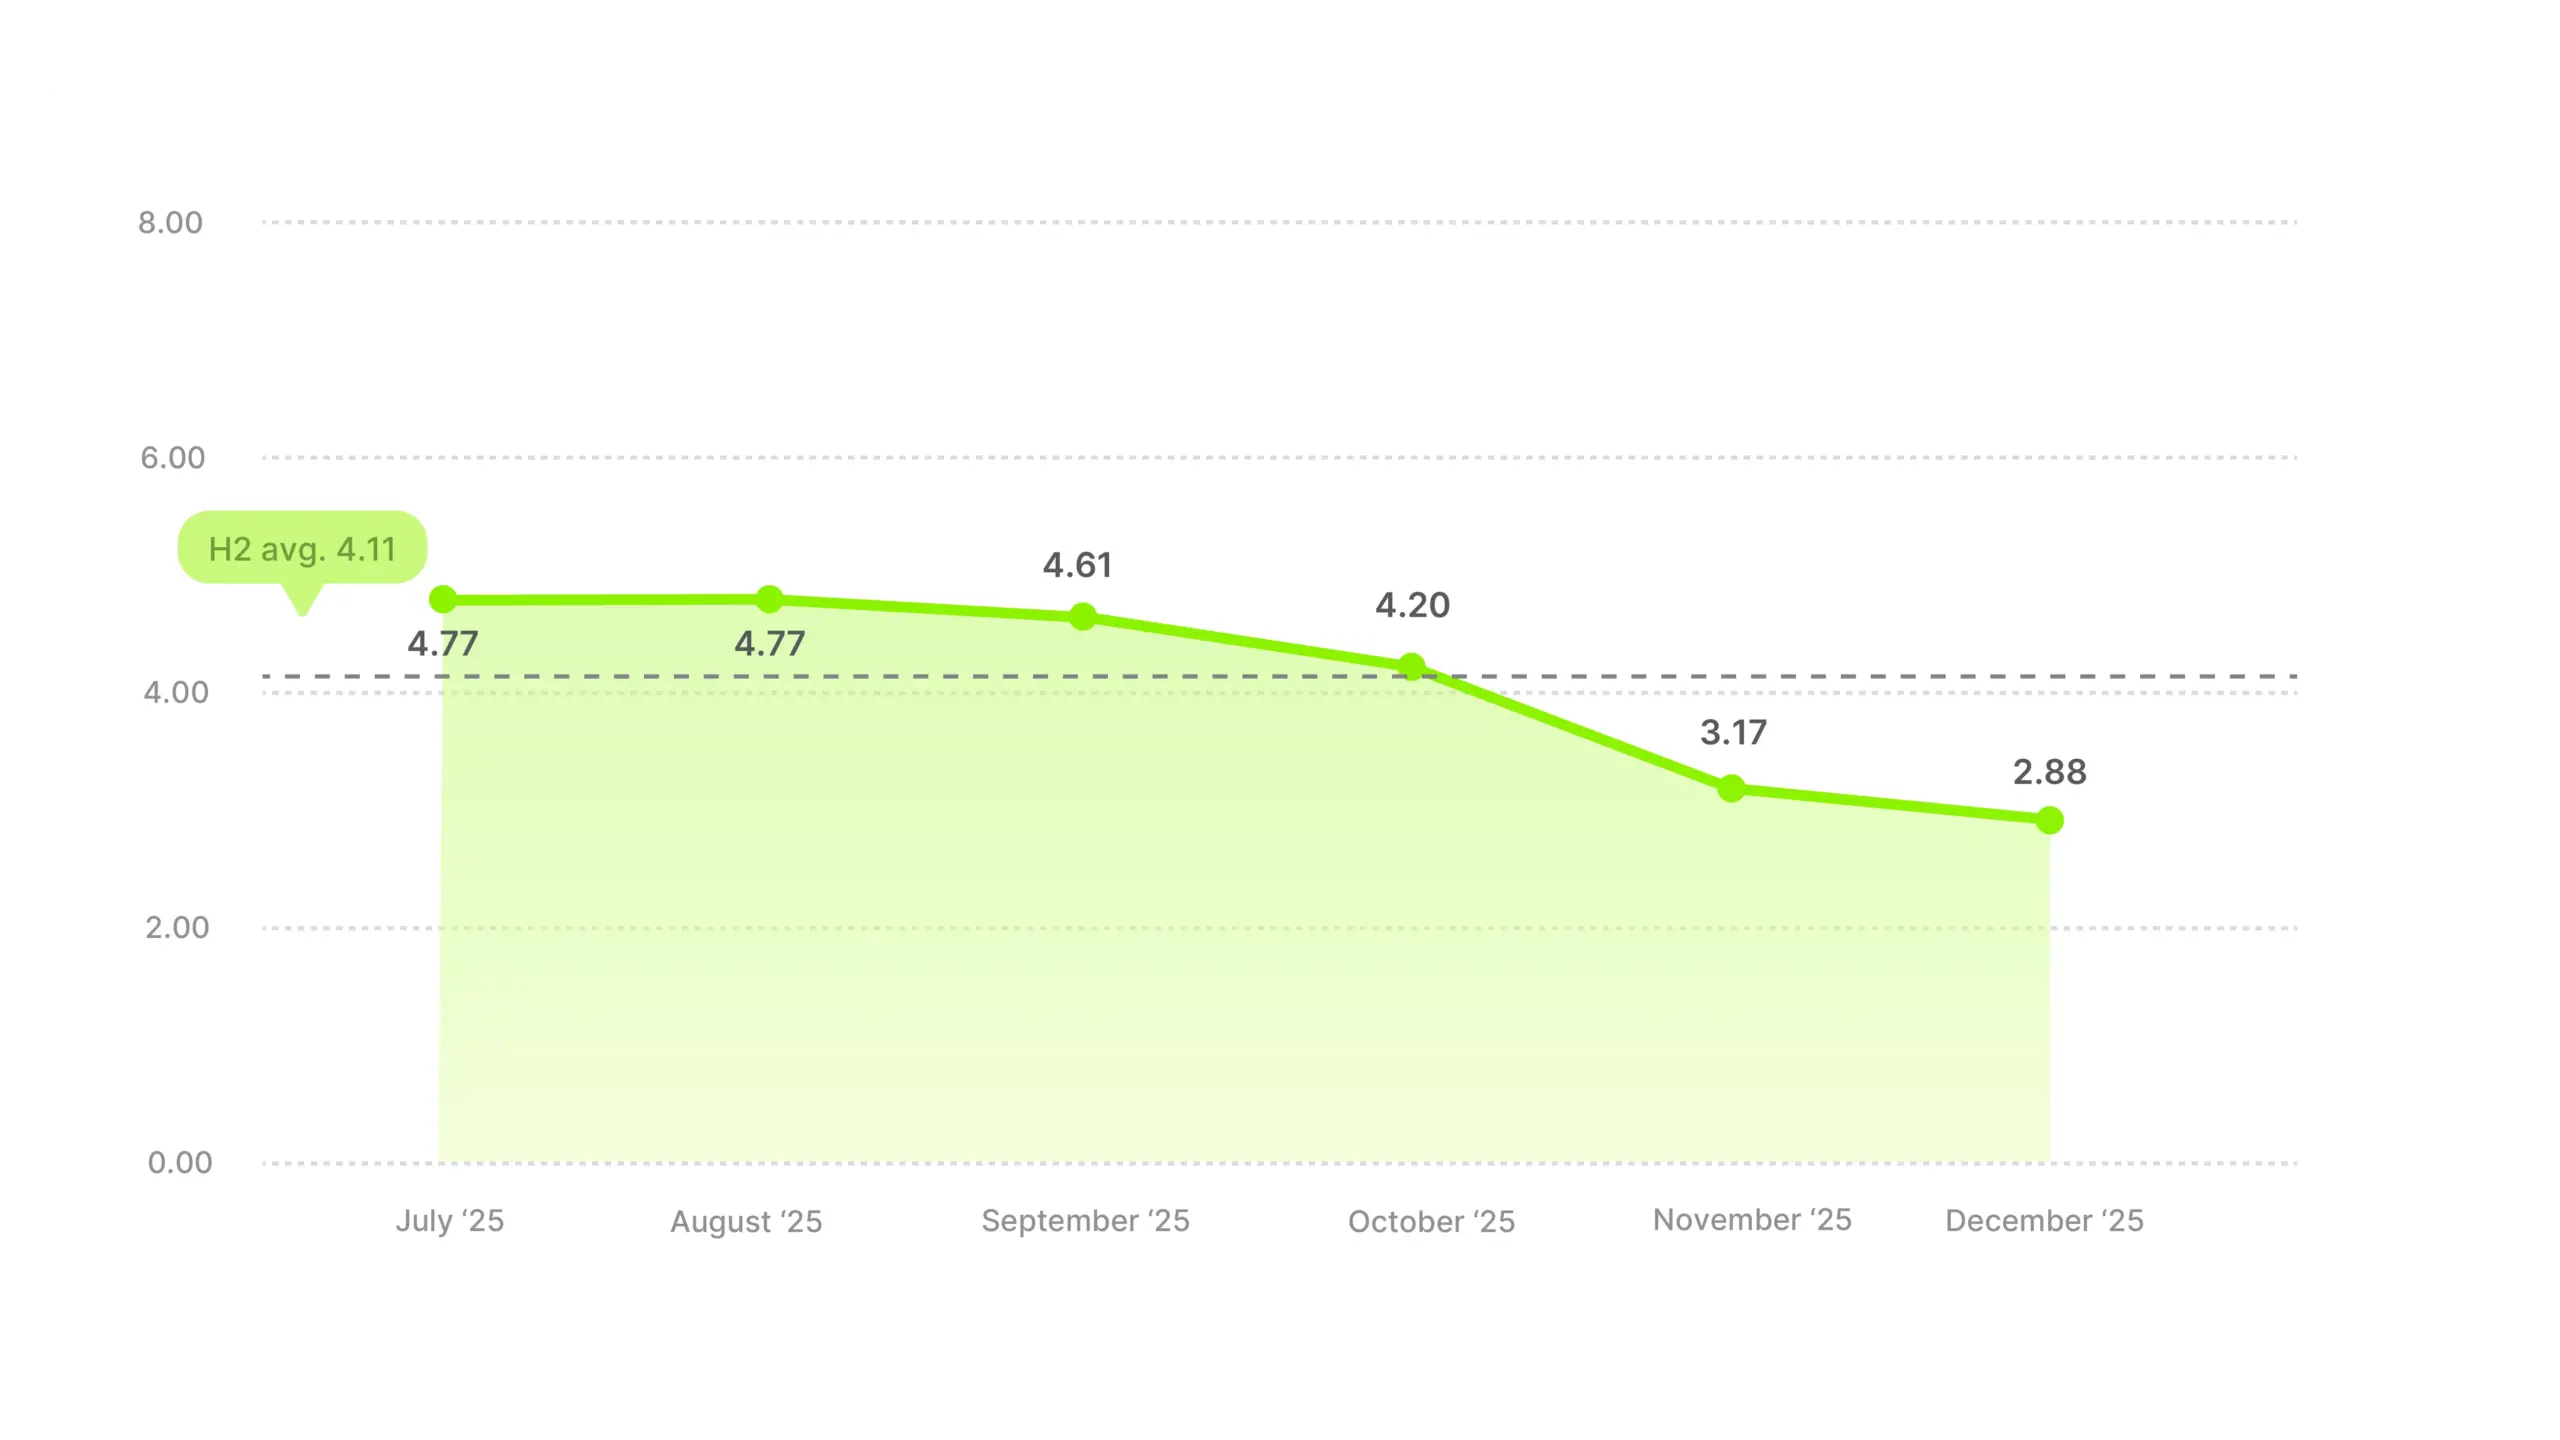
The trend is a steady decline. 4.77 in July and August. 4.61 in September. Then 4.20 in October, 3.17 in November, 2.88 in December. That’s roughly a 40% drop from peak to trough. On the surface, it reads like Apparel video ads lost their edge as the half progressed.
But the truth is they didn’t. This is probably a scale story rather than an efficiency decline. Brands leaned in hard through Q4, and additional dollars spent tend to return slightly less than the ones before. Classic diminishing returns at volume. Even at December’s 2.88, Apparel still cleared the overall H2 market average of 2.41.
This runs counter to the overall market pattern. Overall ROAS peaked in November and December. Apparel ROAS dipped through those same months. The most plausible reason is that Apparel brands scaled harder than almost anyone else, accepting a lower return per dollar in exchange for more revenue overall.
Expect the Q4 dip, especially if you decide to scale harder. A 4.77 July and a 2.88 December are both healthy readings for Apparel, just telling different stories about the same business.
Arts & Entertainment sits just below the overall market average at 2.23. The H2 number smooths over a dramatic V-shape that’s worth seeing in full.
Industry ROAS average
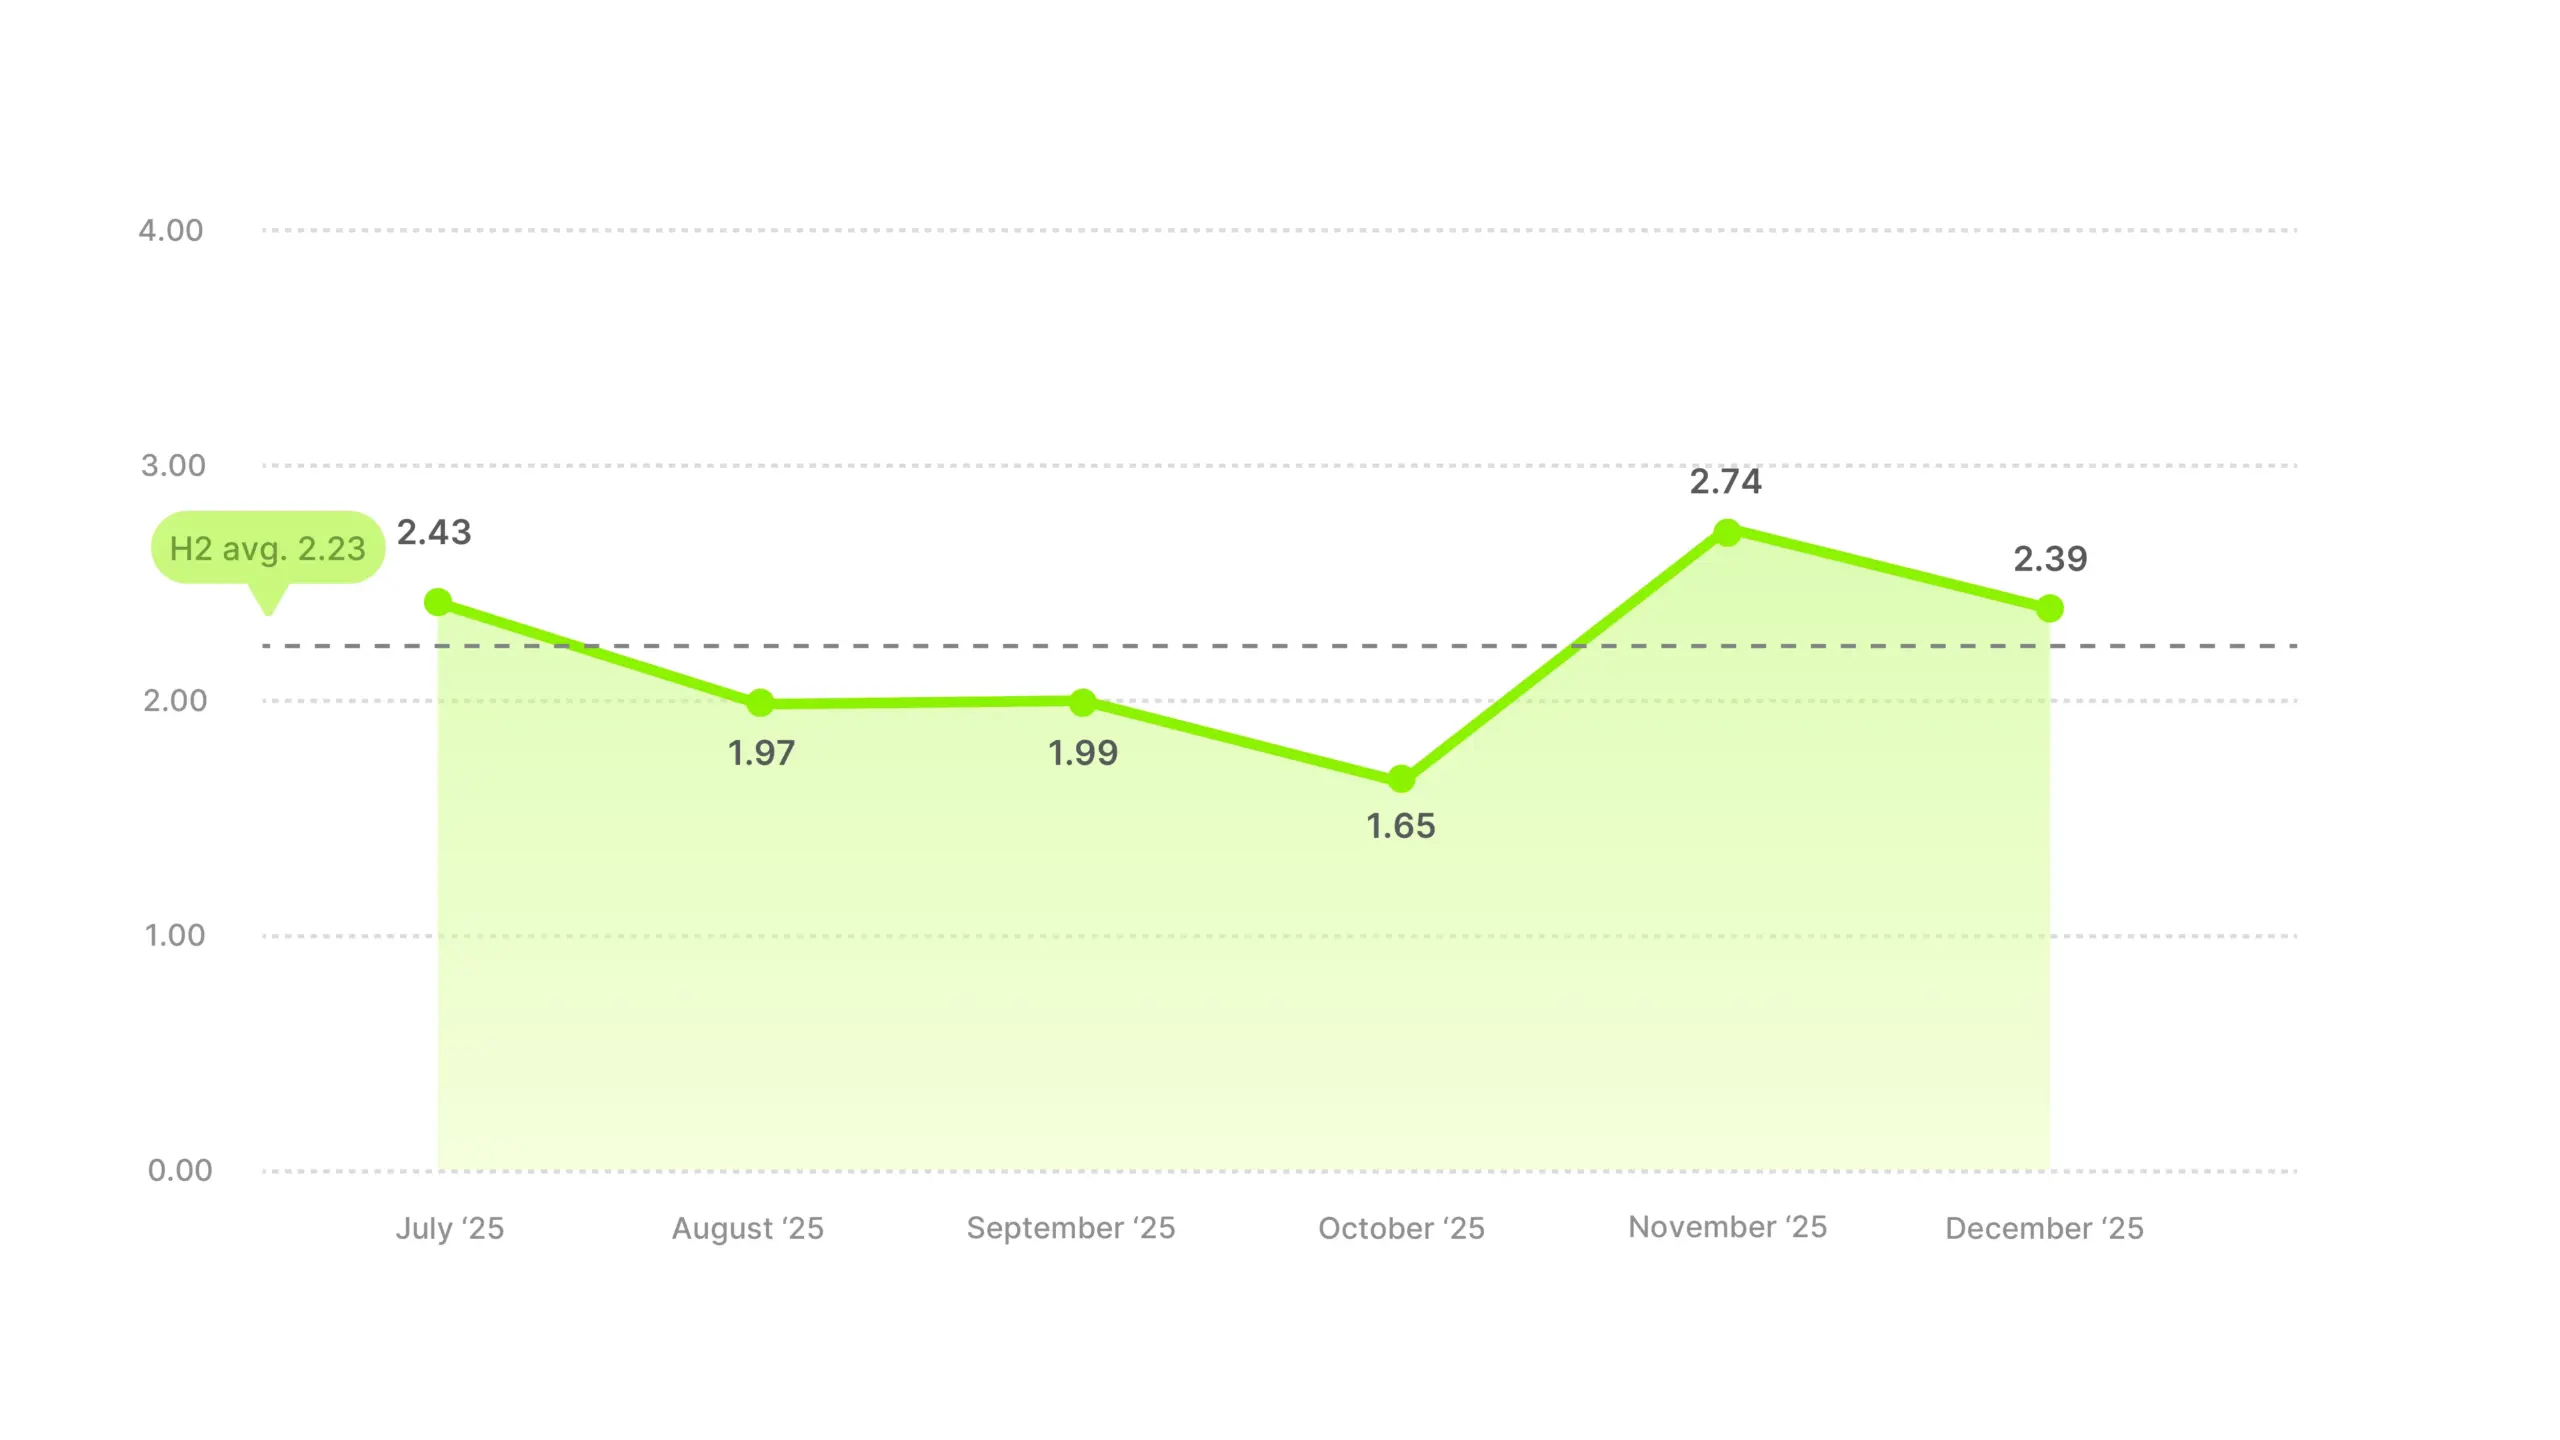
July started at 2.43. Then a steady slide: 1.97 in August, 1.99 in September, and 1.65 in October. October is the bottom, roughly 32% off July’s opener; ads kept running across those months, but conversions softened.
November bounced back hard, 1.65 to 2.74. That’s roughly 66% recovered in four weeks, and it’s the largest single-month ROAS swing we saw across any vertical in H2. The October dip pattern that shows up across the market appears even more sharply here, and the correction is proportionally larger too.
December pulls back to 2.39, probably the same scale-dilution effect Apparel and Baby & Toddler show. More Q4 spend tends to produce more total volume and a slightly lower return per dollar. Even with the pullback, December lands close to the overall H2 market average.
The category covers a wide swath of products, from hobby kits to ticketed experiences to craft supplies and streaming services. Too much variety inside one bucket to name a single driver. That said, the Q4 shape lines up with gifting behavior pretty cleanly, and gifting is probably what’s pulling the November spike.
If Arts & Entertainment is your vertical, don’t panic in October. The recovery shows up reliably in this data, and it’s sharper here than almost anywhere else.
Baby & Toddler sits just above the overall market average at 2.48. And unlike most categories, the trend line is almost boringly clean.
Industry ROAS average
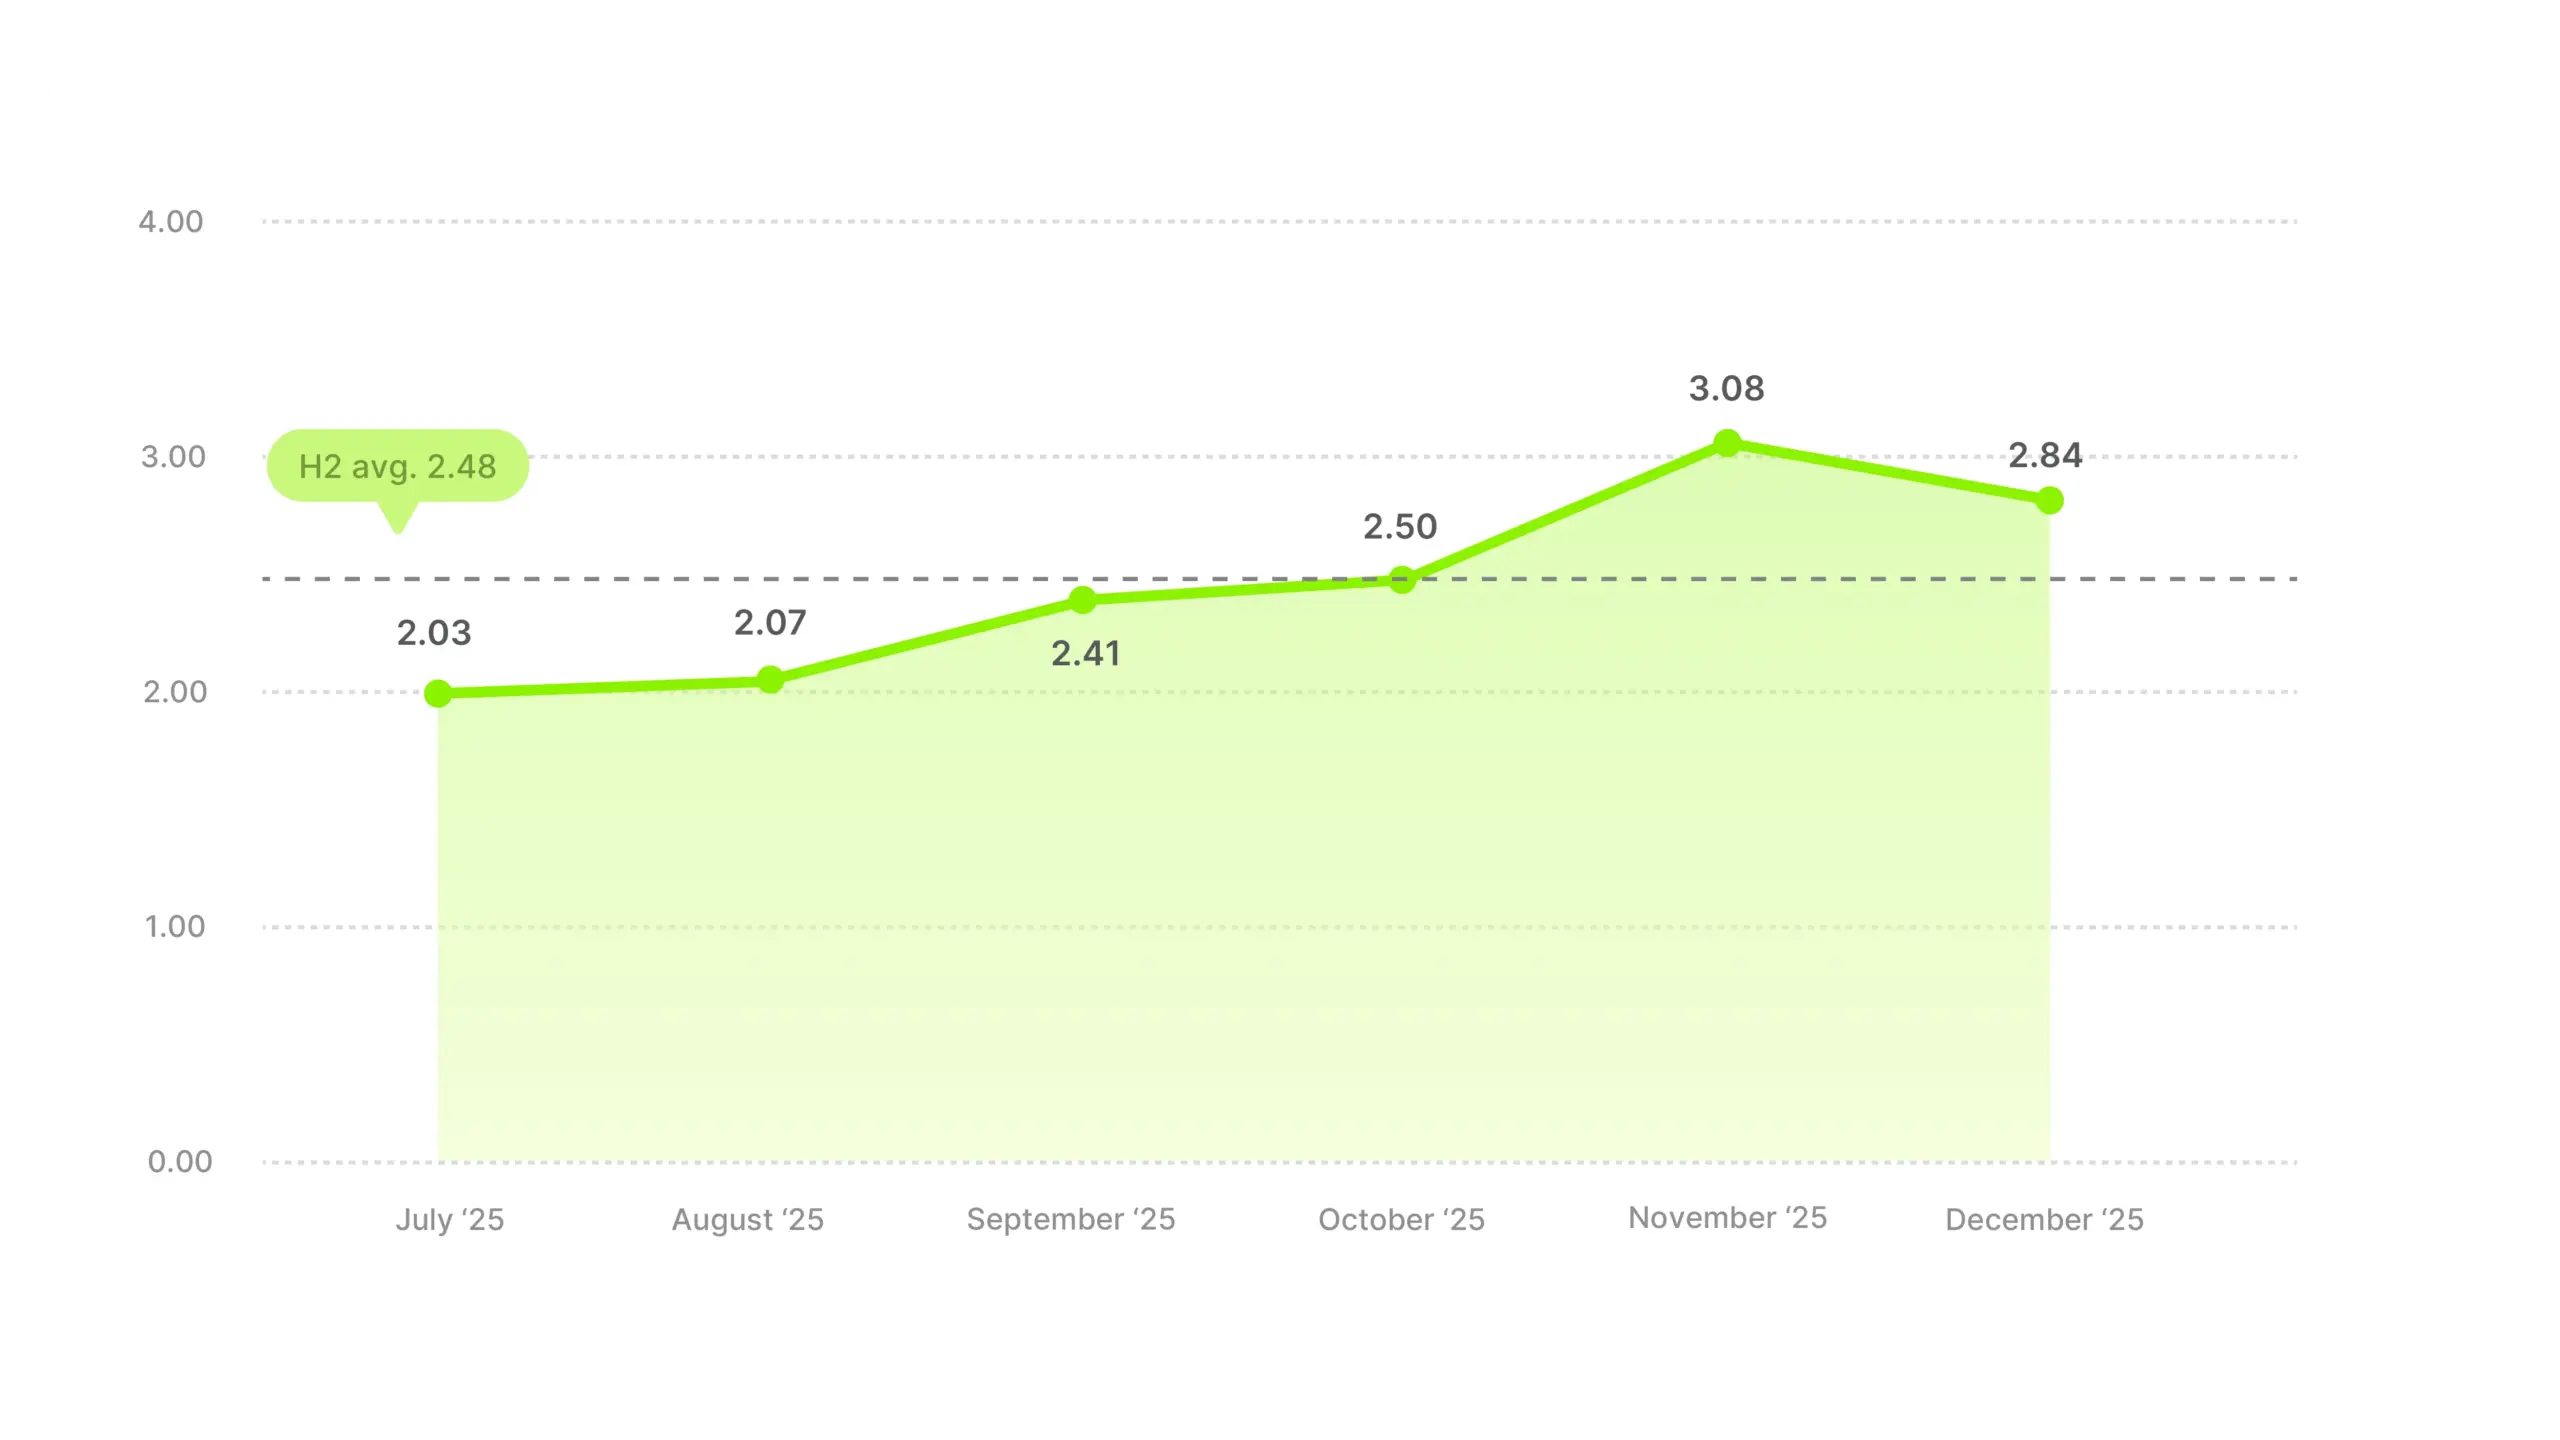
2.03 in July. 2.07 in August. 2.41 in September. 2.50 in October. 3.08 in November. 2.84 in December. That’s roughly a 52% climb from July to November with no dips or reversals. One of the cleanest upward trajectories in the data.
The pre-Black Friday dip that shows up in the overall market doesn’t appear here either, as ROAS kept climbing right through October. The likely reason is that baby products are need-driven, similar to pet supplies, and need-driven purchases don’t get delayed for deals – parents buy when they need to.
November at 3.08 is the standout. The most plausible driver is gifting layered on top of regular need-based buying. Baby showers, grandparents and relatives picking up strollers, clothes, and toys. That extra intent could lift a solid category into a standout one for a single month.
December dilutes slightly to 2.84, a pattern we’ve seen elsewhere. More scale, slightly lower return per dollar, still well above the overall H2 average.
November does the heavy lifting here. The rest of H2 walks a remarkably clean upward line, and the gifting spike rewards brands that concentrate their strongest creative in a single month rather than spreading effort thin across six.
Business & Industrial averaged 1.98 across H2, below the overall market average. But the trend is sharply upward, and the efficiency story is one of the most interesting in the dataset.
Industry ROAS average
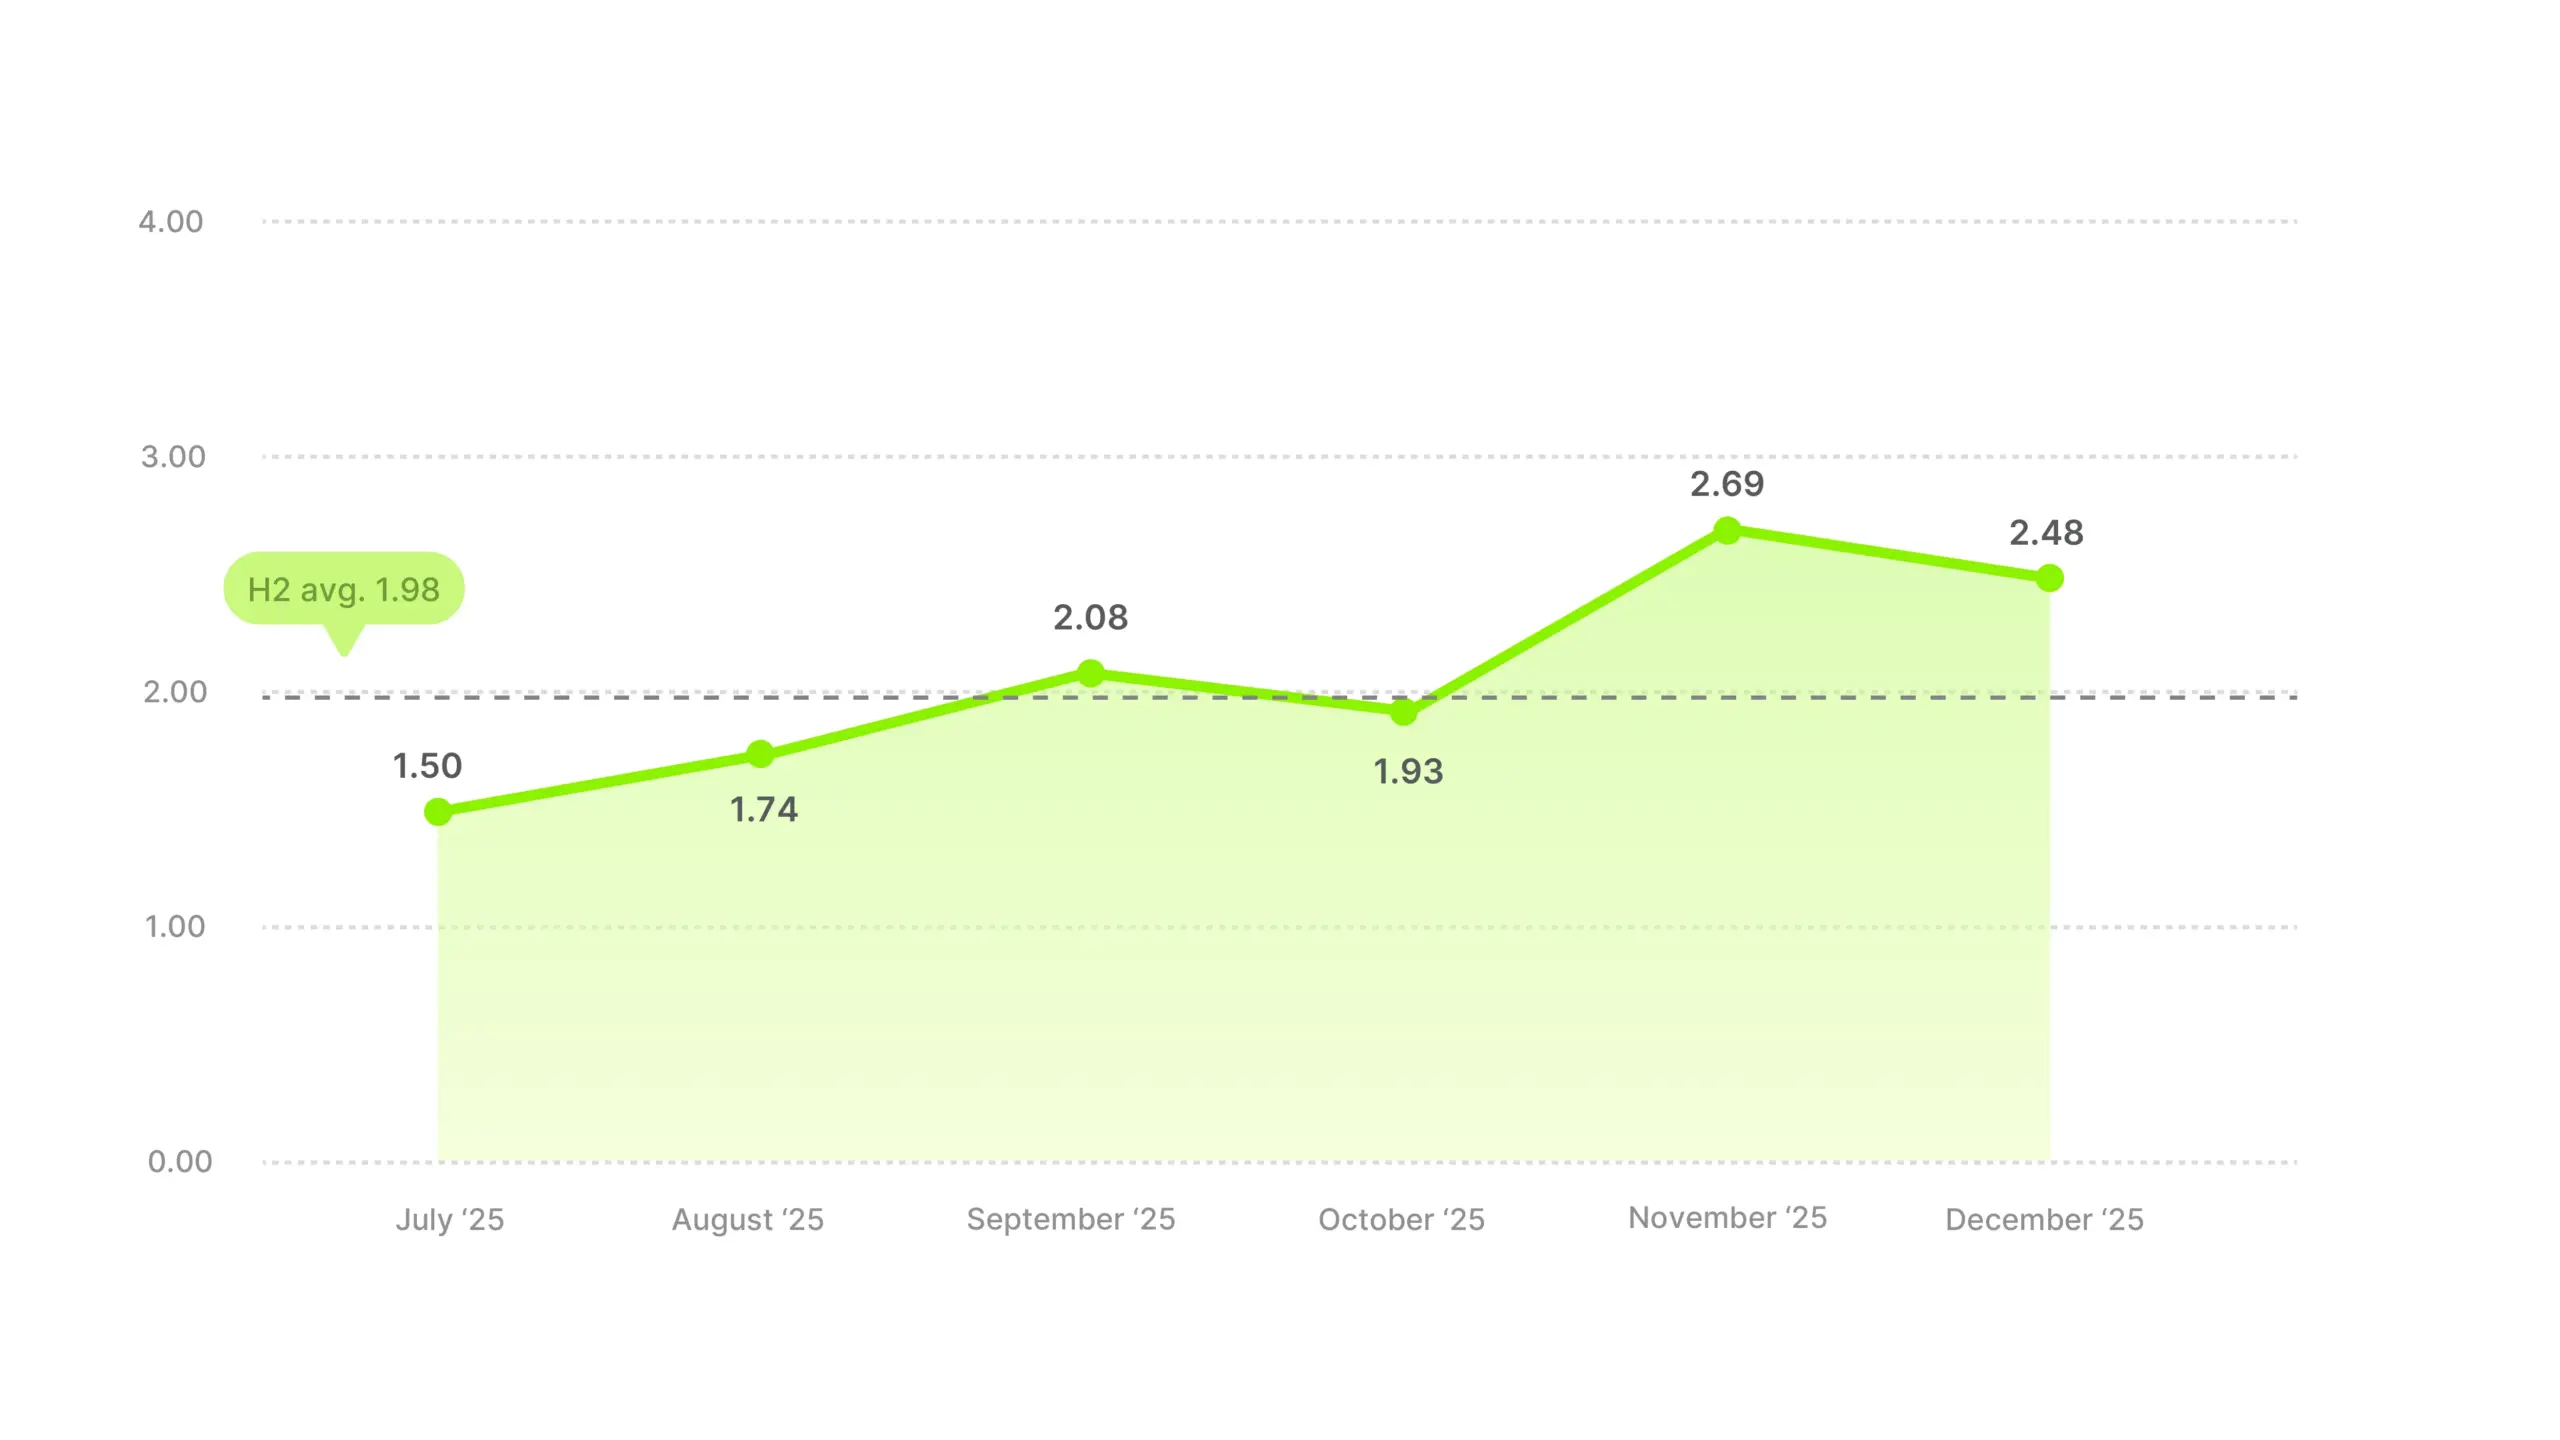
From July (1.50) to November (2.69), ROAS climbed roughly 79%. One of the strongest climbs of any category. December settled at 2.48, still well above the category’s own H2 average.
The pattern lines up with what we saw in our hook rate data for this category. Business & Industrial outpaced the market on hook rate across all six months of H2, and it delivered its strongest months when competitor volume thinned out. ROAS points in the same direction.
The read across both metrics is that B2B brands who stay active while their competitors retreat likely benefit from a cleaner feed, less intra-category competition, and higher-intent audiences. The Q4 window seems to reward brands who lean in rather than wait out the holiday noise.
Aim past the category average here. November regularly runs well above 1.98, and the B2B feed tends to open up right when consumer categories get loudest. The quieter your competition, the harder each dollar works.
Electronics at 2.51 sits just above the overall market average. The monthly pattern tracks the overall market rhythm more closely than almost any other category.
Industry ROAS average
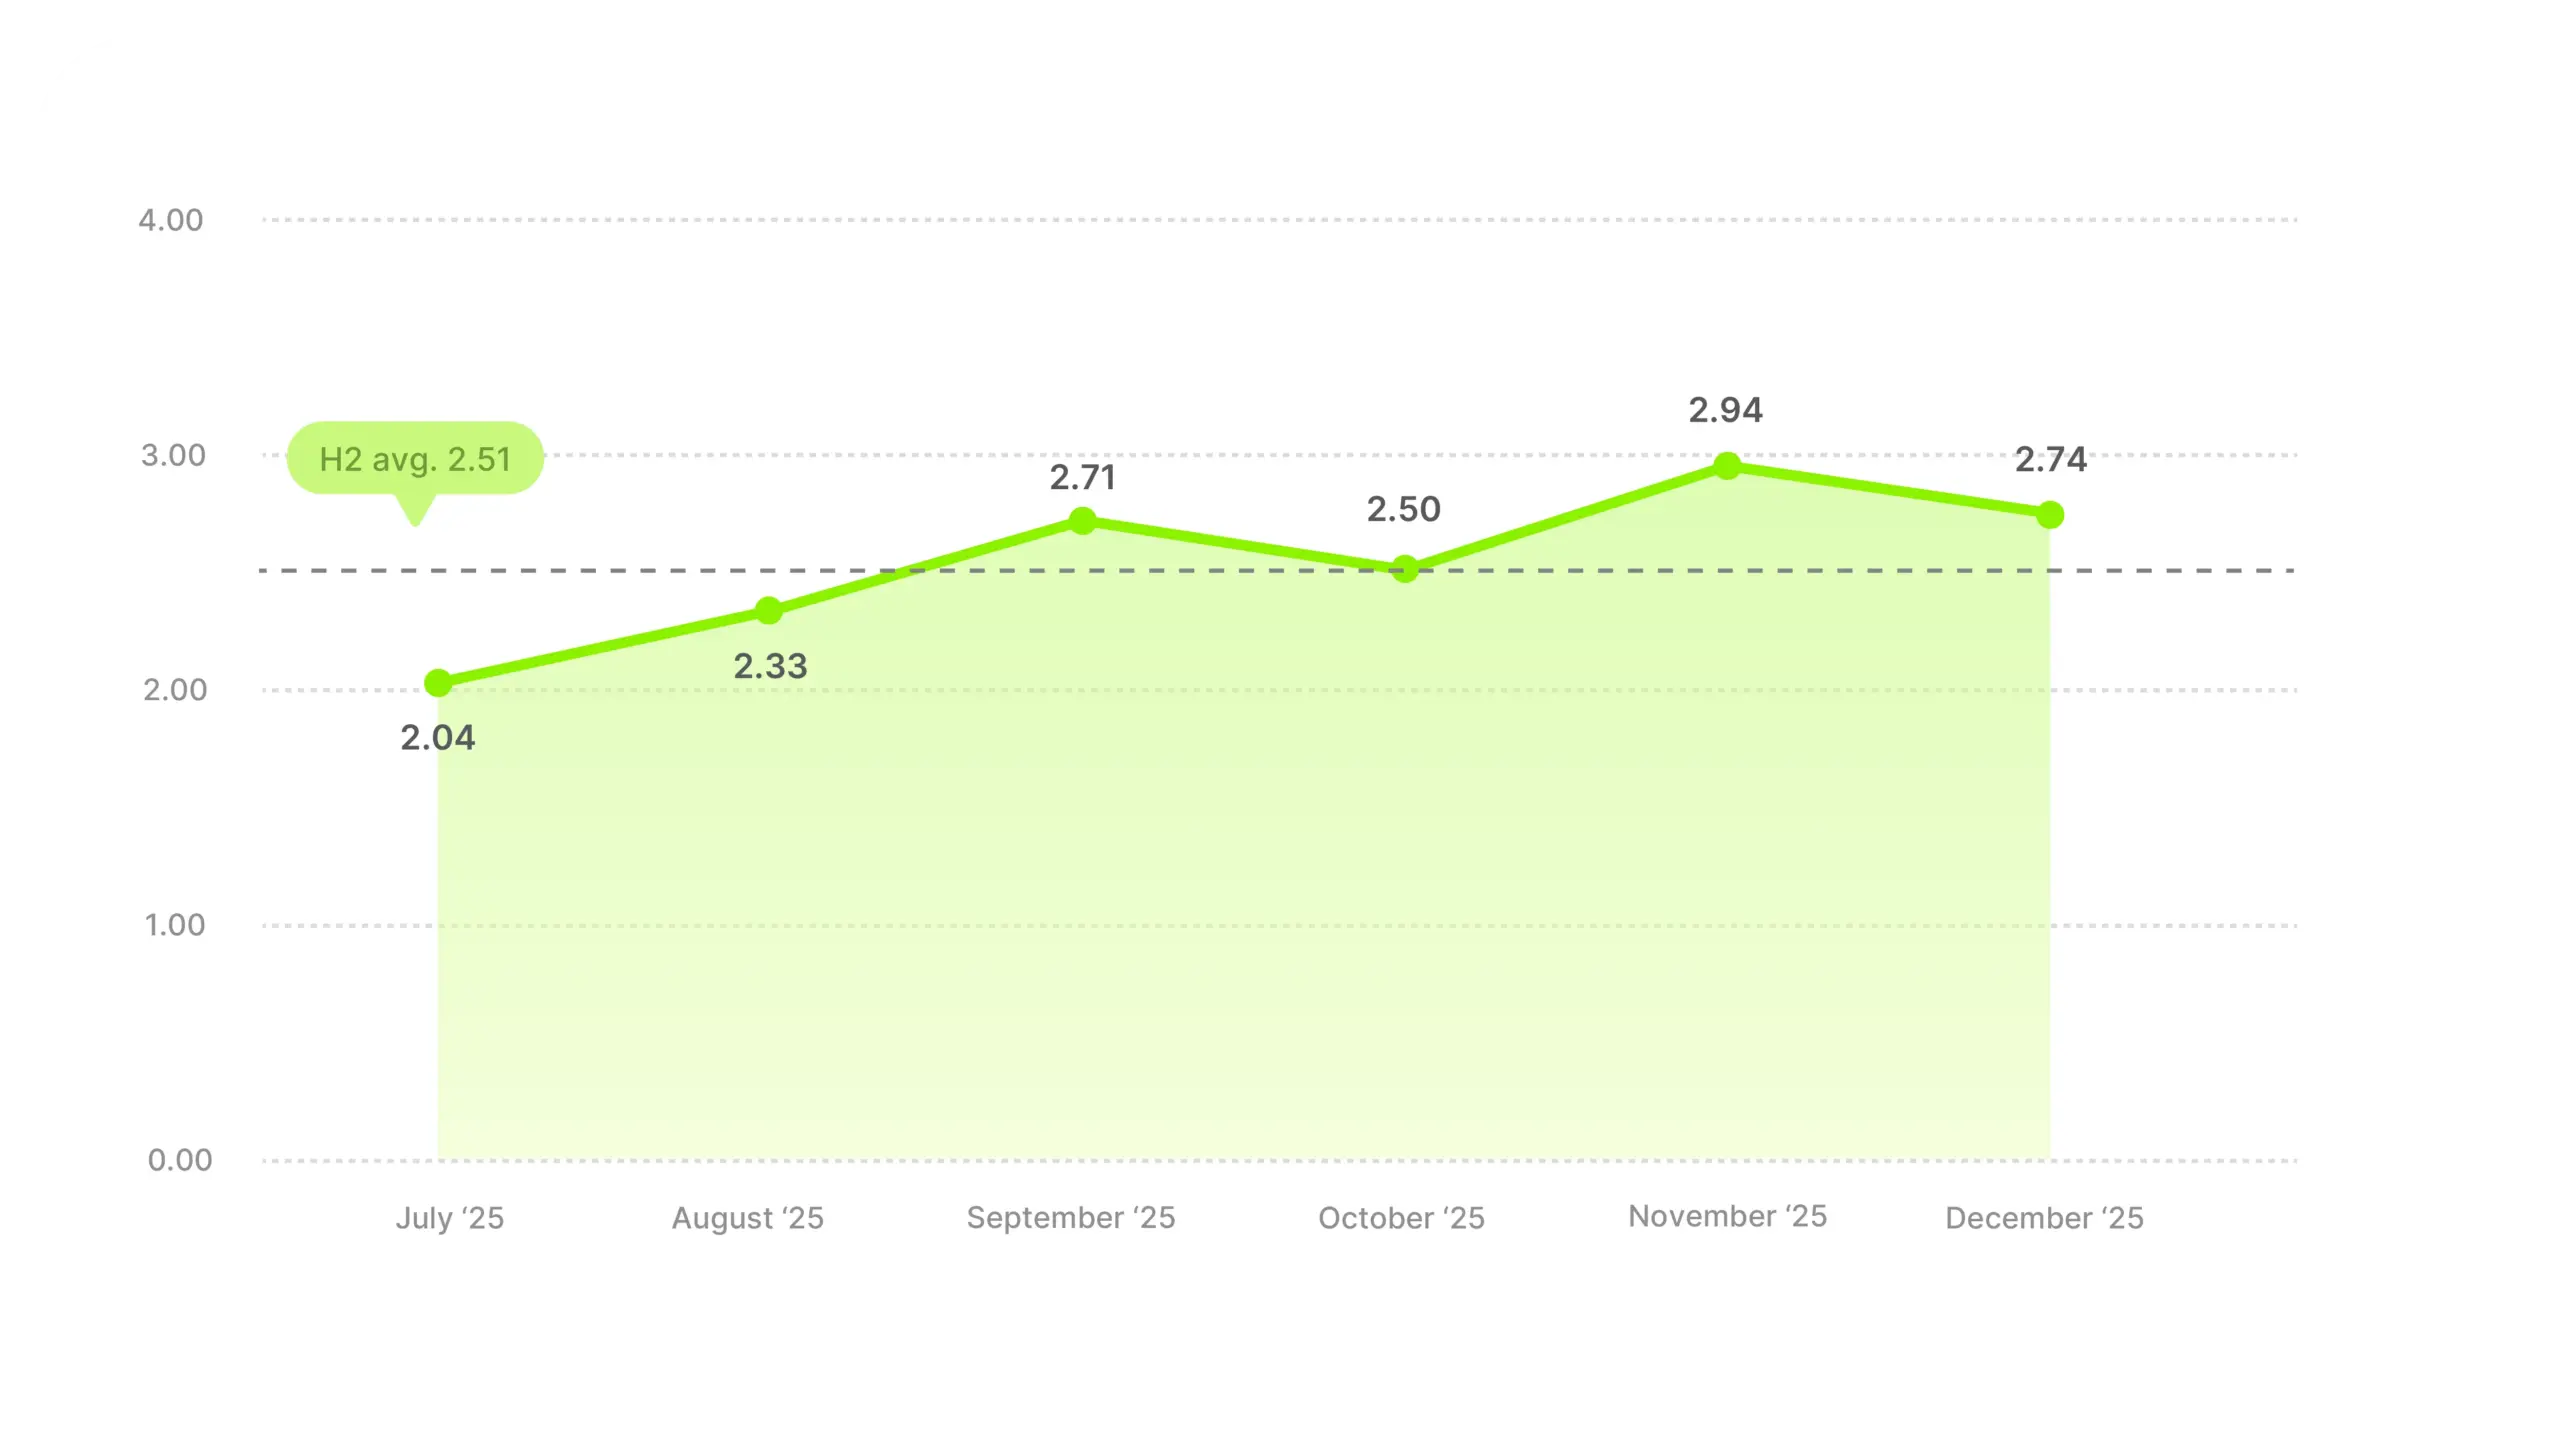
August at 2.33 is the one month that breaks the otherwise clean arc. The likely driver is a back-to-school push where category activity ramped up but the returns didn’t quite scale with the effort. Worth noting because it’s easy to misread August as a weak month when it’s really a volume-heavy one.
The October dip is the cleanest signal in the category. Electronics is a classic “wait for the deal” vertical, and the data shows it. Consumers see ads in October, research and compare, and likely hold off until Black Friday. November’s jump to 2.94 probably reflects those same consumers finally converting when the deals landed.
Our CTR data for Electronics showed a timing story that sits next to this one rather than on top of it. CTR dipped in November (1.29%) and spiked in December (1.81%), while ROAS peaked in November and pulled back in December. One read is that consumers click around in different months than they convert in. Understanding the reasons behind these inconsistencies is key, because the two metrics tell different truths about the same buyer.
An October dip is probably because of the category and not the creative, but a November dip is a different conversation.
Food & Beverages averaged 2.57, above the overall market. Another V-shape sits inside the average, similar in shape to Arts & Entertainment, but this one finishes higher than it started.
Industry ROAS average
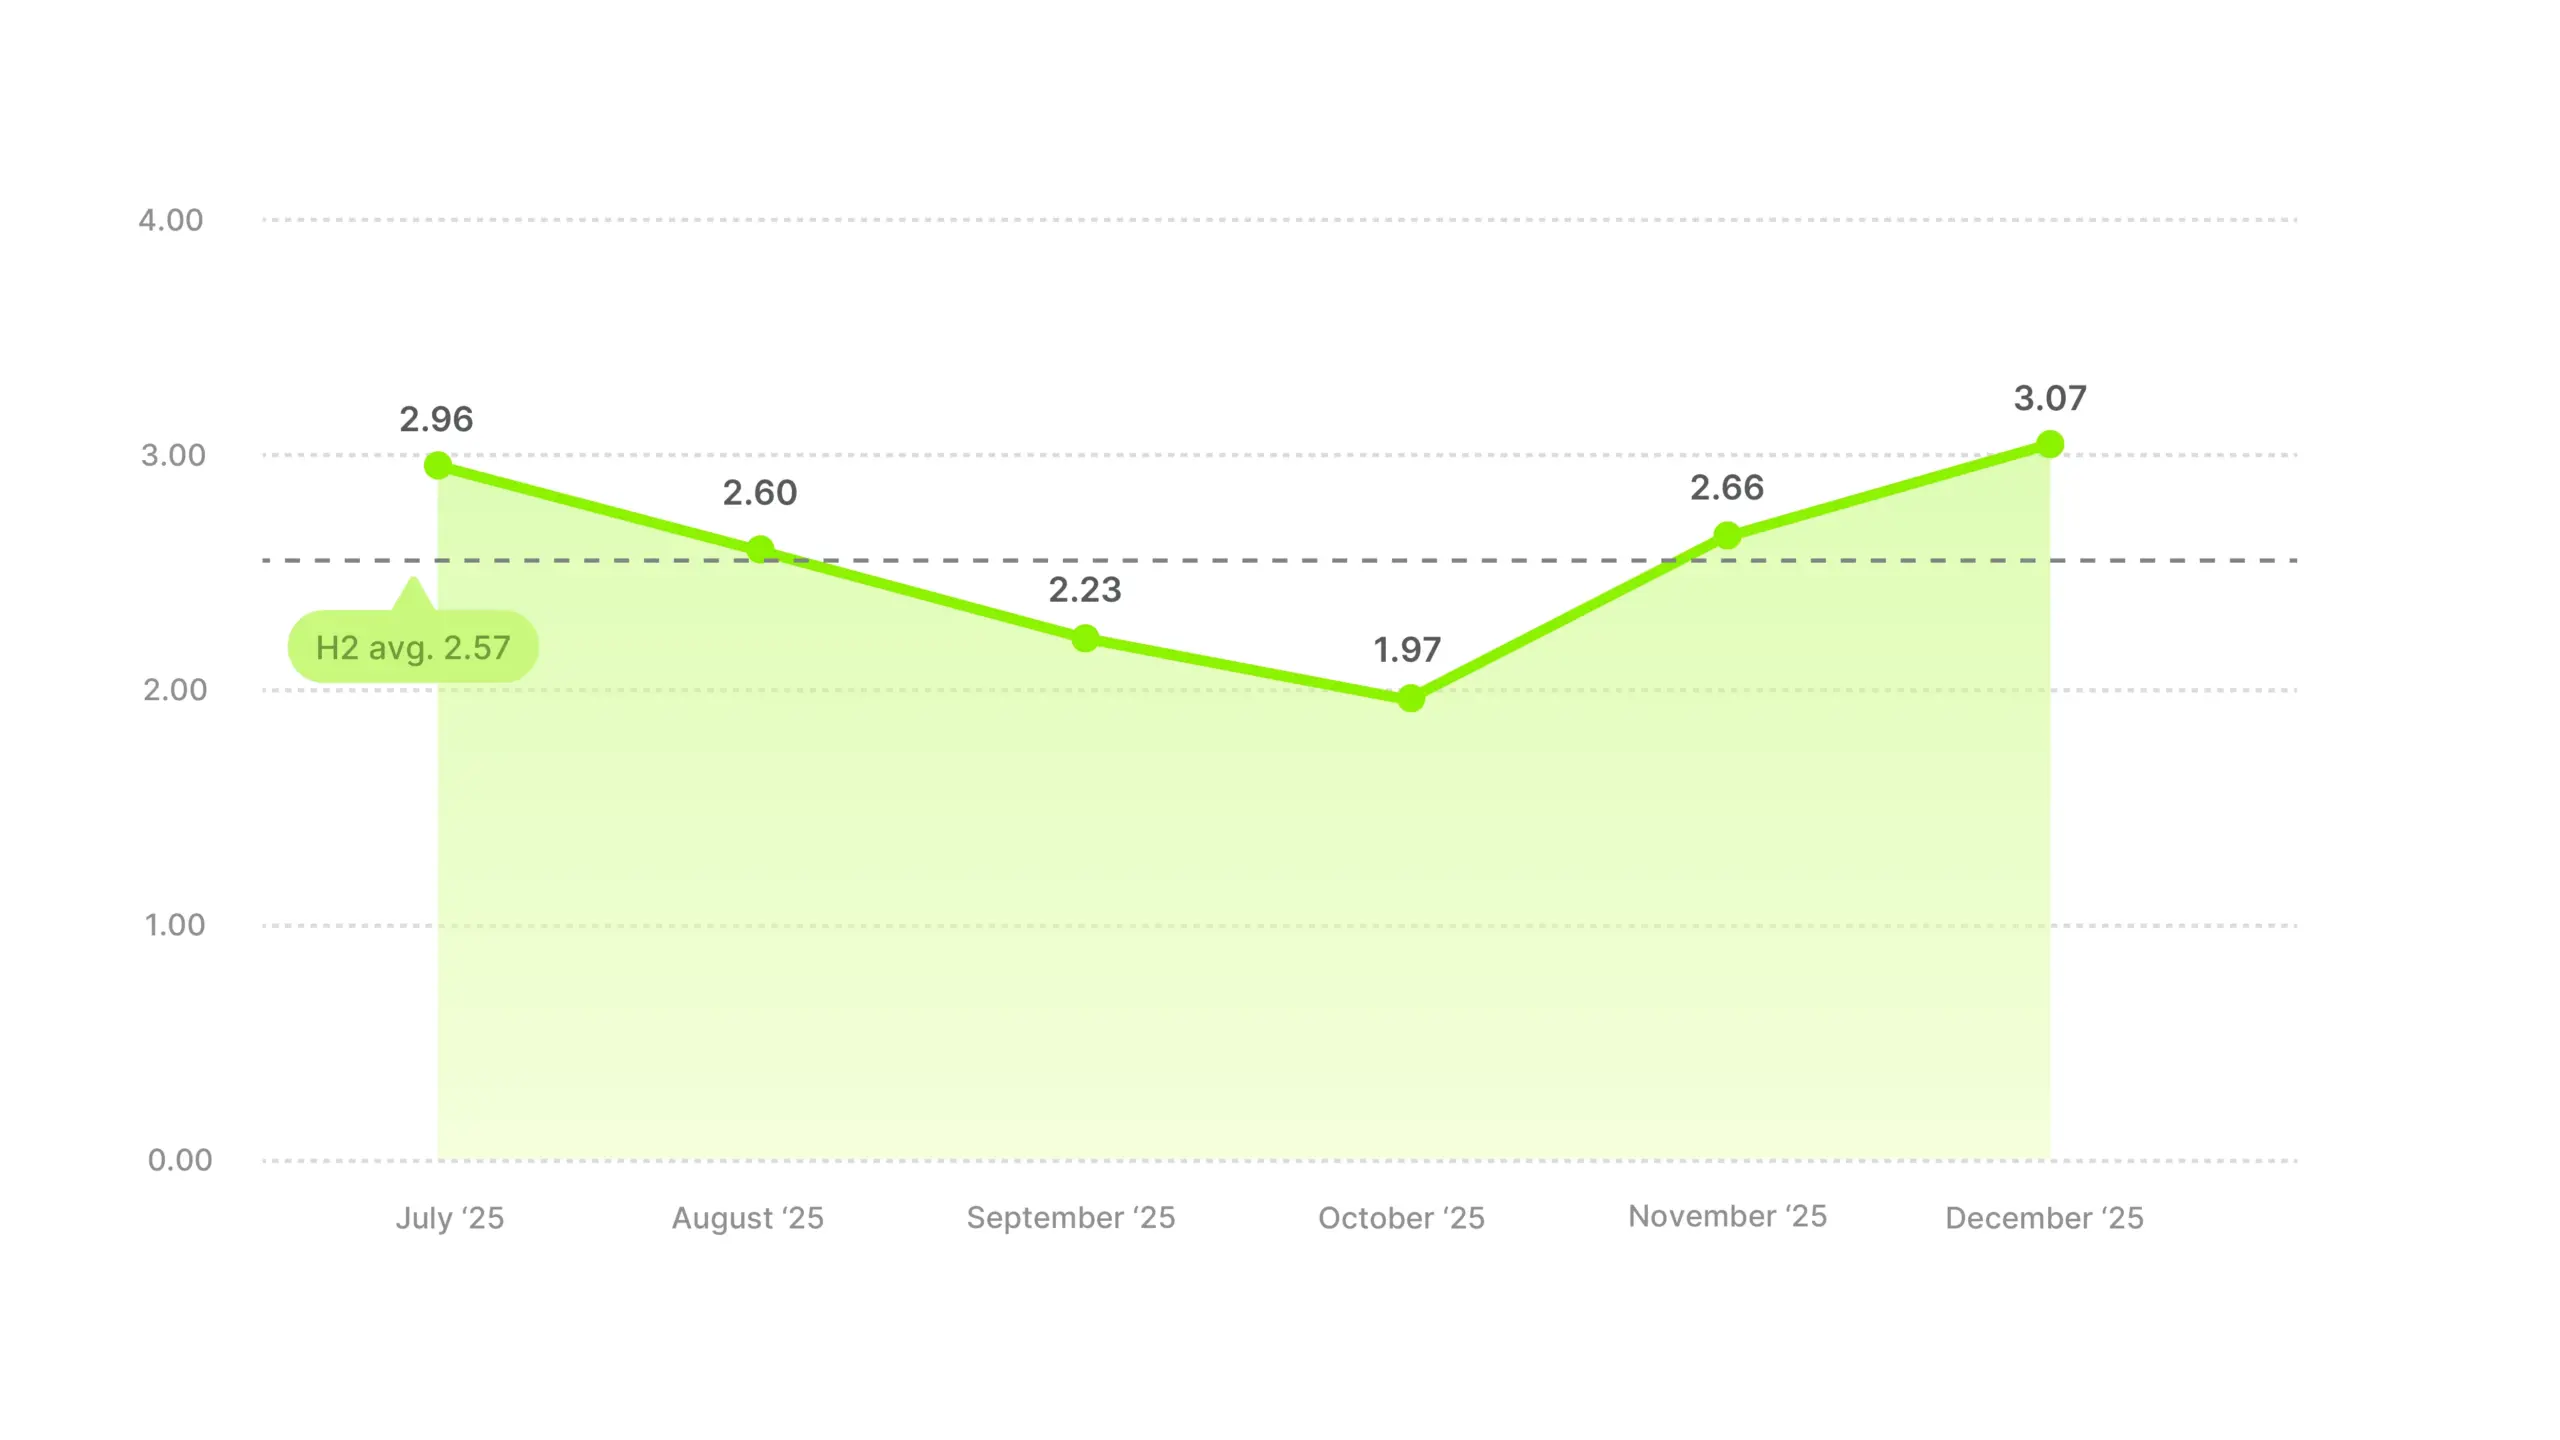
July at 2.96 is the summer peak. Then a steady decline: 2.60 in August, 2.23 in September, 1.97 in October. That’s roughly a 33% drop from July to October.
November rebounds to 2.66 then December climbs to 3.07, the highest ROAS of any month in H2 for the category, and above where it started in July. That’s different from most categories where November leads. Food & Beverages is a holiday hosting and gifting vertical, which probably drives December harder than Black Friday does.
The cross-metric picture is worth noting. Food & Beverages landed above average on hook rate at 25.47%, dropped below the line on CTR at 1.51%, and lands above the line on ROAS. Summer is when attention peaks for the category, per our hook rate data. But the ROAS pattern says the conversion calendar runs separately from the attention calendar, and December is where the two finally align.
December, not November, is the strongest month here. If you’re front-loading spend for Black Friday, the better window is probably right after it instead. Hosting season seems to convert better than discount season for this vertical.
Health & Beauty is the biggest cross-metric surprise in our data. It led hook rate at 28.34%. It tied for top CTR at 1.90%. Its ROAS of 2.12 sits below the overall H2 average of 2.41. People stop, people click, but the conversion step is where the category seems to be lacking.
Industry ROAS average
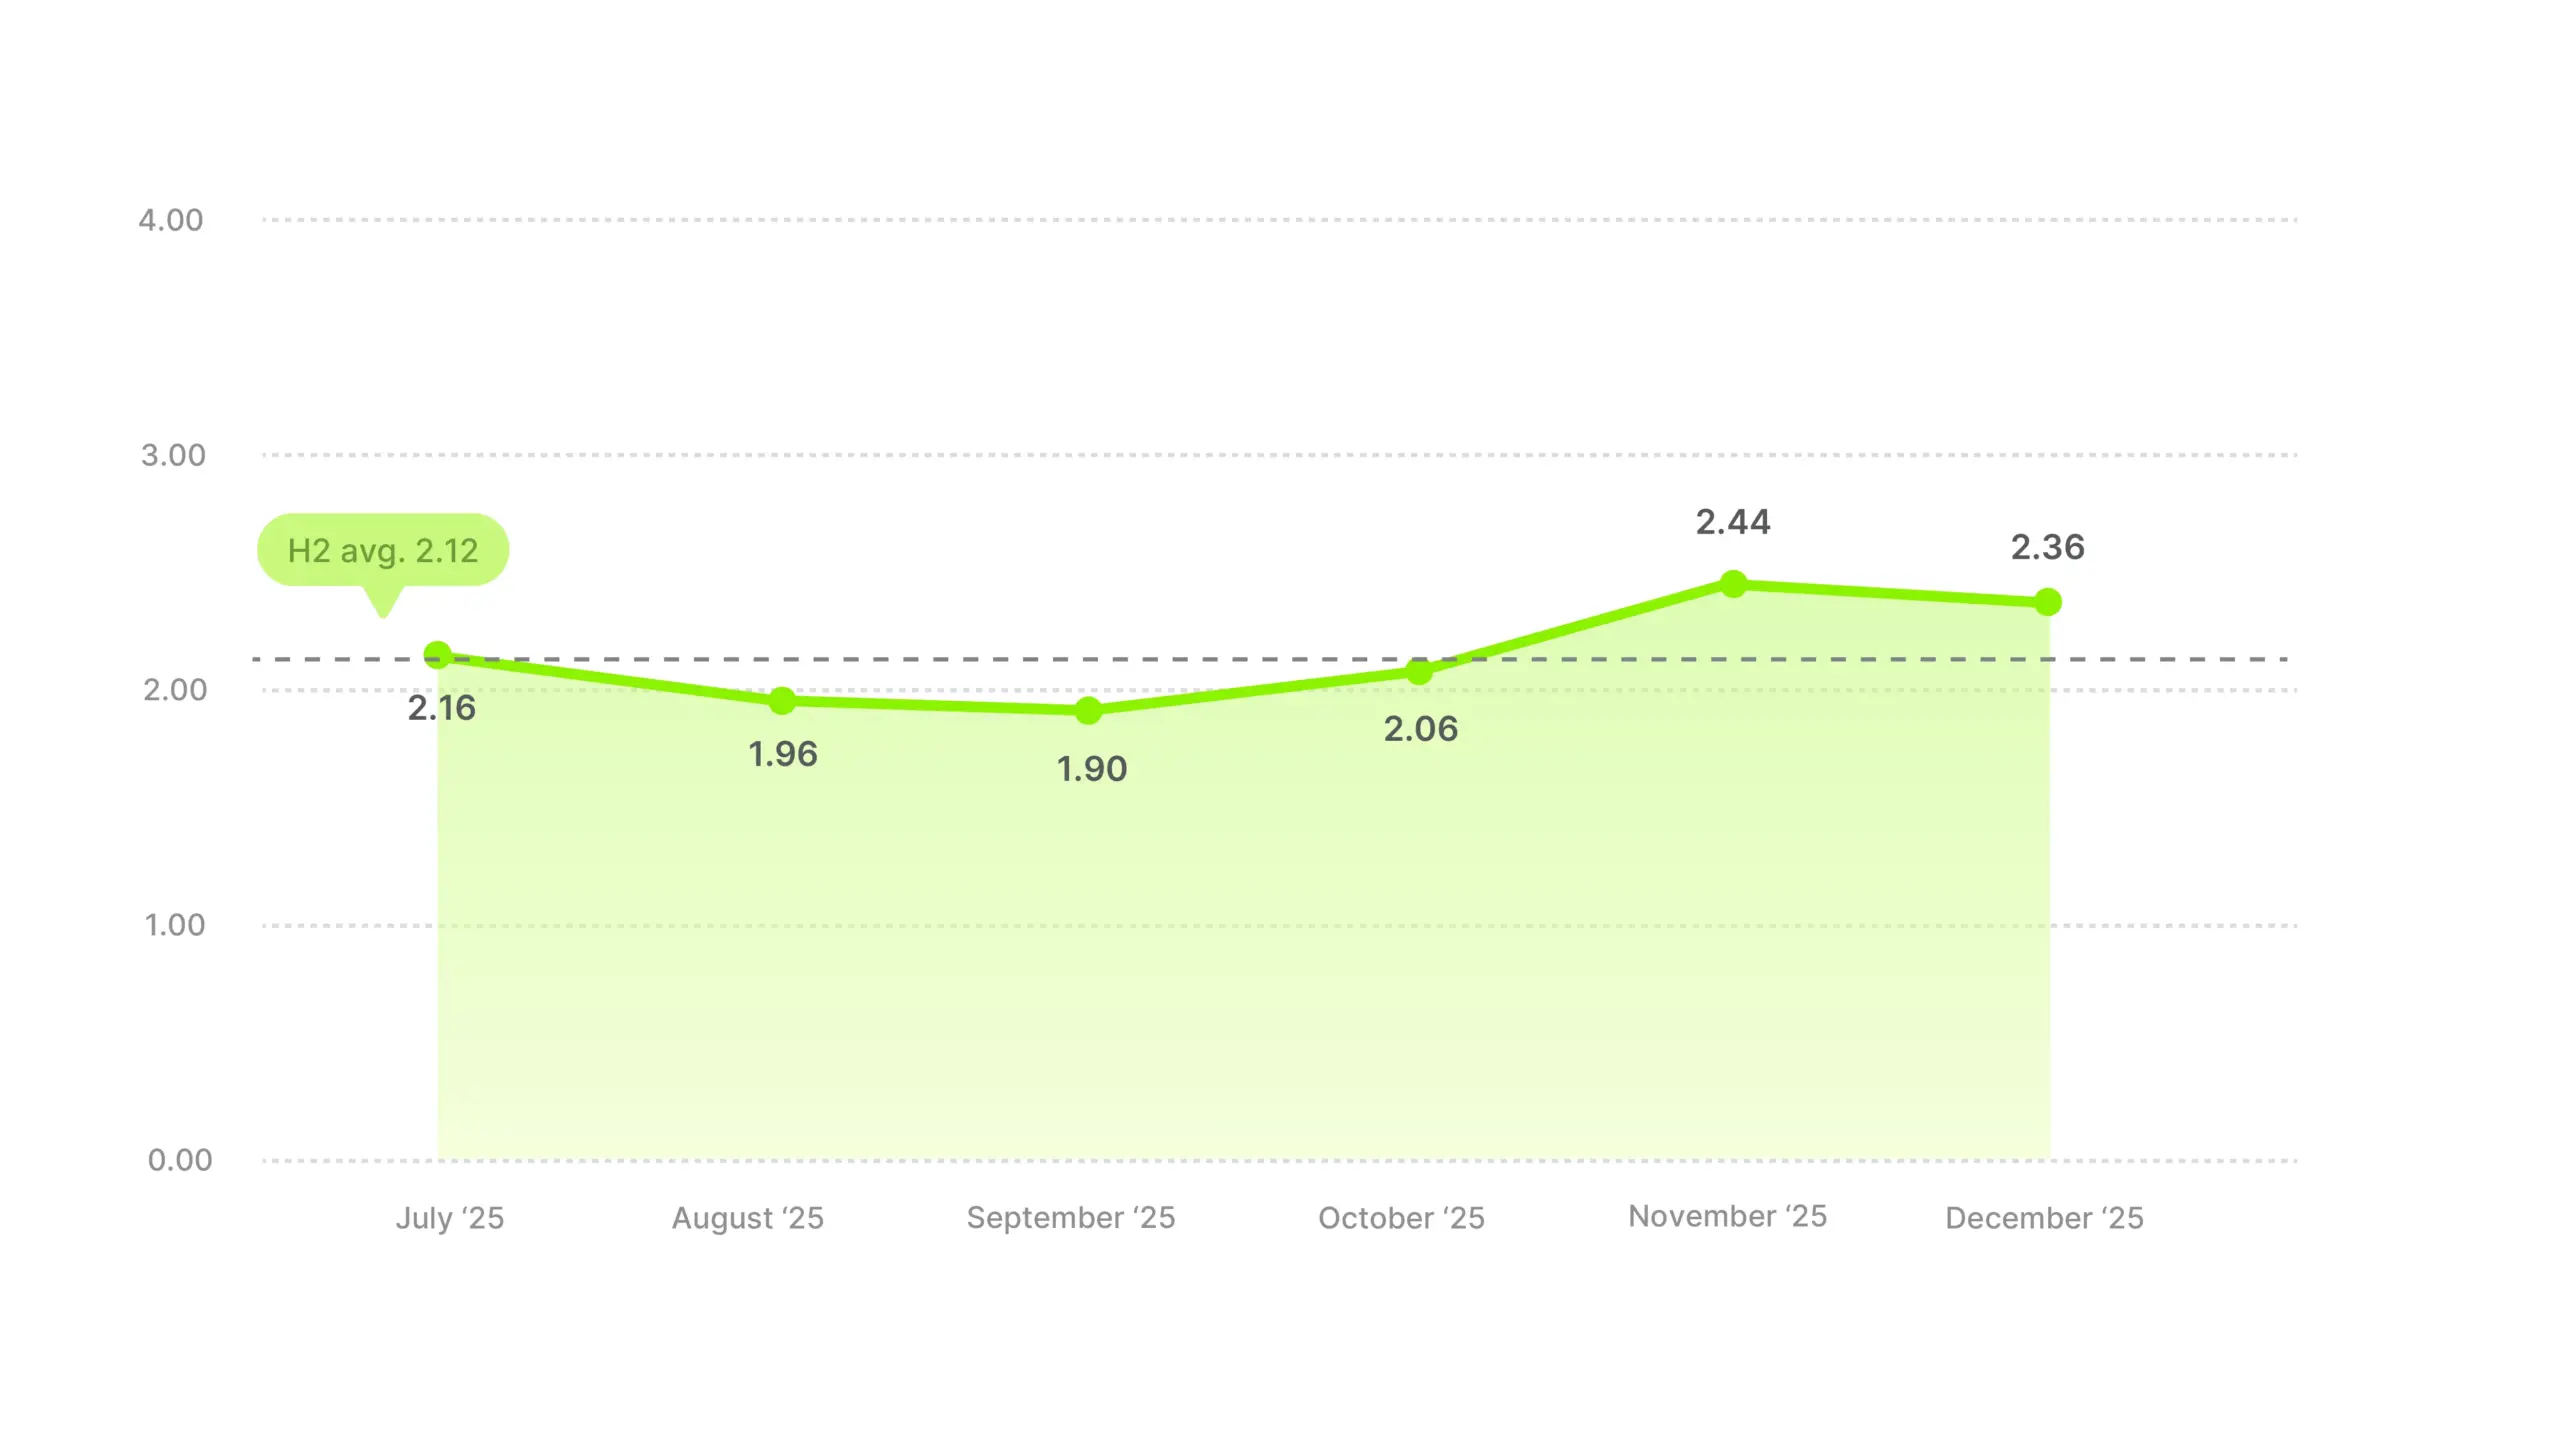
September is the bottom at 1.90. Feed saturation likely played a role, with lots of brands competing for the same viewers, with returns diluted for everyone.
Meanwhile, November’s ROAS peaks at 2.44, just above the market H2 average. The cleaner feed probably helped, but the bigger boost likely comes from the holiday gifting cycle (skincare sets, fragrance, beauty kits) meeting the category’s already-strong baseline interest.
The monthly spread across H2 is 0.54, narrow by category standards. Health & Beauty is steady, predictable, and low-volatility for ROAS. No dramatic swings, which also means no big ROAS increases either.
Don’t expect Q4 to rescue you the way it lifts Toys & Games or Arts & Entertainment. The path to higher ROAS here likely runs through conversion, not creative, especially since the top of the funnel is already doing its job.
Home & Garden averaged 3.43, the third-highest category in the dataset. But that average is inflated by a single outlier month, and the whole picture looks quite different.
Industry ROAS average
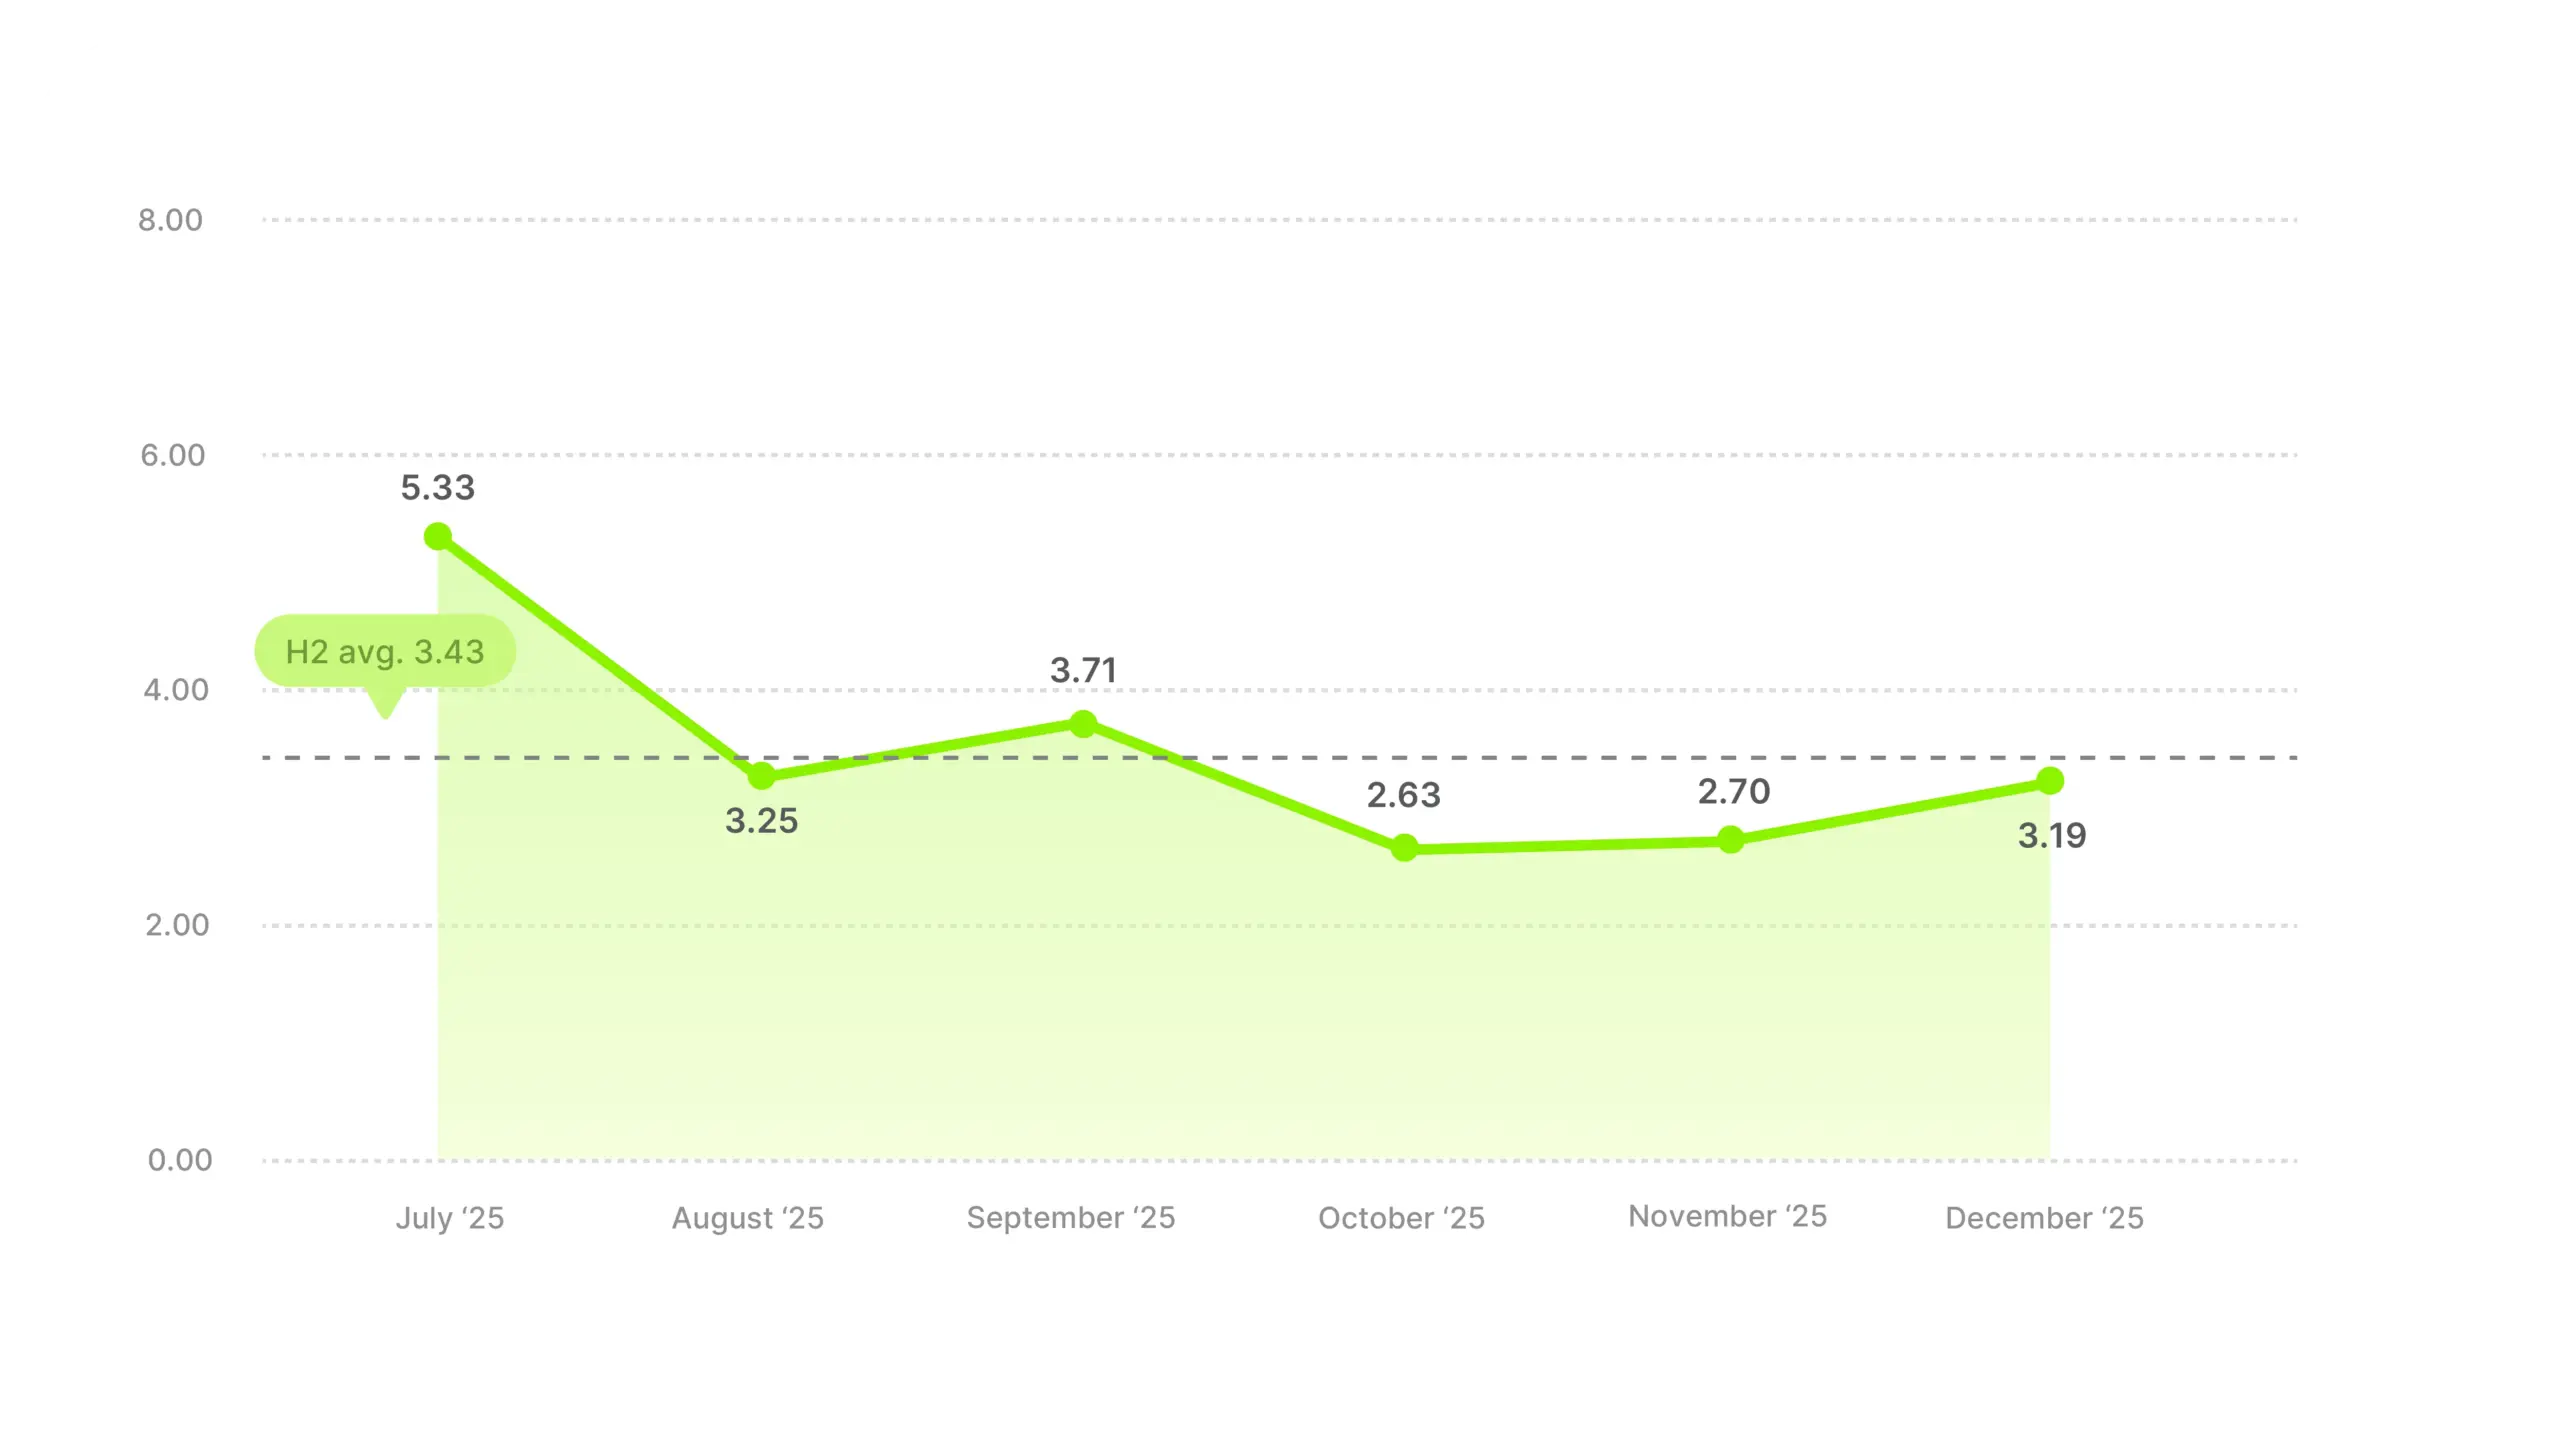
July delivered a 5.33 ROAS, the standout number across any single month and any category we measured. Then it fell to 3.25 in August, a 39% drop inside of four weeks. Strip July out and the category average sits closer to 3.10.
The rest of H2 looks more normal. September recovers slightly to 3.71. October dips to 2.63 (the pre-Black Friday pattern shows up here too). November at 2.70 and December at 3.19 bounce back a little, but neither month touches July’s peak.
September’s recovery probably comes from back-to-school buyers. Home office setups, desks, and dorm furniture all sit inside Home & Garden, and the timing lines up with households resetting routines after summer. November and December likely run on Christmas decor – trees, lights, wreaths, outdoor displays, plus hosting gear for holiday gatherings.
Summer is probably this category’s primary season, not Q4, and it makes sense. Outdoor projects, patio and garden season, renovations, people spending time at home and wanting to upgrade it. Buying intent tends to be organic during that stretch, and competition for attention seems to be lower than it gets later in the year.
November is the volume peak even though ROAS dips slightly. A familiar Q4 pattern looks something like this: more spend going in, more total purchases coming out, slightly lower return per dollar, which is a similar trade-off to Apparel’s December.
Don’t let Q4 planning overshadow summer here. The July efficiency window is the one most calendar-driven brands probably aren’t competing in, and the data says intent runs organically strong there without the December noise.
Services averaged 2.44, exactly on the H2 cross-industry line. But the monthly pattern is unlike almost any other category in the dataset.
Industry ROAS average
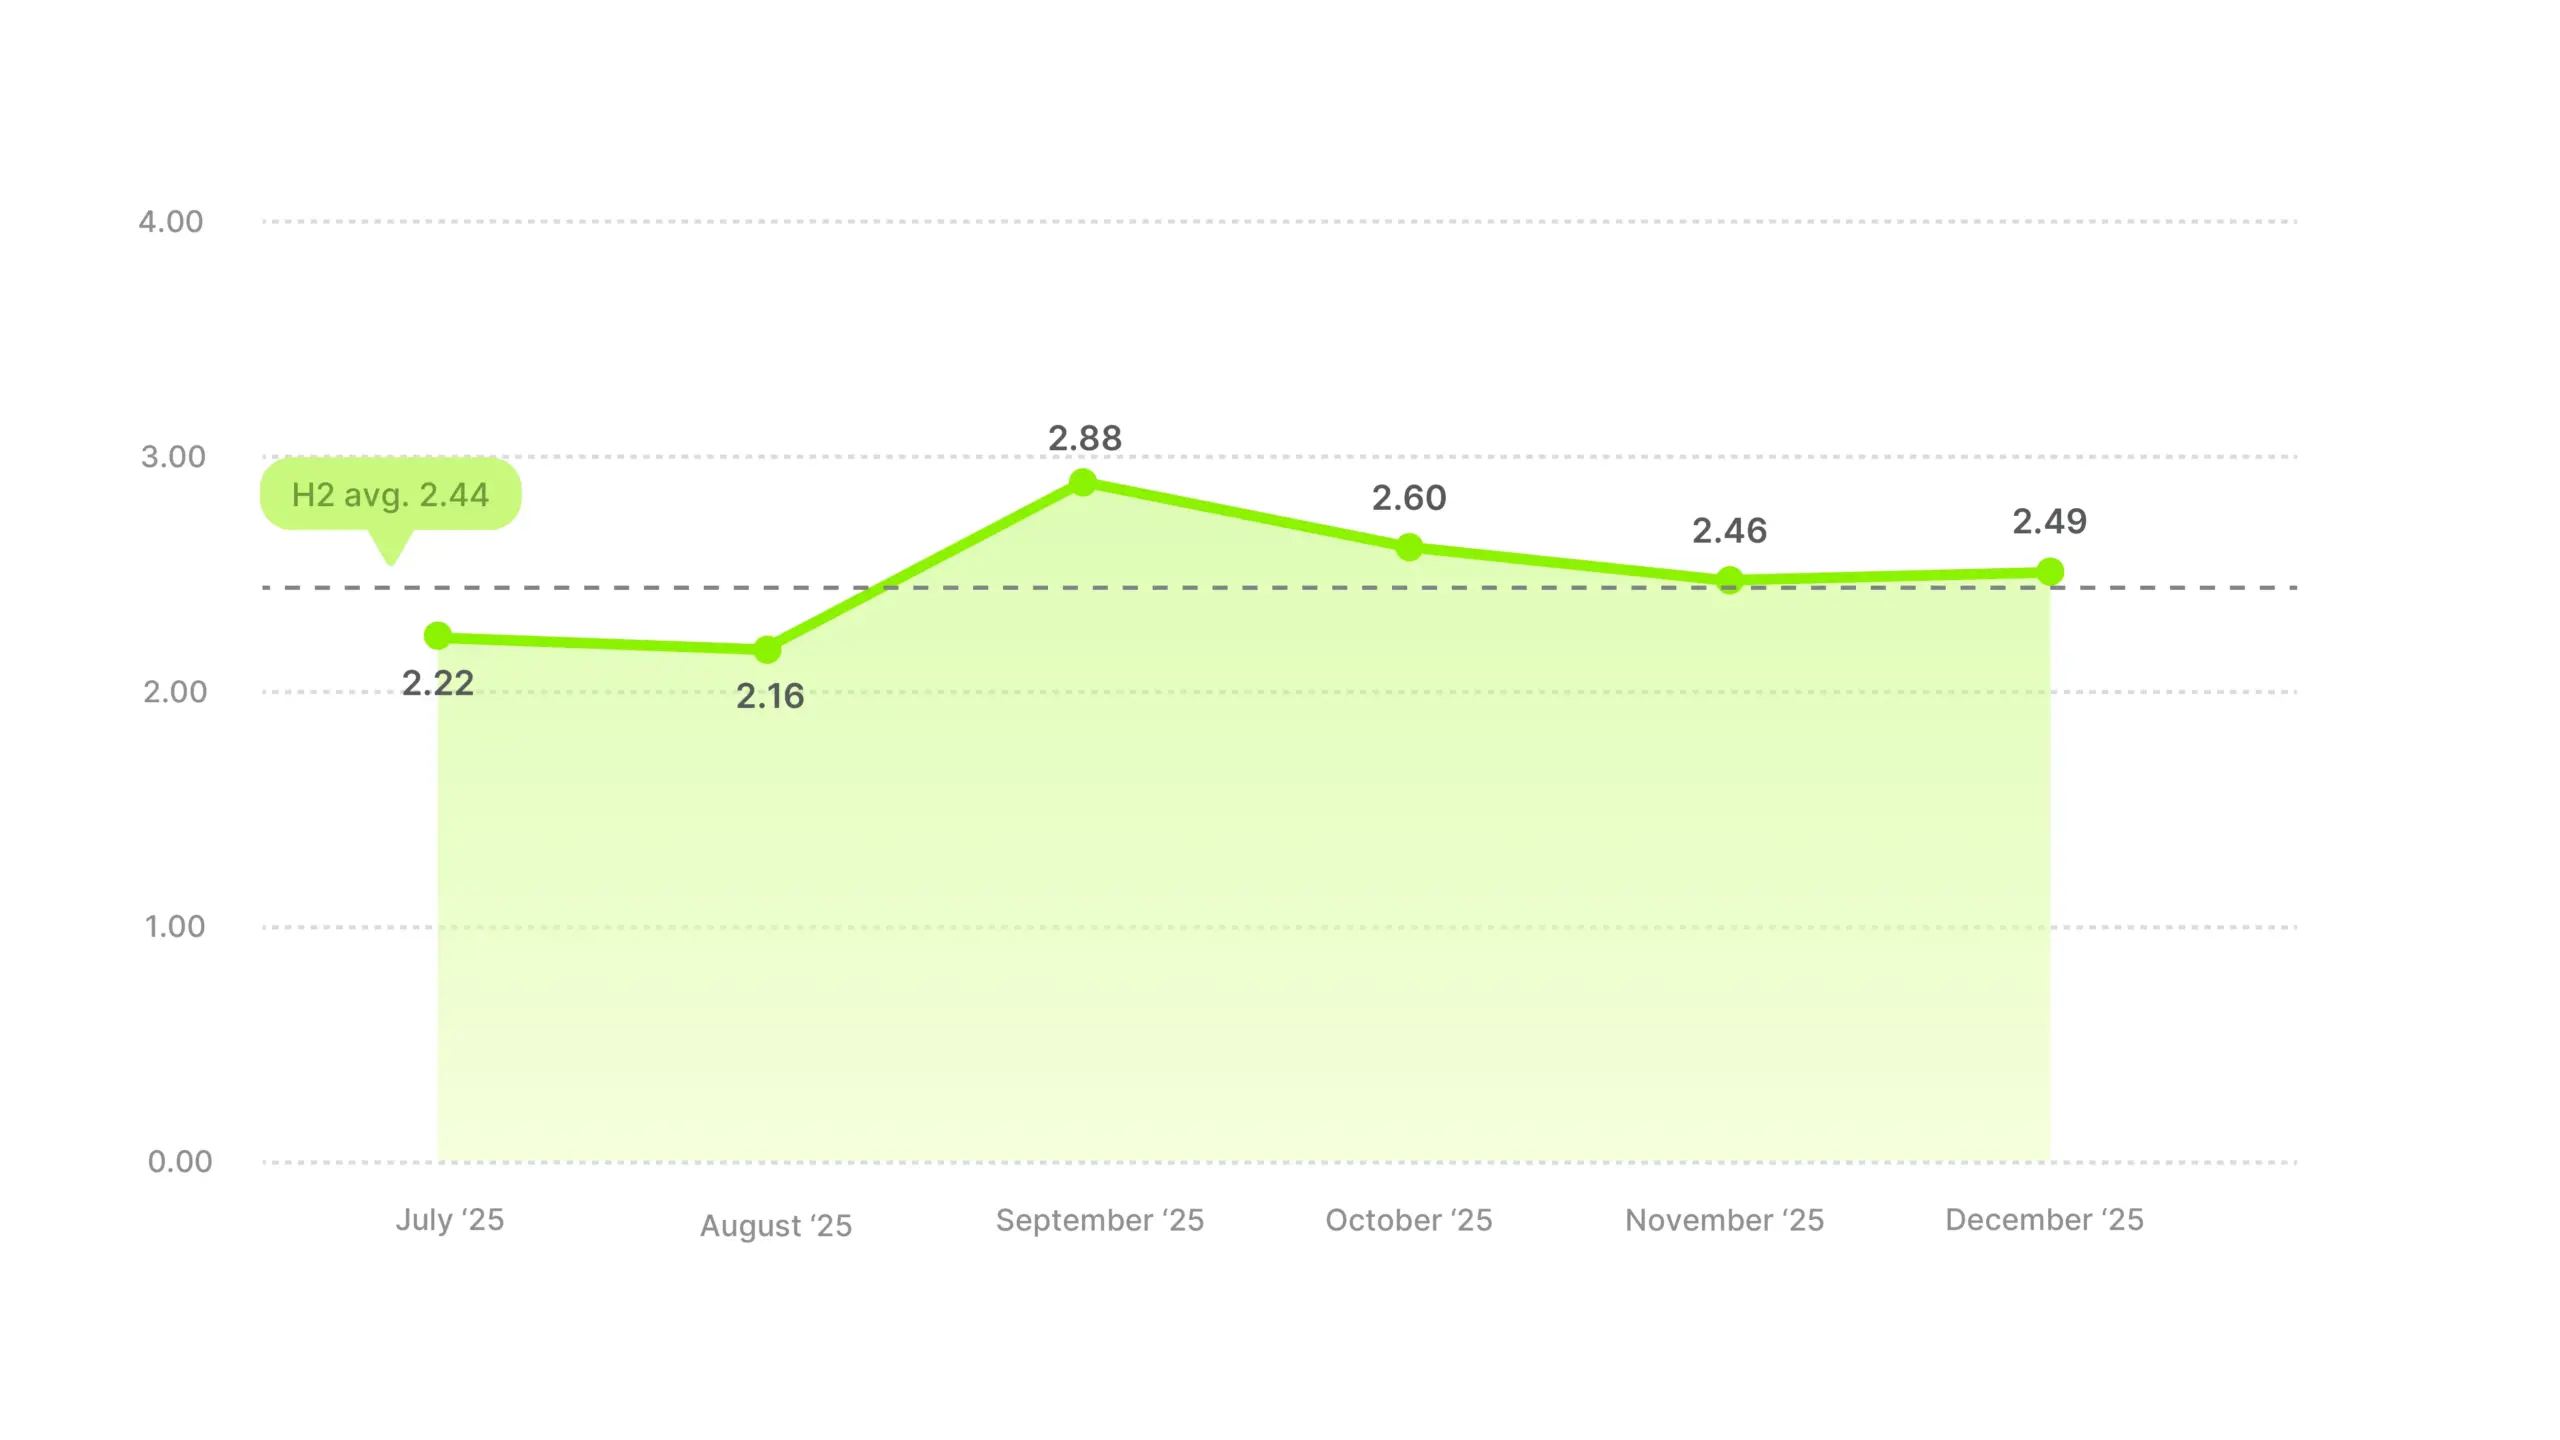
The spread is narrow (0.72 across six months), and no month drops dramatically. Even the weakest month (August at 2.16) still clears a solid return. Services is the most stable, lowest-volatility category for ROAS we measured.
September is the peak at 2.88, not November or December. That’s backwards from most of the dataset. The likely reason is a back-to-business cycle.
People sign up for subscriptions, memberships, and service contracts as summer ends. The Q4 consumer intent that lifts other categories doesn’t seem to apply here, probably because services aren’t really gifted.
November (2.46) and December (2.49) are basically flat with each other and just above the H2 average. Q4 doesn’t hurt, but it doesn’t really lift either.
September is the month to plan around here. Back-to-business intent runs hotter than holiday intent in this category, and spreading budget evenly across H2 misses the concentrated window that actually rewards the spend.
Software averaged 1.73, the second-lowest category in the dataset. Consistent with what our hook rate and CTR data showed, this is a vertical that struggles across every metric.
Industry ROAS average
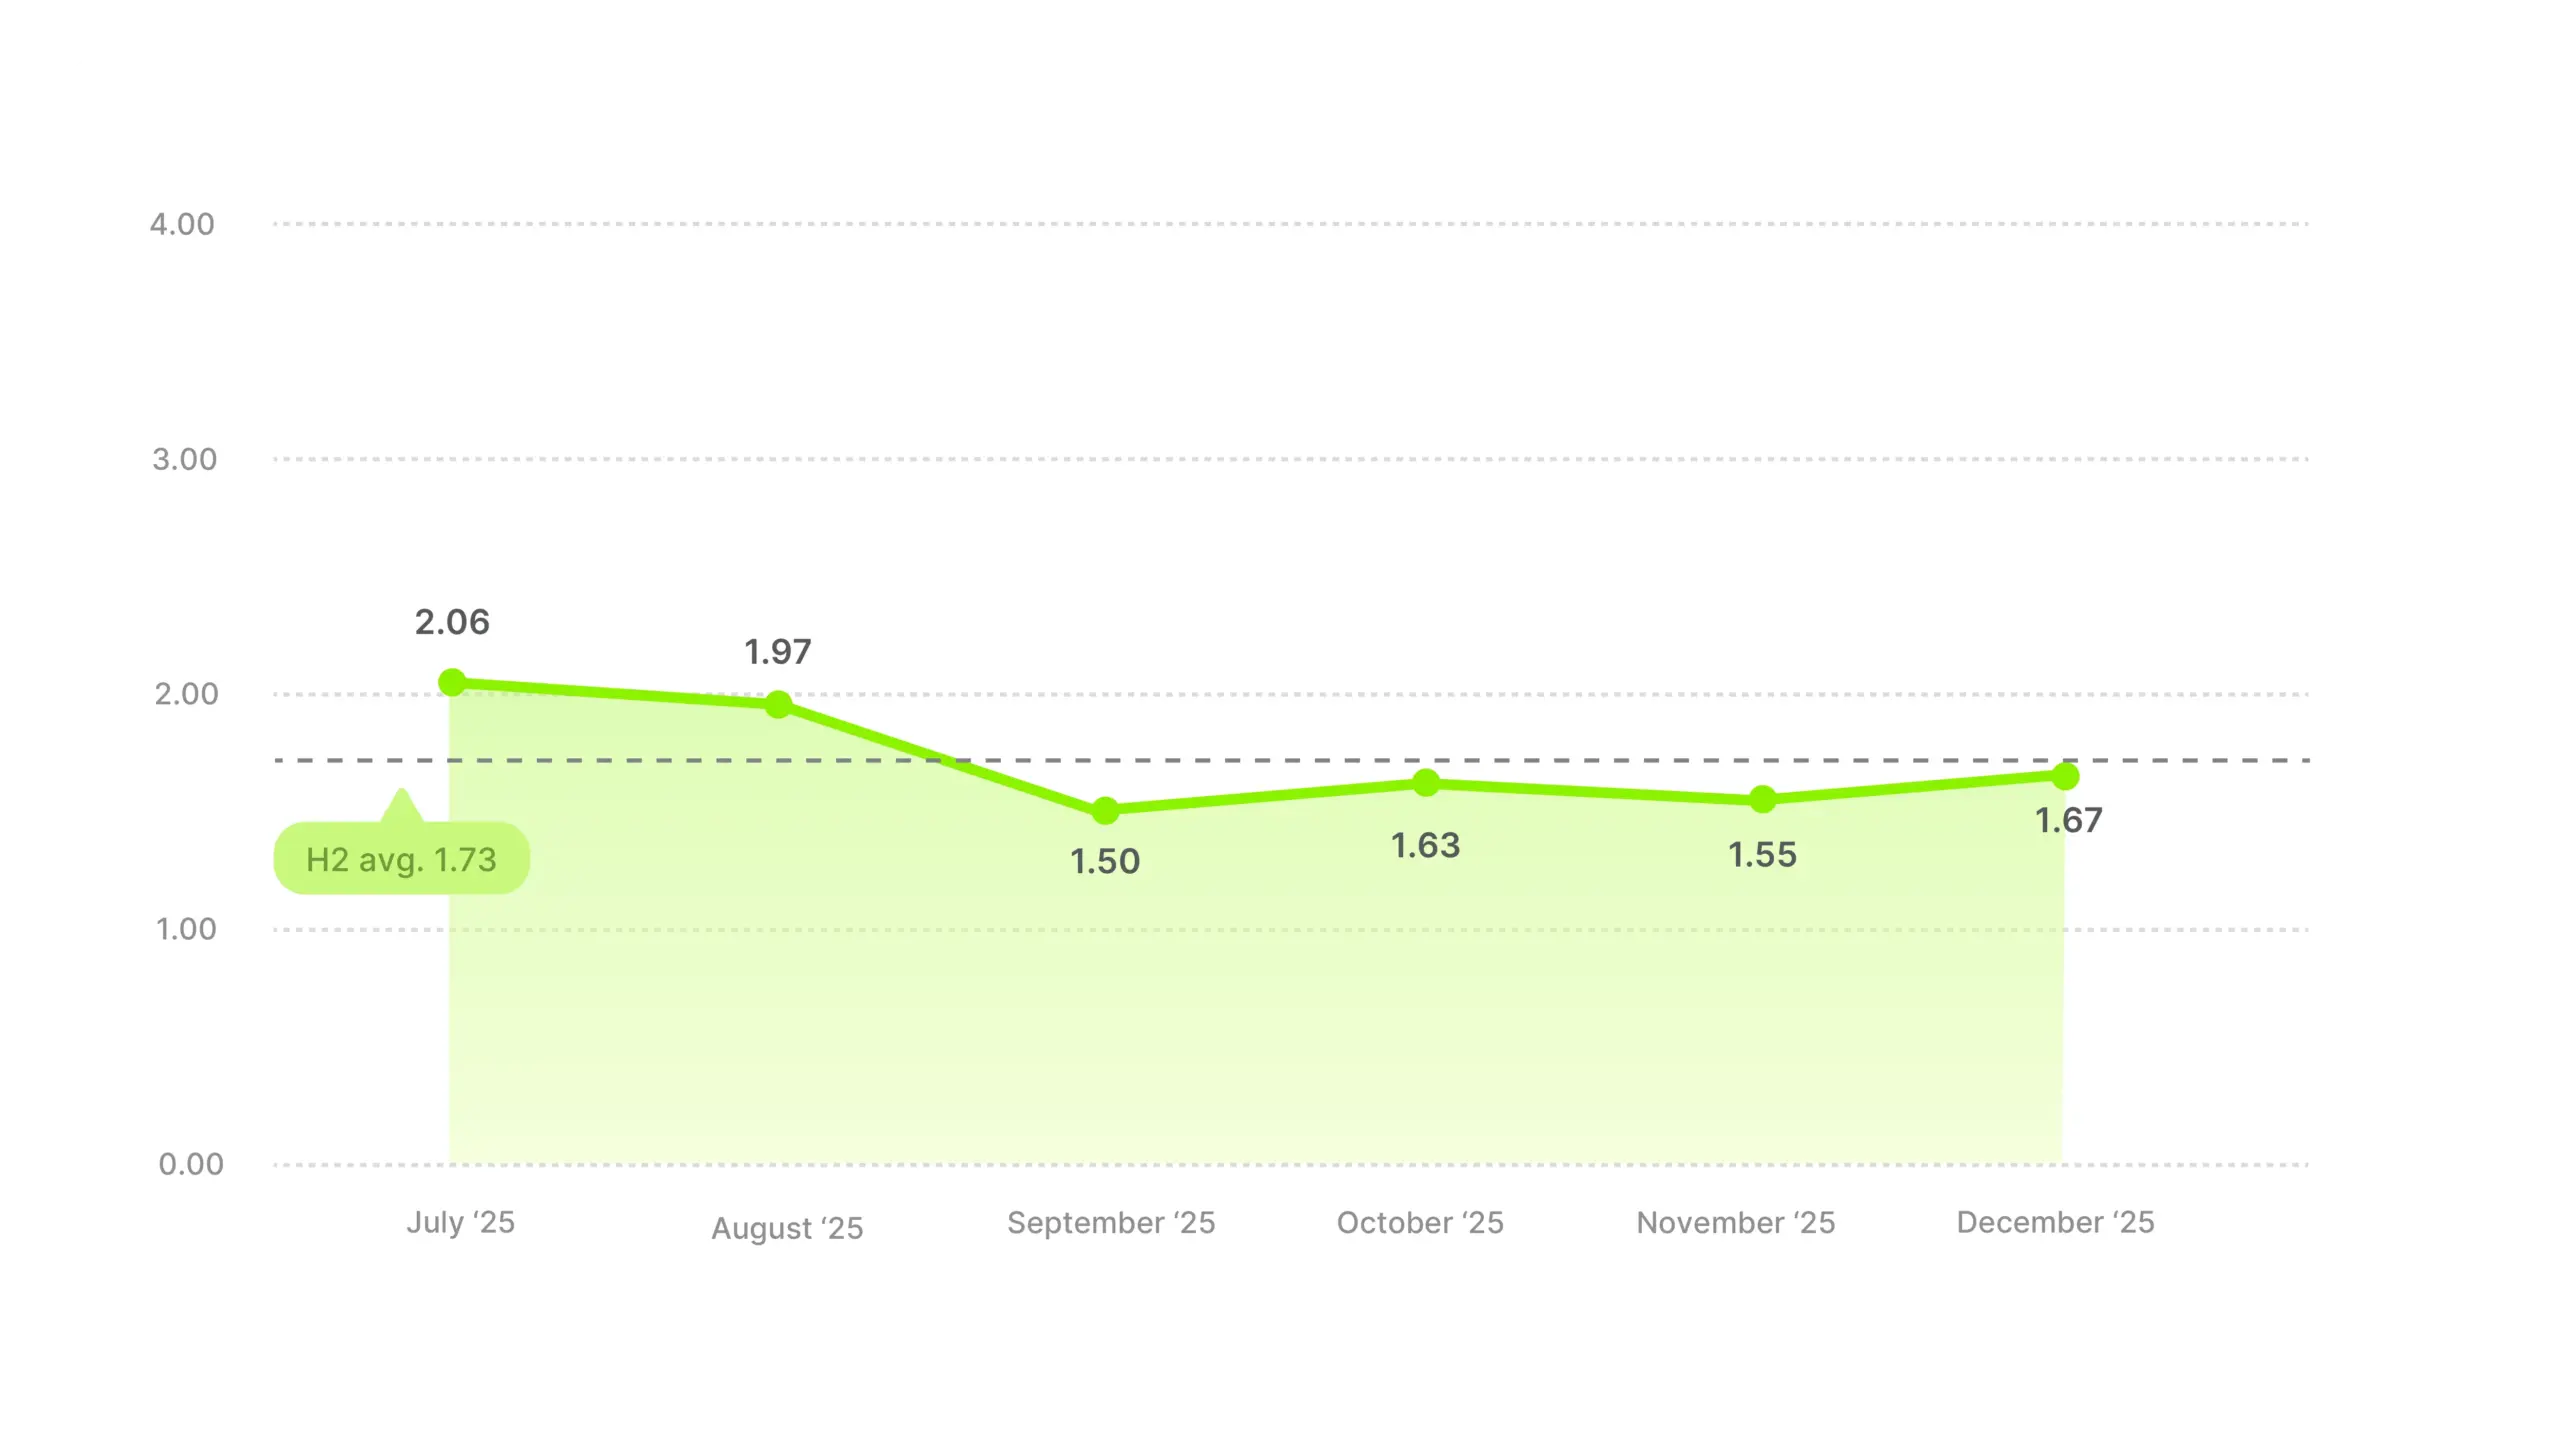
The pattern is a downward step, then flat. July (2.06) and August (1.97) sit in one tier. September (1.50) drops into a lower tier and takes the rest of H2 with it. October (1.63), November (1.55), and December (1.67) stay in that lower band. The drop happens in September and never recovers.
December is the biggest inconsistency in this category. Software’s CTR shot up to 2.28% in December, the biggest month-over-month CTR jump of any category we tracked. But ROAS was at just 1.67. That gap likely points to lower-value conversions, such as free trials, freemium sign-ups, and deep year-end discount offers.
Like Services, Software isn’t a gifting category, and holiday intent doesn’t spill over. November at 1.55 is actually below the category’s own H2 average.
Benchmark against 1.73, not 2.41. And if your December shows strong CTR alongside weak ROAS, the quality of those conversions is probably what’s holding you back, not the click volume.
Sporting Goods averaged 3.66, the second-highest category behind Apparel. The average smooths over one of the wildest monthly swings in the dataset.
Industry ROAS average
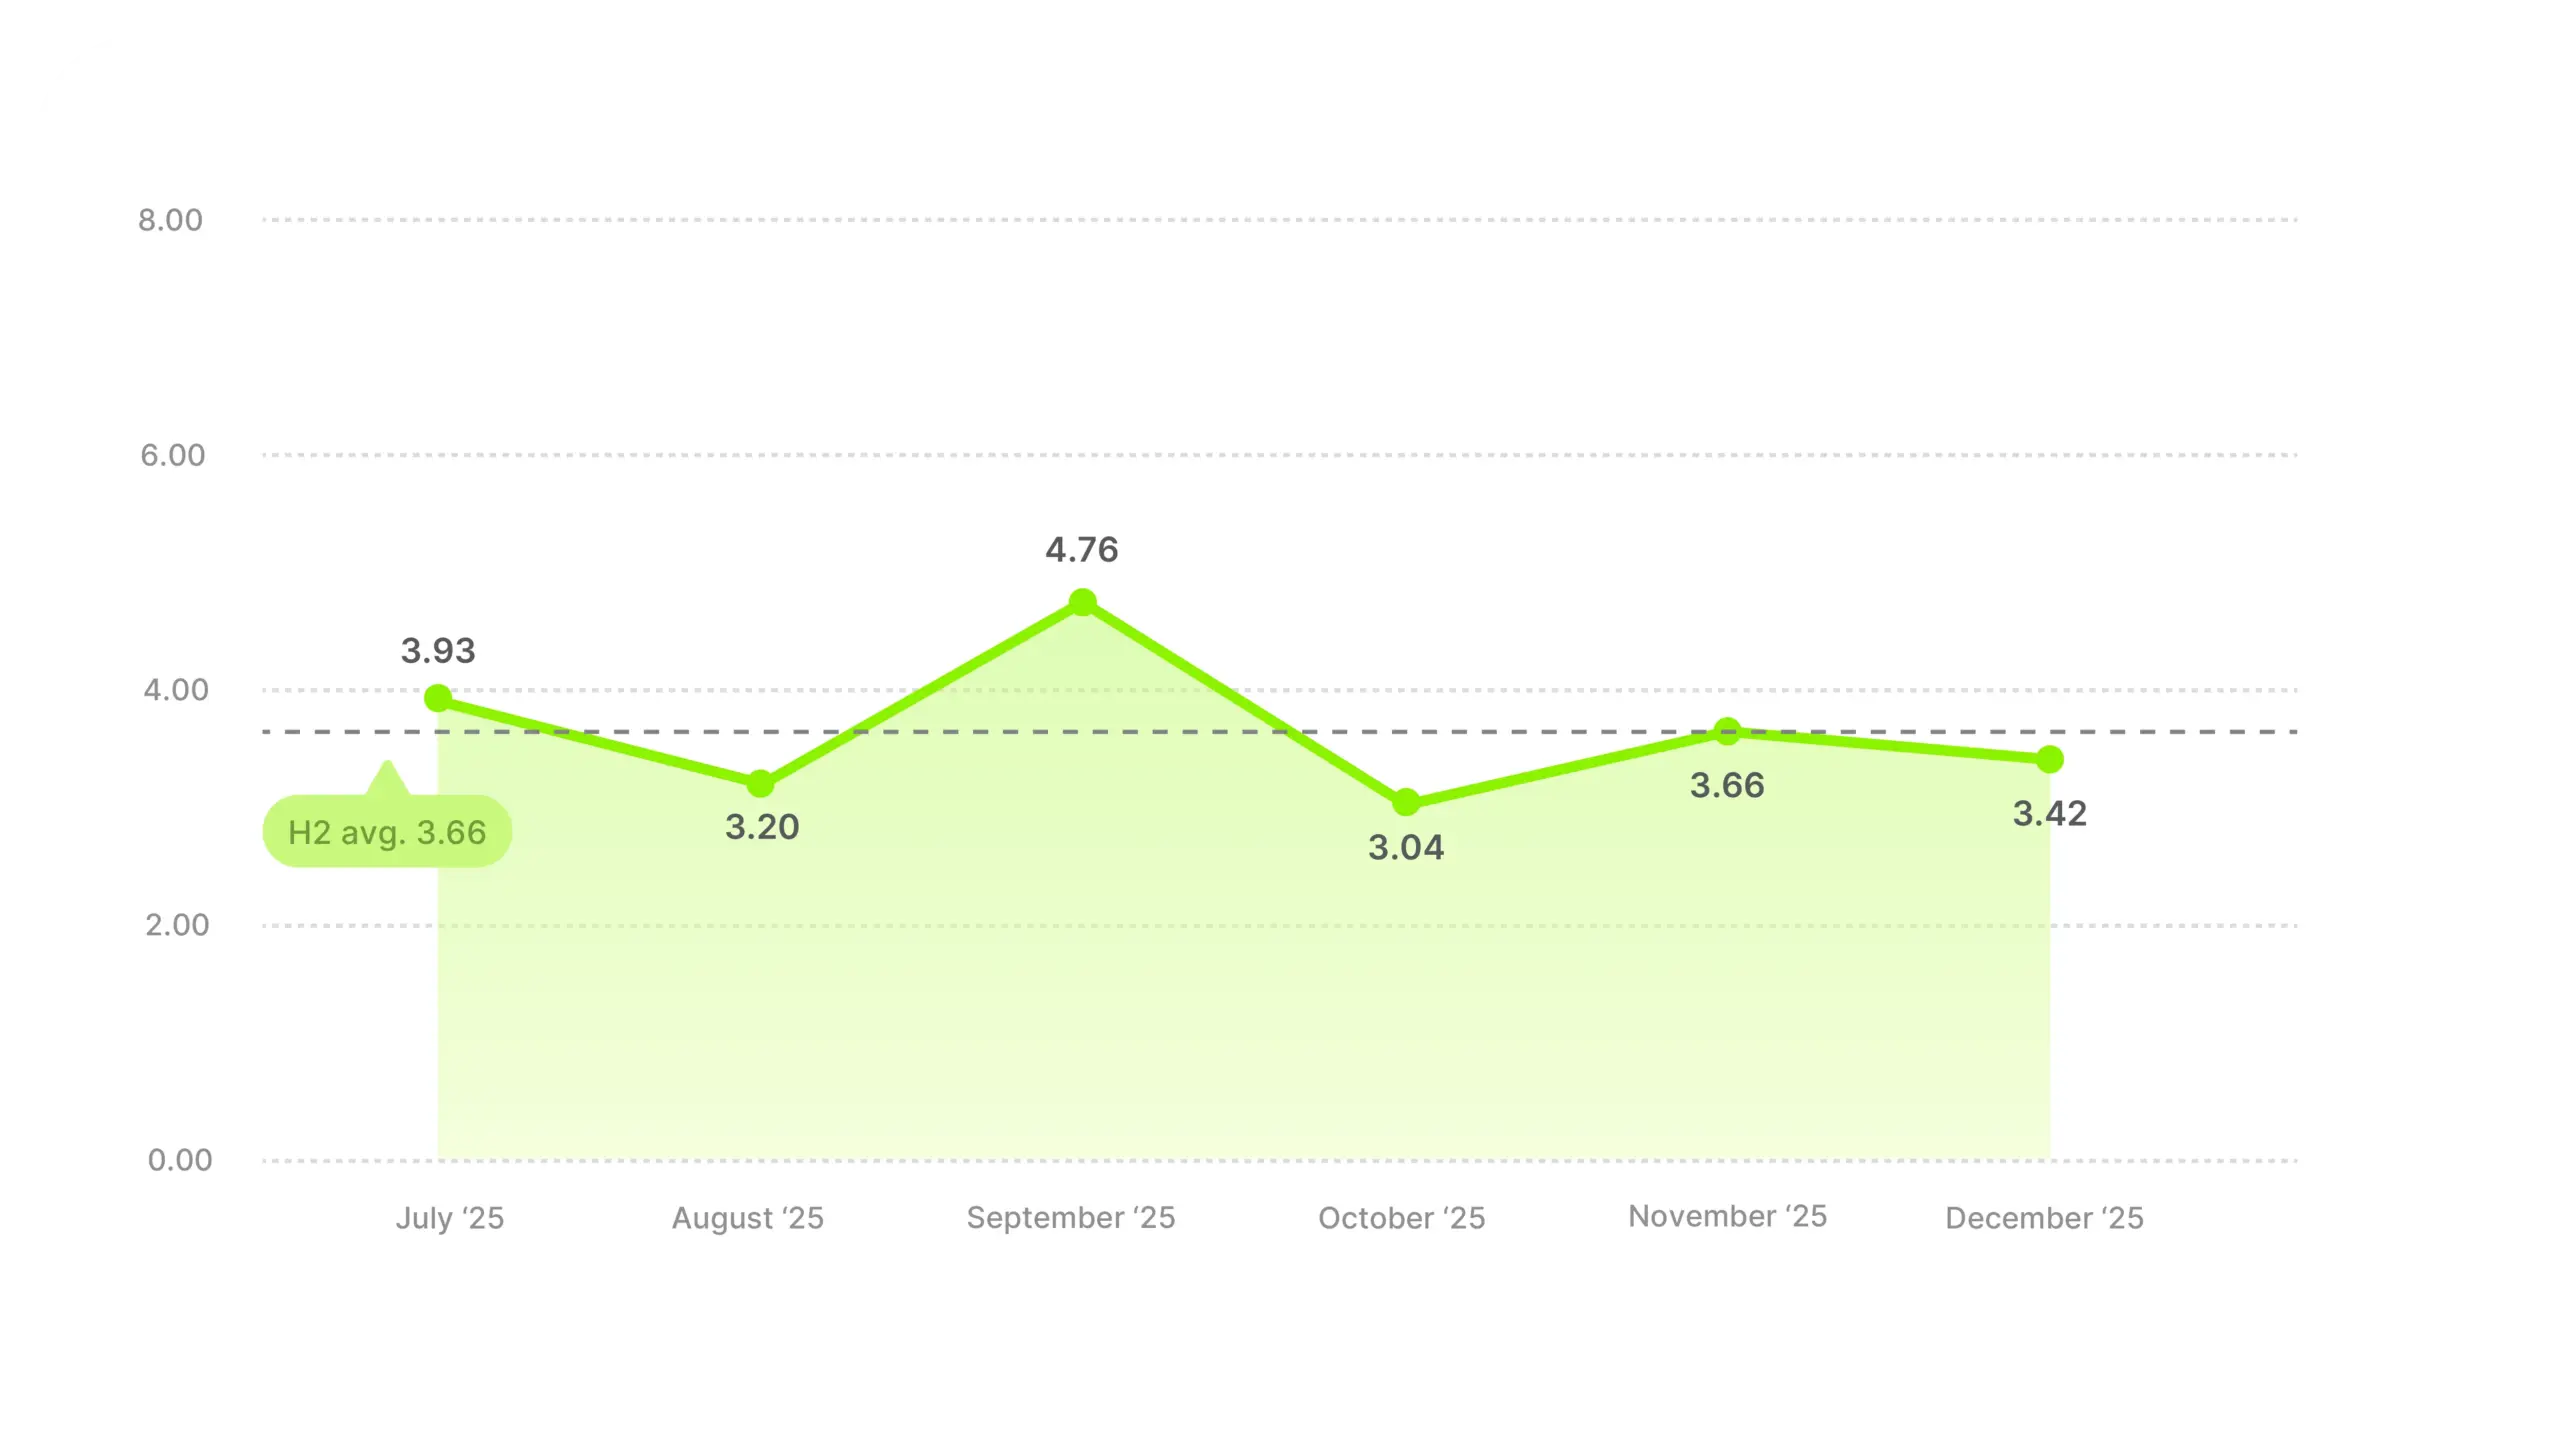
The spread is 1.72 between the best and worst month, massive compared to the overall market’s 0.36. Sporting Goods ROAS swings hard month to month.
September spiked to 4.76, second only to Home & Garden’s July across the entire H2 dataset. The likely driver is back-to-school sports season and the fall activity ramp. Buyers with high intent buying what they need for a new season, not browsing for deals.
October bottoms at 3.04, following the pre-Black Friday dip pattern. Even at the category’s worst month, it’s still well above the overall H2 market average. November (3.66) and December (3.42) scale back up, probably driven by holiday gifting in fitness equipment, outdoor gear, and sports-adjacent gifts.
The CTR data for this category was flat at 1.47% with no seasonal story to speak of. Which could mean the ROAS volatility here isn’t coming from clicks, it’s coming from conversion. When buyers are in intent mode (September, November), they convert hard. When they’re in browse mode, CTR barely moves but ROAS swings wide.
Don’t anchor to any single month in this category. The swings are too big, and even the worst month probably clears most other categories’ best. 3.66 is the average worth planning against, not any individual data point inside the half.
Toys & Games averaged 1.68, among the lowest categories in H2. But the trend undercuts the average completely. This is probably the purest gifting category in the data, and the ramp shows it.
Industry ROAS average
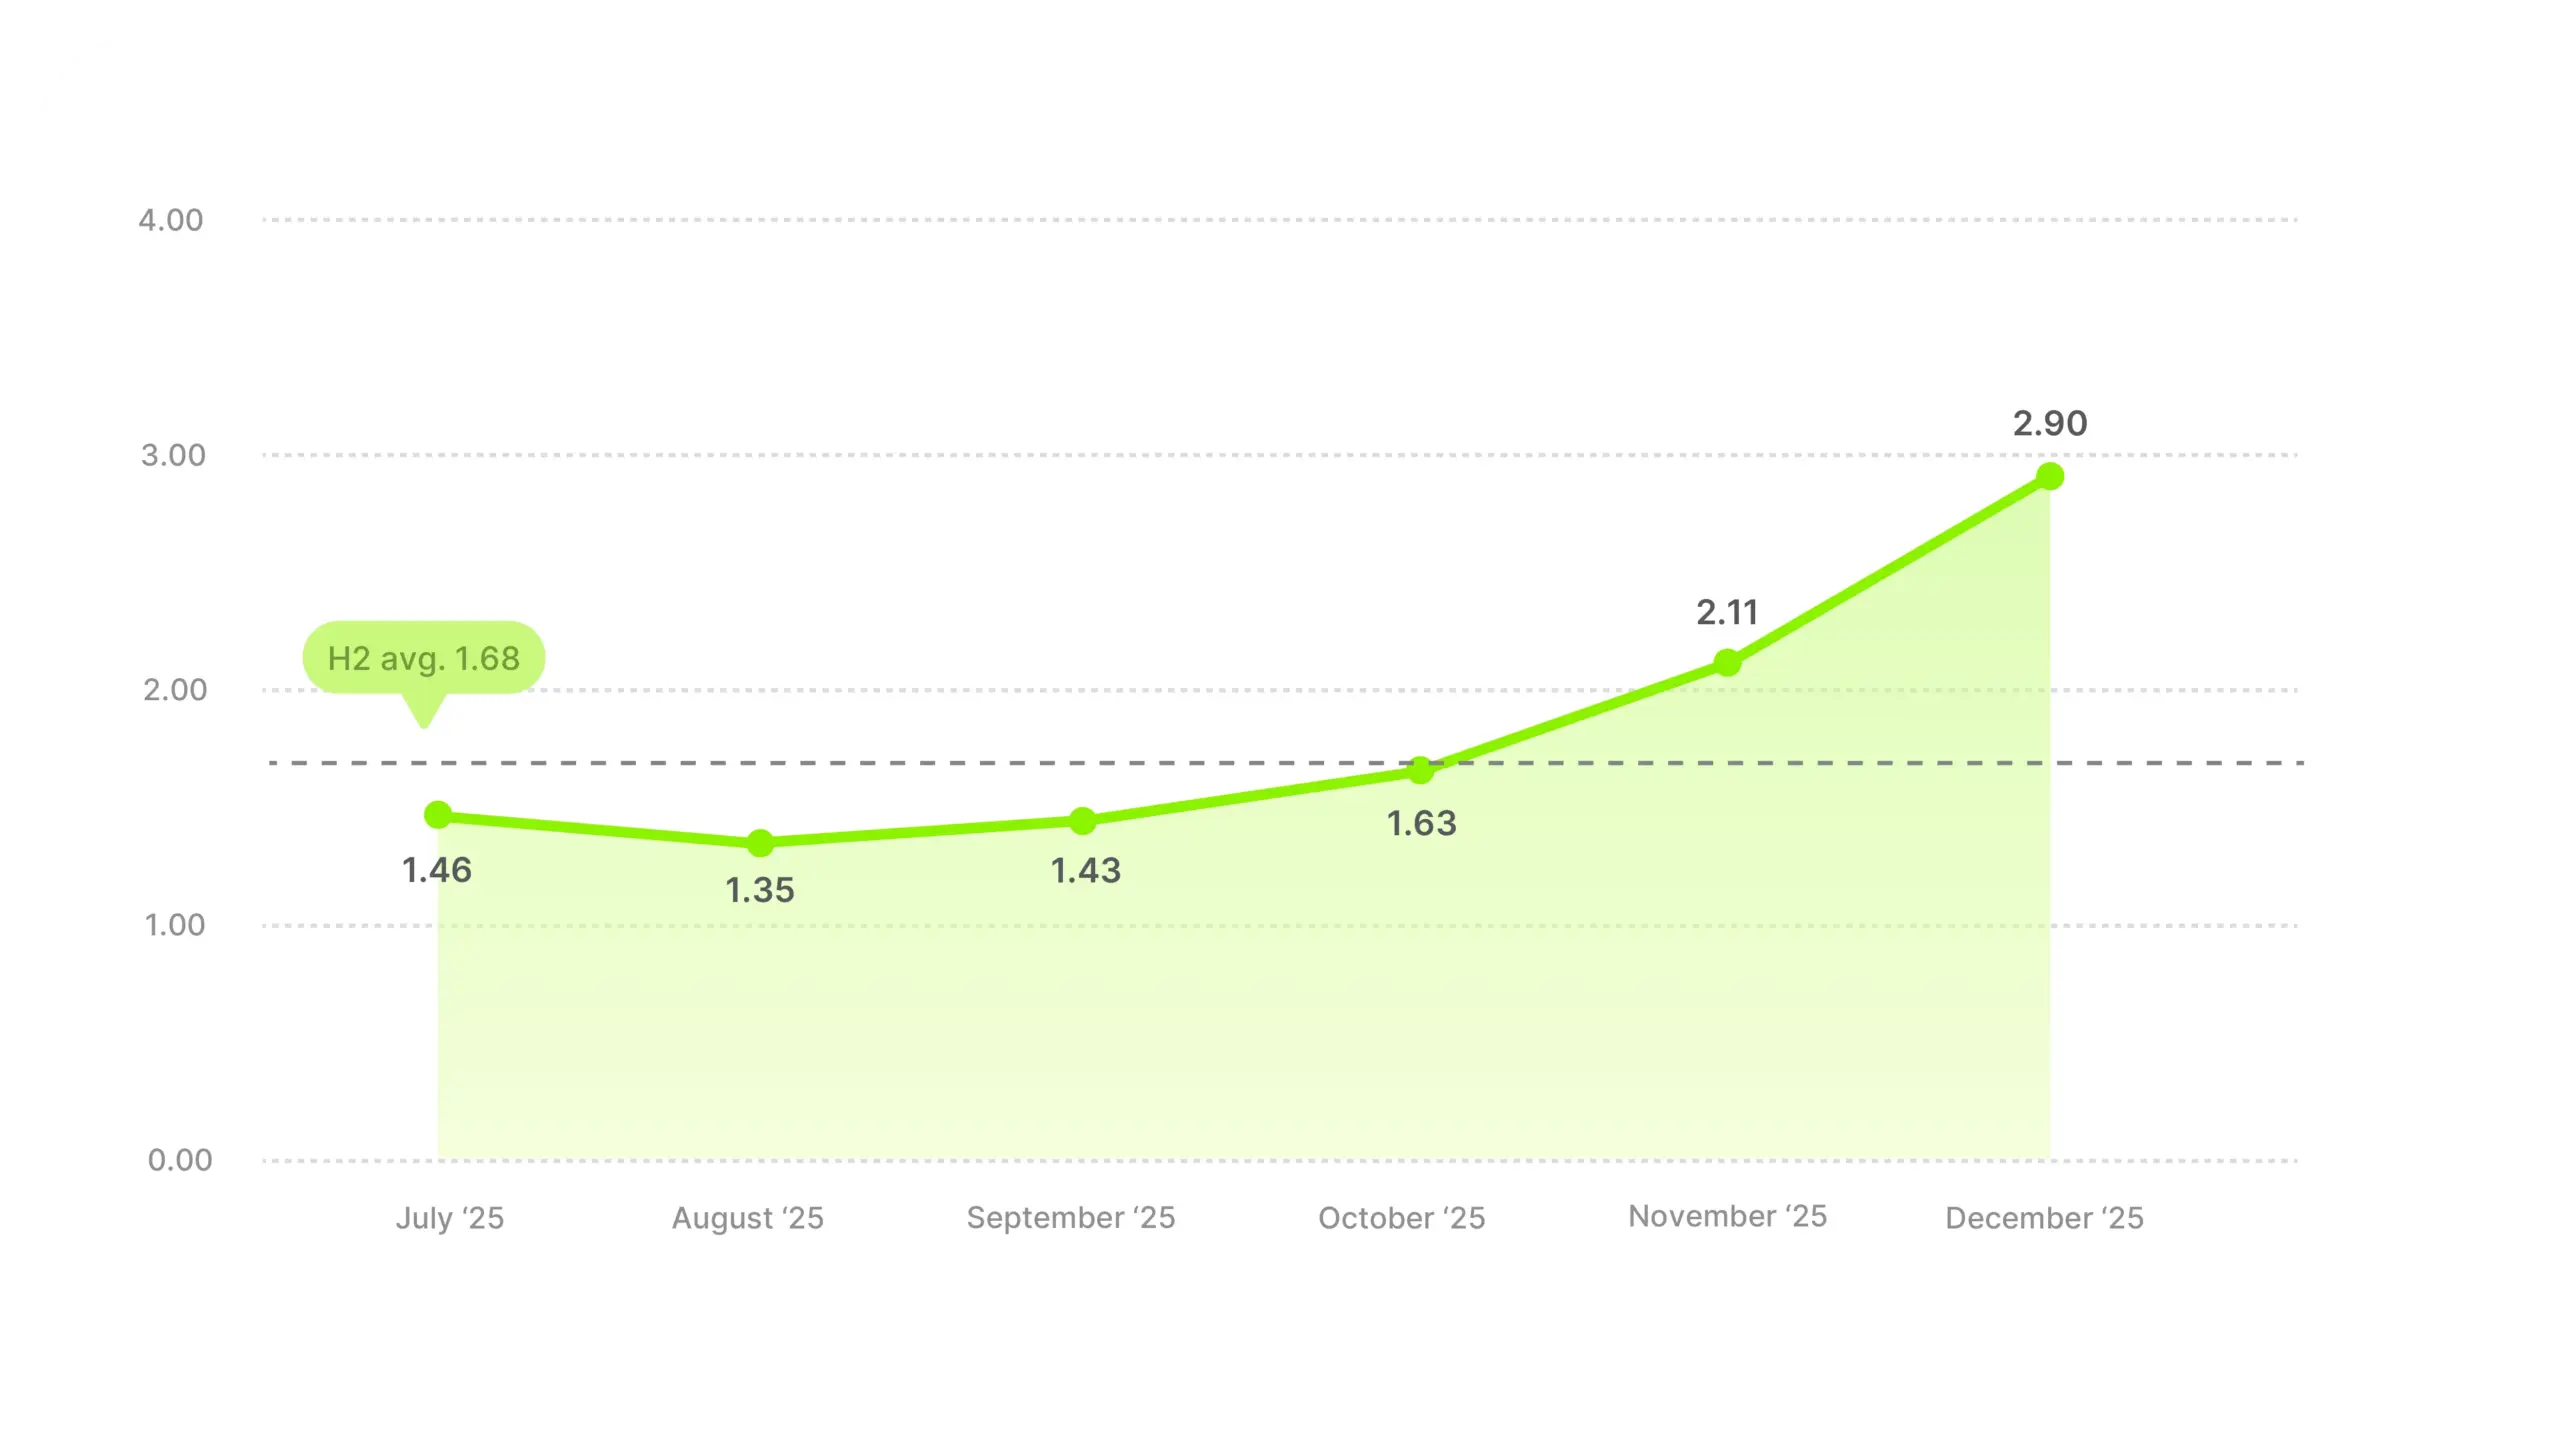
July through September sits basically flat and below break-even comfort. 1.46, 1.35, 1.43. Video ads for this category barely clear break-even in summer. There isn’t much reason to click through and buy a toy in July unless it’s for a birthday.
Then October starts the climb (1.63), November jumps to 2.11, and December peaks at 2.90. That’s a roughly 115% increase from August’s low to December’s peak, the steepest H2 ramp of any category. No other vertical comes close.
The cross-metric picture is worth reading next to this one. Toys & Games led hook rate (28.23%, second-highest of any category) and trailed on CTR (1.30%, second-lowest). On ROAS, the H2 average sits near the bottom. But December ROAS alone (2.90) would place the category above the overall market H2 average. The opening of the ad seems to work. The middle and the CTA probably don’t, except during the gifting window when intent does the conversion work for you.
The 1.68 H2 number is misleading in isolation. Q4 is the real window here. Plan your heaviest spend into October through December, and don’t expect July and August to pay you back the way November and December will. The whole year is just a long wait for the December rush.
“Other” bundles industries that didn’t produce enough volume to stand as their own vertical. At 2.55 it lands just above the market average, but as a blend rather than a coherent category, it works better as a reference line than a competitive benchmark.
Industry ROAS average
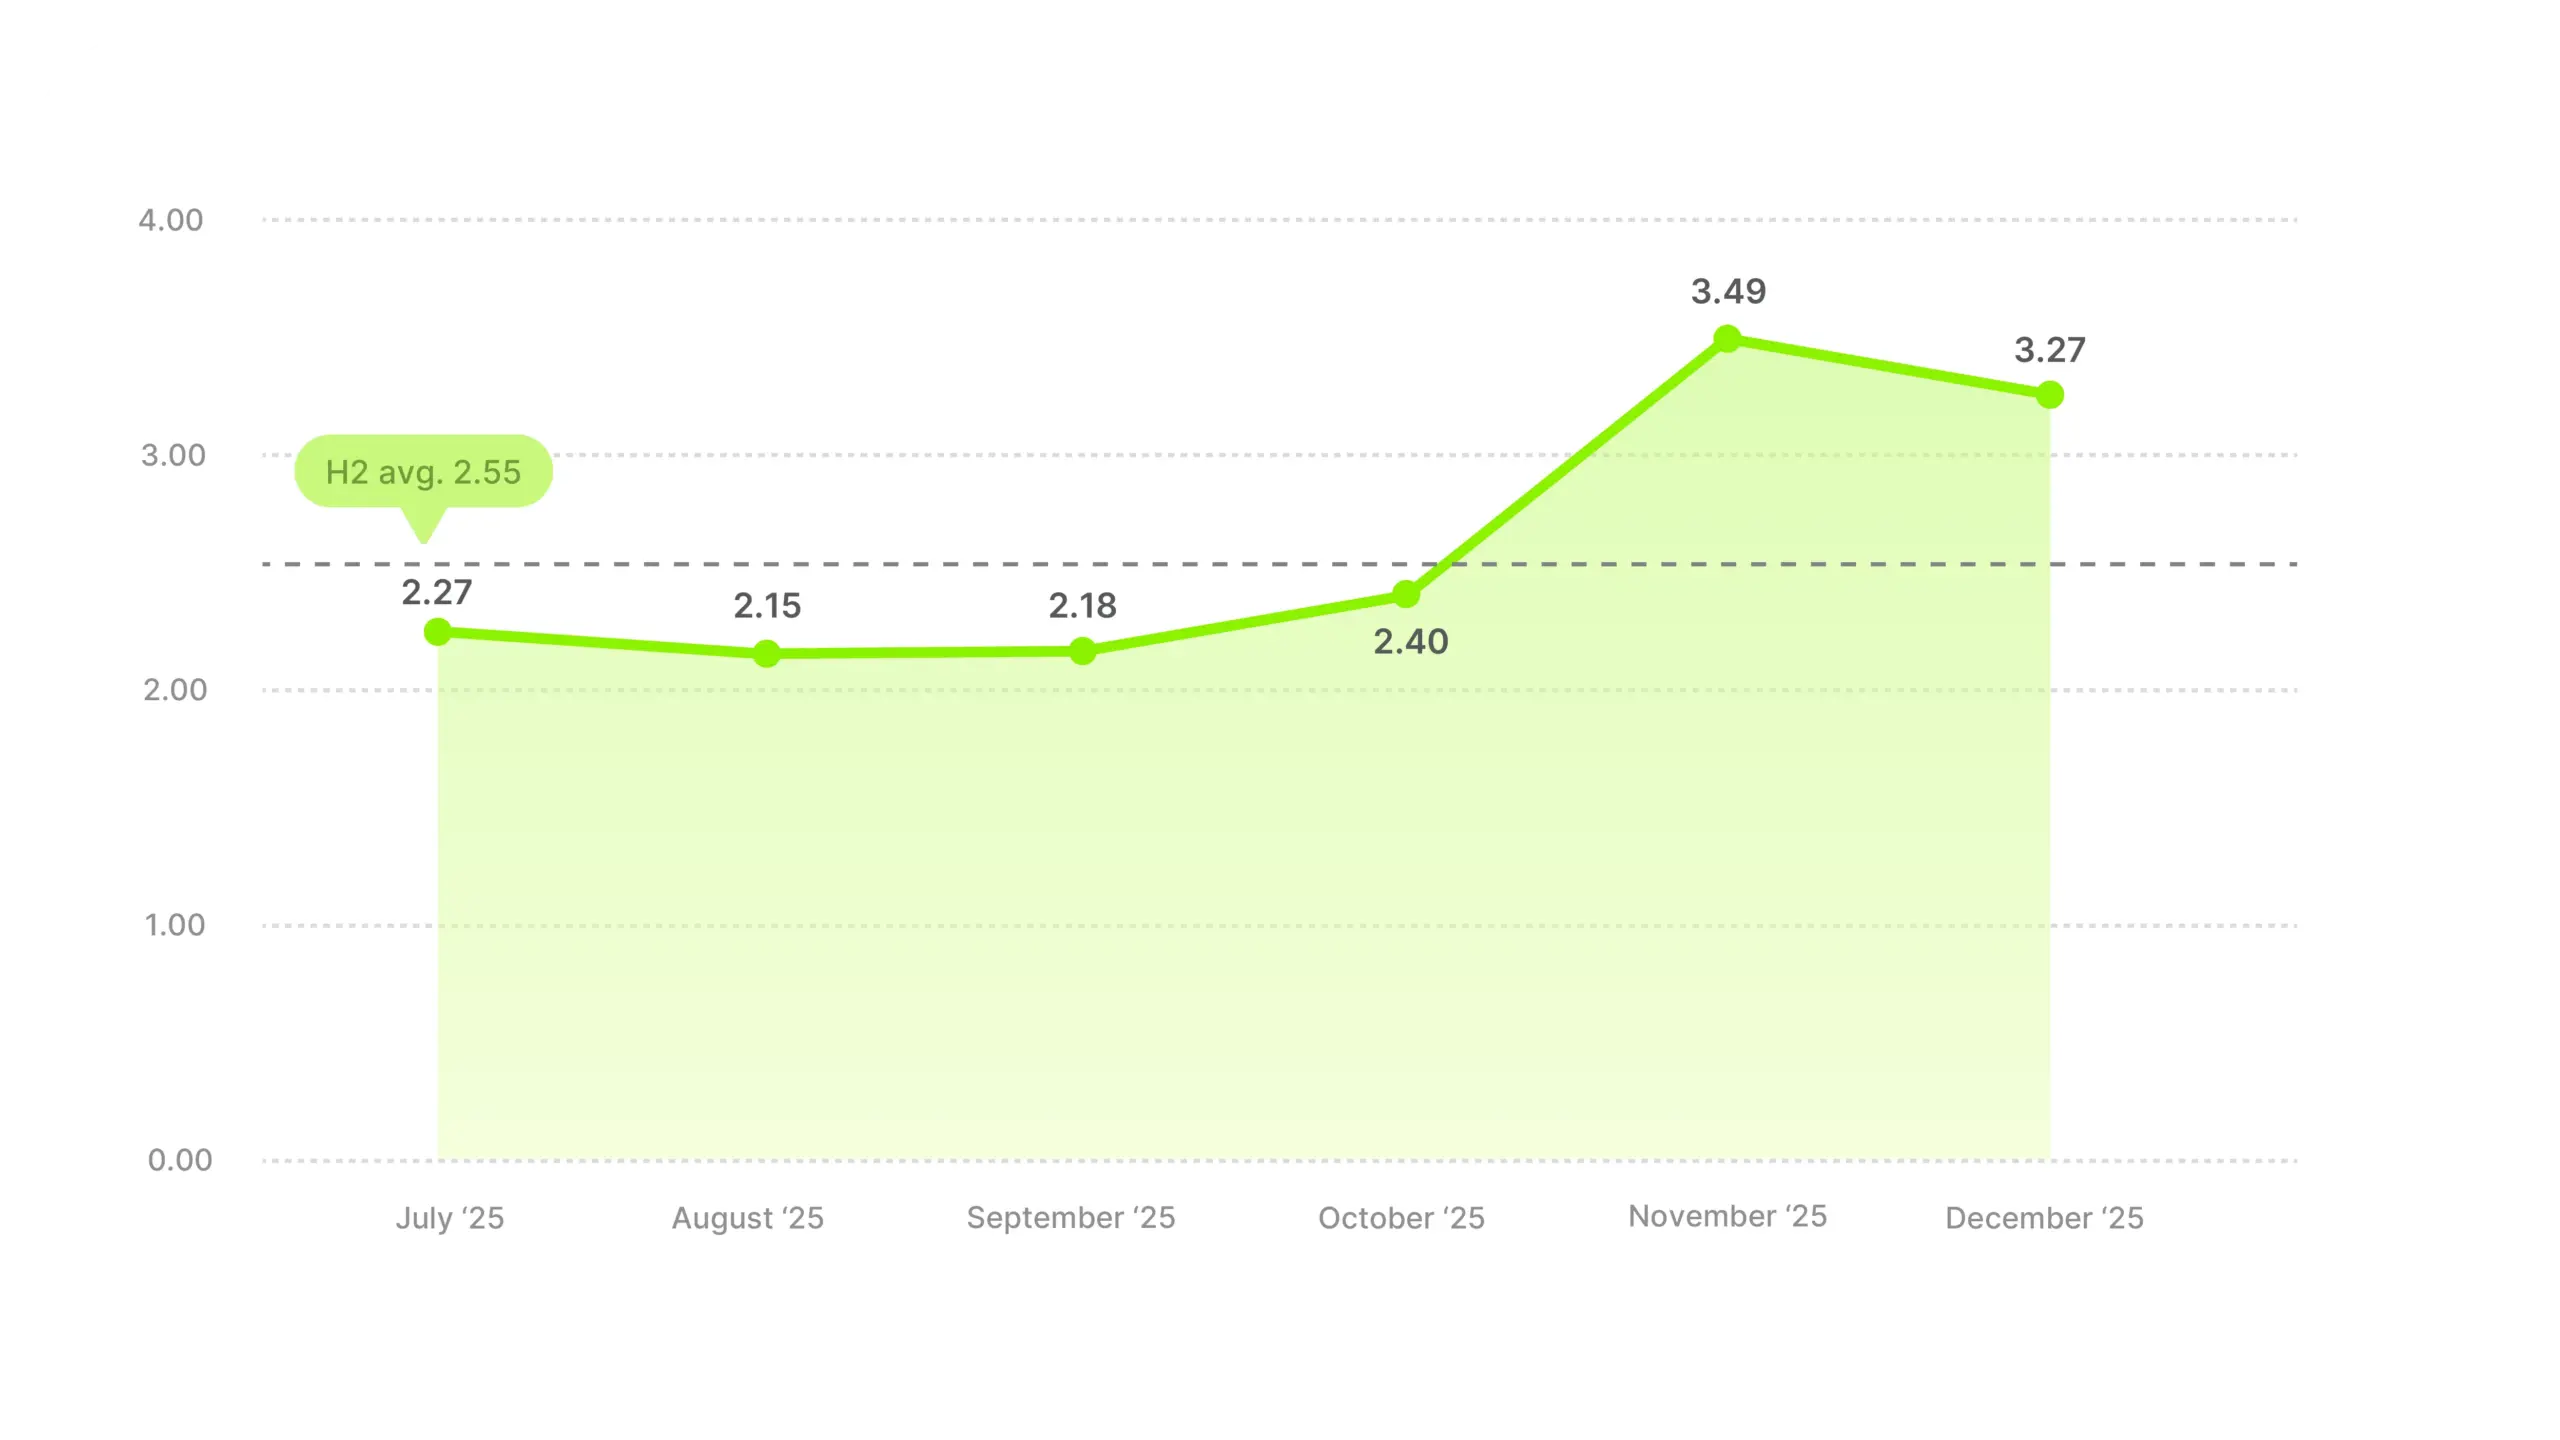
The monthly pattern is a clean two-phase split. July through October runs flat between 2.15 and 2.40, then November jumps to 3.49, and finally December settles at 3.27. The shape tracks the overall market’s Q4 closely, which makes sense. When you average a mix of unrelated industries together, individual effects cancel and you land near the aggregate.
If your industry sits in this bucket, 2.55 is a reference line, not a competitive target. The better benchmark is your own H2 history, or the closest named vertical in the report.
Methodology
Data source: 80,069 Meta video ads running between July 1 and December 31, 2025.
Inclusion criteria: Sales-objective video ads with 1,000+ impressions and metrics we could rely on.
ROAS definition: Total purchase value divided by total ad spend. Shows how much revenue each advertising dollar generated.
Industry classification: Fourteen verticals assigned by advertiser product category. The “Other” bucket holds industries too small to stand alone. Vehicles & Parts was excluded for the same reason.
A note on interpretation: These numbers describe what happened in H2 2025. They aren’t a forecast or a guarantee. Smaller-sample categories (Services, Software, Electronics, Baby & Toddler) are more sensitive to individual-advertiser effects.