
What Is a Good ROAS for E-commerce? Benchmarks for Facebook, TikTok & More

What is a good ROAS for ecommerce? It’s a critical question, and in 2025, there’s no one-size-fits-all answer.
With ad costs rising and attribution becoming less reliable, return on ad spend (ROAS) remains one of the most closely watched metrics for marketing teams. According to ProfitMetrics, average ROAS has dipped 4.3% year over year, putting pressure on every ad dollar.
This guide breaks down what ROAS is, where it still matters, where it falls short, and what “good” looks like across platforms, from Meta to TikTok to Google. You’ll also get practical tips for hitting and improving your targets in a tougher, more cost-sensitive market.
TL;DR
- ROAS = revenue per ad dollar spent.
- “Good” ecommerce ROAS is typically 4-6×, but varies by context.
- 2025 benchmarks: Meta 2.2×, TikTok 1.4×, Google 4.5×.
- Key factors: margins, LTV, growth stage, market saturation.
- Boost ROAS with creative testing, targeting, and platform-native tools.
- Billo’s analysis of 80K+ Meta video sales ads in H2 2025 put the cross-industry video ROAS at 2.41× – but with a 2.45-point gap between the top and bottom verticals, the industry average tells you a lot less than your category does.
What is ROAS & How to Calculate It
Return on ad spend (ROAS) tells you how much revenue your ads generate for every dollar spent. It’s a core metric for understanding ad performance. Simple to calculate, but critical to get right.
The formula is straightforward:
ROAS = (Ad-attributed revenue ÷ Ad cost)
Spend $10,000 and earn $45,000 in sales? That’s a ROAS of 4.5×. The result can also be expressed as a percentage – in this case, 450%.
But don’t confuse ROAS with ROI. ROAS focuses purely on revenue generated from ads, not profit after costs. As Google explains, it’s about conversion value per dollar spent, not your net return.
As your strategy matures, ROAS becomes more than just a reporting metric. Platforms like Google Ads even offer target ROAS bidding, letting algorithms adjust bids in real time to hit your revenue goals.
Want to understand how ROAS fits into the bigger picture? Read this breakdown of ad performance metrics.
Why ROAS Matters for Ecommerce Profitability
ROAS isn’t just another metric – it’s a profitability checkpoint. It tells you which campaigns are pulling their weight and which are burning the budget.
In fact, ecommerce retailers that leveraged advanced ROAS analysis boosted marketing efficiency by 18%, according to a Harvard-cited study. That’s a real performance impact from simply understanding what drives returns.
But with ad tracking becoming harder post-iOS 14 and customer acquisition costs rising, many brands are seeing falling returns on familiar platforms.
Even as more teams pivot to broader metrics like Marketing Efficiency Ratio (MER), ROAS remains a top KPI for ecommerce marketers in 2025.
Just keep in mind: ROAS should always be evaluated in context. If a campaign’s goal isn’t direct sales, like top-of-funnel awareness or list building, then a low ROAS doesn’t mean failure. Measuring ROAS at the campaign level helps clarify which efforts are revenue-driven and which are supporting longer-term growth.
Bottom line: MER gives the big-picture view, but ROAS still drives tactical ad decisions.
What is a Good ROAS for Ecommerce?
So, what qualifies as “good” when it comes to ROAS? It depends on your product, margins, and growth goals, but most ecommerce brands aim for 4-6× as a healthy baseline.
According to Ziggy Agency, ecommerce brands typically target 4-6×, while B2B tech companies may settle for 3-5× and SaaS for 3-4×. Enterprise brands often accept 2-3× due to scale.
Shopify calls 4× an “ideal” starting point for profitable scaling. But that number is getting harder to hit. The ProfitMetrics index shows average ROAS dipping 4% YoY in 2025, largely due to rising media costs and increased competition.
Key takeaway: Don’t chase one magic number. Benchmark against your vertical, stage, and margin profile to find your true ROAS sweet spot.
Platform Benchmarks (April 2025)
ROAS benchmarks vary widely by platform. Knowing the latest numbers helps you set realistic expectations and optimize smarter.
Facebook/Meta Ads
The median ROAS sits at 2.19×, with retargeting campaigns hitting 3.61×. That makes Meta a strong bet for re-engagement, even as acquisition costs climb.
A note on video sales ads specifically: Billo’s first-party analysis of 80,000+ Meta video ads running sales campaigns in H2 2025 put the cross-industry video ROAS at 2.41× – closely tracking the Varos median. More interesting is the stability: the monthly average never left a 2.34 – 2.70 band across all six months. The 0.36 spread from worst month to best month is unusually tight, meaning the headline number isn’t being inflated or deflated by a single big month. Video ads kept working across the full half – the question is whether your category did.
TikTok Ads
TikTok’s overall median ROAS is lower at 1.41×, but when brands use “Value” optimization, that number jumps to 2.25×. It’s proof that strategy matters more than spend.
Google Ads (Search)
Search campaigns lead with a 4.52× median ROAS across 5,000+ advertisers, making it the most efficient of the big three channels.
Google Shopping (by vertical)
ROAS can swing dramatically by product category: Electronics ads average ~6×, while Fashion comes in closer to 3.5×.
These medians aren’t targets, they’re baselines. Your goals should flex based on campaign type, vertical, and funnel stage.
Meta video ROAS by industry: Billo’s H2 2025 findings
The 2.41 cross-industry average hides a huge category spread – 2.45 points between top (Apparel at 4.11) and bottom (Animals & Pet Supplies at 1.66). That gap is nearly seven times wider than the 0.36 month-to-month spread. For ROAS in H2 2025, your industry mattered far more than the month did. Full H2 2025 ROAS by industry on Meta video sales ads (Billo, 2026).
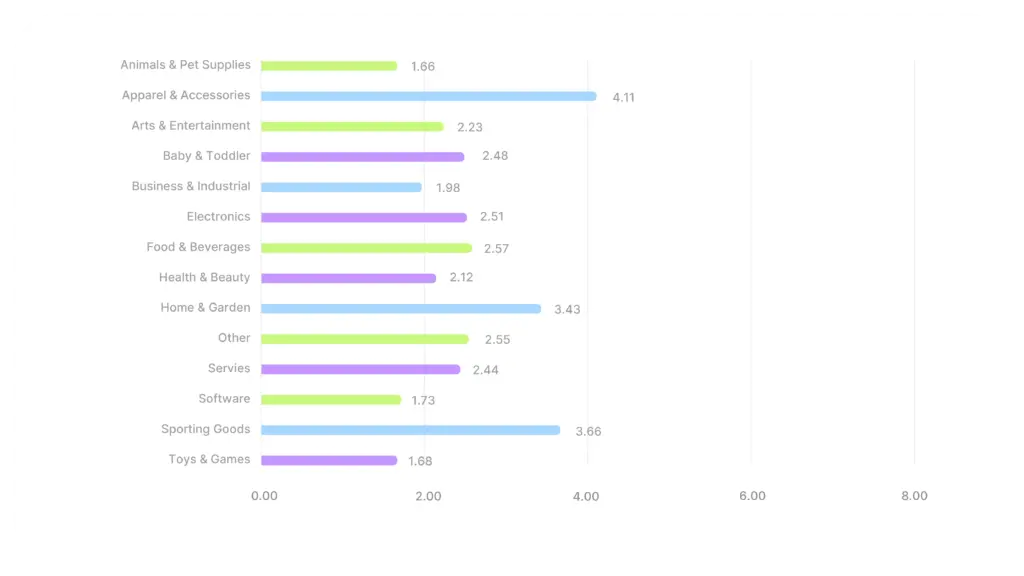
Three highlights from the data:
- Apparel’s “decline” isn’t a decline. ROAS fell from 4.77 in July to 2.88 in December – on the surface, a 40% drop. But Apparel brands scaled aggressively through Q4, trading return per dollar for total revenue. Even at December’s “low,” the category cleared the overall H2 average.
- Health & Beauty wins attention but lags conversion. The category leads hook rate (28.34%) and ties for top CTR (1.90%), but ROAS sits below the cross-industry average at 2.12. Viewers stop and click, but fewer convert than the top of the funnel suggests. The fix is probably in the offer, CTA, or landing page – not the creative.
- Toys & Games is the purest gifting story in the data. H2 average of 1.68 looks weak in isolation – but December alone hit 2.90, which would put the category above the overall H2 average. If you’re in Toys & Games, the whole year is a long wait for the December rush.
For monthly breakdowns by industry, the pre-Black Friday October dip analysis, and the November-vs-December “efficiency peak vs. scale peak” framing, read the full benchmarks report.
Factors That Change “Good” ROAS
There’s no one-size-fits-all ROAS target. What’s “good” depends heavily on your business model, growth phase, and even platform shifts.
1. Margins and LTV
Brands with high margins or strong lifetime value (LTV) (like subscriptions) can scale at lower ROAS. Low-margin DTC brands, on the other hand, often need 5×+ to stay profitable.
2. Growth Stage
Early-stage ecommerce brands typically aim for 6× or more until they recover CAC quickly enough to reinvest. That’s because early ROAS must fund future scale.
3. Attribution Loss
Post-iOS 14, many marketers now pair ROAS with broader metrics like MER to offset attribution gaps. As Agital puts it, smart teams use both to track efficiency and payback.
4. Market Saturation
The ProfitMetrics index shows a 4% YoY drop in average ROAS, reflecting rising ad competition and auction pressure.
5. Seasonal pattern (and it’s not the one most brands plan for)
Billo’s H2 2025 dataset shows categories fell into three distinct seasonal patterns, and “plan for Q4” only helps if you know which one you’re in:
- Q4 gifting: Toys & Games, Baby & Toddler, Arts & Entertainment peak in November or December. Toys & Games went from 1.46 in July to 2.90 in December.
- Self-use / necessity: Services and Home & Garden peak earlier. Services peaks in September (2.88) on back-to-business intent; Home & Garden’s standout month was July at 5.33, driven by patio/outdoor season.
- Scale-driven decline: Apparel runs its own pattern – ROAS drops through Q4 as brands push more spend, accepting a lower return per dollar in exchange for total revenue.
If you’re benchmarking your November ROAS against an “average” Q4 lift, you might be planning against the wrong calendar entirely.
These medians aren’t targets – they’re baselines. Your goals should flex based on campaign type, vertical, and funnel stage.
Tactics to Improve ROAS
Raising ROAS isn’t about throwing more budget at ads, it’s about smarter creative, tighter targeting, and faster iteration.
Test and iterate creatives relentlessly
Meta’s Performance 5 framework recommends constant micro-iteration. Even small tweaks to your best-performing ads can revive performance and lift ROAS. Before you brief your next test, pull a category-specific target from Billo’s video ROAS benchmarks across 14 industries – so
Use high-volume creative testing
Otter.ai scaled up ad testing and saw a +65% boost in CVR and higher ROAS, according to this Primer case study. The takeaway? Volume and velocity beat perfect creative.
Try platform-native formats
Centrepoint ran TikTok Video Shopping Ads with targeted iOS spend and saw +35% revenue on just +17% budget. Native formats with built-in optimization features can punch above their weight.
Leverage automation tools
Features like Meta’s Dynamic Creative auto-combine assets to find top-performing combinations. Boosting efficiency without more manual work.
For a deeper dive into ad refresh strategies, explore our guide to creative ad iterations.
Summary & Next Steps
A “good” ROAS is a moving target. Benchmarks like 4-6× offer a helpful starting point, but real success depends on your margins, product category, and growth stage.
To stay profitable, benchmark against both industry averages and platform medians, then fine-tune based on your unique unit economics.
Looking to improve ROAS fast? Start by optimizing your creatives. Billo’s Creative Performance Engine helps brands test smarter, match with high-performing creators, and produce ad variations that drive results on Meta, TikTok, and beyond.
FAQs
Is ROAS still relevant if I track MER?
How often should I recalculate ROAS targets?
What ROAS should I expect on a new ad channel?
Paid Marketing Lead at Billo
I lead the paid marketing team at Billo, focusing on performance, testing, and growth that scales. Over the past 6 years, I’ve worked across digital marketing - from running campaigns to building the strategies and systems behind them. What drives me is problem-solving. I like turning complex questions into simple, testable answers, and making decisions that actually drive impact.
Make creator marketing a data-backed growth channel

Related from Creative Insider

The Creative Operations Setup Paid Social Actually Needs

How Many Ad Creatives Do You Need? 2026 Benchmarks for DTC Brands

“Creative Is the New Targeting” – But Only If You Structure It Right


