2026 Black Friday Benchmarks: What Your Hook Rate, CTR & ROAS Should Look Like


Most brands walk into Black Friday with a plan for their offers and almost no sense of whether their creative is actually competitive. You know your discount. You know your ad spend. What you probably don’t know is whether your Hook Rate, CTR, and ROAS Black Friday benchmarks are ahead of your category, behind it, or right where they should be going into the biggest ad week of the year.
That gap matters more during BFCM than at any other point in the year. Every brand in your category is running video ads into the same feeds at the same time, and the ones who know where they stand going in are the ones who spend the next few months fixing the right problem instead of guessing at all three at once.
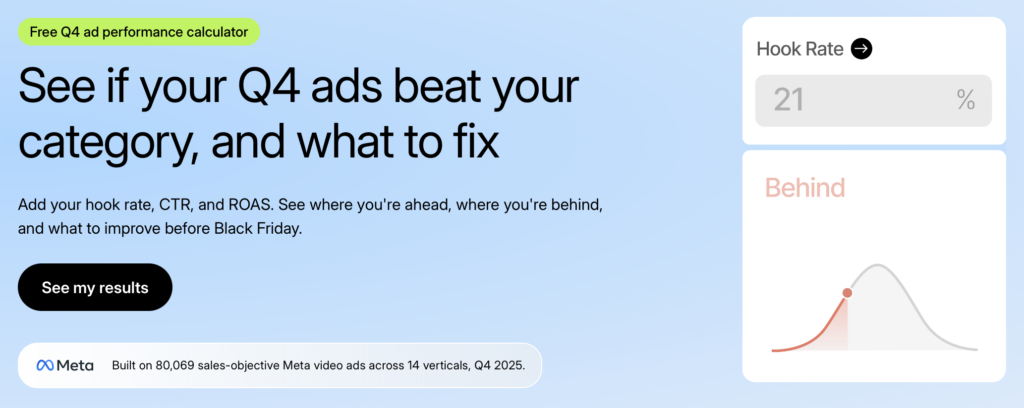
We pulled the answer from 80,069 sales-objective Meta video ads that ran across 14 industries in Q4 2025, and built it into a free Q4 Performance Calculator so you can see exactly where your own numbers land against your category. This post walks through what that data says and how to use it before your BFCM spend ramps up.
TL;DR
- Your category matters more than the calendar month. The gap between the best and worst performing category is far wider than any month-to-month swing across Q4.
- Three distinct seasonal patterns show up in the data: pure gifting categories that ramp hard into December, need-driven categories that never really dip before Black Friday, and Apparel’s own pattern, where ROAS declines through Q4 as brands trade efficiency for total revenue.
- Most brands benchmark against the wrong number. The cross-industry average hides more than it reveals once you look at your specific category.
- The Q4 Performance Calculator lets you plug in last year’s Hook Rate, CTR, and ROAS and get a personalized read against your category, plus a phased creative calendar for the run-up to BFCM.
Three seasonal patterns, not one Black Friday
The numbers behind the Q4 planner come from 80,069 sales-objective Meta video ads that ran between July and December 2025, spanning 14 industry verticals, the same dataset behind Billo’s Hook Rate, CTR, and ROAS benchmark reports, filtered down to what actually happened during the Q4 window. The clearest way to see what it shows isn’t the cross-industry average. It’s how differently Q4 plays out depending on which category you’re in.
The first pattern belongs to pure gifting categories, and Toys & Games is the clearest example in the dataset. These categories barely move through the summer, then build steadily into a real peak right at the holidays.
The takeaway: if you’re in a gifting category, don’t judge your creative by how it performs in July. The same ad that looks mediocre in the off-season can turn into your best performer once shoppers start buying for other people instead of themselves. Toys & Games also opens strong (one of the highest hook rates in the whole dataset) but the click lags behind, so the bigger opportunity here is usually in what happens after the hook, not the hook itself.
The second pattern belongs to need-driven categories, and Animals & Pet Supplies and Baby & Toddler are the sharpest illustrations. Most categories pull back in October as shoppers wait for the Black Friday discount to land. These two don’t. People buy diapers and pet food when they run out, not when a deal shows up in their feed.
The takeaway: if your category is driven by necessity rather than gifting or discount-seeking, don’t build your whole Q4 strategy around the BFCM weekend. Your demand is steadier than the calendar suggests, and pulling spend forward to chase a “pre-Black Friday dip” that doesn’t really exist in your category is wasted effort.
The third pattern is Apparel’s own, and it runs in the opposite direction from what most brands expect. Apparel has the best return of any category going into Q4, and that return actually gets a little worse as the quarter goes on. Read on its own, that looks like a category losing steam right when it should be peaking. Read correctly, it’s the opposite: brands are choosing to scale spend hard through the holidays and accept a slightly lower return per dollar in exchange for a lot more total revenue.
The takeaway: if you’re in Apparel and your efficiency dips in November and December while your total sales keep climbing, that’s the plan working, not a warning sign.

How to read your own numbers
The performance calculator itself works in two steps. First you pick your category from the 14 covered in the dataset. Then you enter last year’s Hook Rate, CTR, and ROAS, and the tool compares each of your three numbers against the category average and tells you whether you’re behind, on par, or ahead.
Once you’ve entered your numbers, the calculator also surfaces the seasonal pattern for your specific category (gifting, need-driven, or scale-and-spend, the same three patterns covered above) along with real video examples from creators already beating your category’s benchmarks. That combination is what turns a benchmark into something you can actually act on before your BFCM spend goes live.
Your Q4 creative calendar, phase by phase
The calculator breaks Q4 into 4 phases, and the logic behind each one holds regardless of which category you’re in, even though the specific creative moves change depending on whether your category is a gifting story, a need-driven story, or an Apparel-style scale story.
1. Prime and test runs from September to mid-October
This is the window to test new hooks and concepts while competition is still light and before the rest of your category ramps up spend. An Apparel brand would use this phase to test fit and movement-focused openers, since Apparel Hook Rate sits right at the market average and the real advantage shows up later once holiday intent kicks in.
2. Build audience runs from mid-October through November 26th
Once you know which creative concepts are winning from the testing phase, this is when you build retargeting pools off those winners so you have a warm audience ready before the BFCM weekend itself. For a gifting category like Toys & Games, this is also the window where Hook Rate and CTR both start climbing toward their holiday peak.
3. Peak covers November 27th through 30th, the BFCM weekend itself
This is where you prioritize volume over efficiency. The data backs that trade-off directly. Apparel ROAS drops from 4.20 in October to 3.17 in November, but total revenue still grows because the category is running far more volume through the auction.
4. Extend covers all of December
The instinct for a lot of brands is to go dark after Cyber Monday, but the data says that’s a mistake almost everywhere. Health & Beauty actually posts its highest Hook Rate of the entire year in December at 30.56%, and even Apparel’s December ROAS of 2.88 still clears the overall H2 average of 2.41. Whatever pulled your audience in during BFCM weekend is usually still working into the final weeks of the year.
What to fix, based on where you’re behind
Once you know which of the three metrics is lagging, the fix is usually specific to that metric, not a general “make better creative” note.
If Hook Rate is behind, look at your opener first.
Hook Rate barely moves with the season, so a weak one is almost always a creative issue with your ad, not something Black Friday itself caused. Electronics saw its lowest Hook Rate of the year in November, most likely because every ad in the feed opened with the same price-slash format. If your category is flooded with identical discount-led openers, a distinct first frame matters more during BFCM than at any other time of year.
If CTR is behind while Hook Rate is fine, the gap sits between the hook and the ask.
Food & Beverages is a good example: its Hook Rate runs above average, but its CTR sits below it, so attention isn’t converting into clicks. Tightening the middle of the video and making the CTA explicit rather than implied tends to fix this faster than reworking the opener again.
If ROAS is behind while Hook Rate and CTR both look healthy, look past the video entirely.
Health & Beauty led on Hook Rate and CTR but still landed below average on ROAS, so people are engaging without converting. Check whether your landing page delivers on exactly what the ad promised before assuming the creative needs another round of changes.
Put your own numbers to the test
You don’t need to guess where your Black Friday creative stands. Enter last year’s Hook Rate, CTR, and ROAS into the Q4 Performance Calculator and see exactly how your category benchmarks, your seasonal pattern, and your phase-by-phase creative calendar line up against the data in this post.
If you’re ready to start building creative for the season now, there’s also an exclusive Black Friday offer available for brands getting a head start on their BFCM video production.
For the full playbook on audience building, ad formats, platform tactics, and budget pacing heading into BFCM, the Black Friday marketing strategy guide covers execution in depth. This post is about knowing where you stand. That one is about what to do next.
FAQs
What’s a good Hook Rate for Black Friday?
Does ROAS naturally drop during BFCM?
How is this data different from general Q4 benchmarks?
What if I don’t have my exact numbers from last year?

SEO Lead
Passionate content and search marketer aiming to bring great products front and center. When not hunched over my keyboard, you will find me in a city running a race, cycling or simply enjoying my life with a book in hand.
Make creator marketing a data-backed growth channel

Related from Creative Insider

Marketing efficiency ratio: why MER falls when your creative is working

AI Generated Ads vs. Human UGC: What the Performance Data Actually Shows
The Creative Operations Setup Paid Social Actually Needs