
Hook rate vs hold rate: formulas and benchmarks for video ads


Your video ad has three seconds to stop the scroll. Platforms like TikTok and Meta tracks ads on an instant hook rate - the share of viewers who stick for those first 2-3 seconds. Miss that window and their algorithms throttle reach, slicing CTR and ROAS.
Many teams still tweak thumbnails or targeting while ignoring the opener, wasting testing cycles and budget. Pairing hook rate with hold rate (viewers who stay from 3 to 15 seconds) shows whether your narrative converts curiosity into clicks. In this guide you’ll learn how to calculate, benchmark, and systematically lift both metrics so every creative dollar compounds.
TL;DR:
- Hook rate is the share of impressions that turn into a short view. On Meta, it’s 3-second video plays divided by impressions. On TikTok, it’s 2-second video views divided by impressions.
- Hold rate is the share of those viewers who keep watching. On Meta, divide ThruPlays by 3-second video plays.
- The average Meta hook rate was 25.44% in H1 2026, across 88,329 sales video ads in Billo’s data, and no industry averaged above 29%. A hook rate of 30% or more puts an ad ahead of every industry average.
- A strong hook doesn’t guarantee sales, so judge it alongside CTR and cost per purchase.
What is a hook rate?
Think of hook rate as your ad’s thumb‑stop score. In other words, it measures how many viewers stay on your video past a certain time frame.
Hook rate is the percentage of impressions where someone watched the first few seconds of your video ad. You’ll also see it called thumbstop rate or scroll-stop rate.
- Meta: hook rate = 3-second video plays ÷ impressions × 100
- TikTok: hook rate = 2-second video views ÷ impressions × 100
Meta counts 3-second video plays each time a video plays for at least 3 seconds, while TikTok’s shorter 2-second threshold tends to produce higher rates. That’s why a TikTok hook rate and a Meta hook rate aren’t directly comparable.
What is a hold rate?
Hold rate shows how many of the people you hooked keep watching.
- Meta: hold rate = ThruPlays ÷ 3-second video plays × 100. A ThruPlay counts when a video plays to the end or for at least 15 seconds.
- TikTok: hold rate = 6-second video views ÷ 2-second video views × 100, using the metrics in TikTok’s video play definitions.
Let’s say a video gets 10,000 impressions, 2,600 3-second plays and 650 ThruPlays on Meta. Its hook rate is 26%, and its hold rate is 25%.
Some tools divide ThruPlays by impressions instead, which gives a much smaller number, so check which definition a benchmark uses before you compare your own results.
Why hook rate matters
Every view starts with the hook. TikTok’s analysis of auction ads found that over 63% of the videos with the highest CTR highlight their key message or product within the first 3 seconds. The research dates from 2020, but it still describes how people scroll today.
Creator-led video tends to clear that first gate more often. Billo’s internal analysis of brand-connected Meta ad accounts (January 2025 to August 2026) shows Billo video ads averaged a 30% hook rate across Billo’s top 5 categories, compared with 24% for the other video ads in the same accounts.
Billo’s H1 2026 benchmarks add an important caveat. Hook rate didn’t predict CTR on its own, so a strong opening earns you the chance to sell, and the rest of the video still has to do the selling.

Benchmark your hook rate
The largest hook rate dataset with a published method is Billo’s own. Across 88,329 sales-objective Meta video ads in H1 2026, the average hook rate was 25.44%, up from 24.42% in H2 2025. It peaked at 26.52% in March and dipped to 23.99% in June.
| Highest hook rates, H1 2026 | Lowest hook rates, H1 2026 | ||
|---|---|---|---|
| Toys & Games | 28.79% | Baby & Toddler | 22.56% |
| Business & Industrial | 28.74% | Electronics | 22.21% |
| Health & Beauty | 28.11% | Animals & Pet Supplies | 21.32% |
The full breakdown for all 14 industries is in Billo’s H1 2026 hook rate benchmarks.
Practitioner guidance points the same way. Vixen Digital’s hook rate guide, suggests aiming for at least 25% and notes that top-performing ads tend to reach 30% or more.
Based on those figures, here’s how to read your Meta hook rate:
- Below 21%: lower than every industry average in Billo’s H1 2026 data. Rework the opening before you add budget.
- Around 25%: in line with the cross-industry average.
- 30% or more: above every industry average, and in line with Billo-produced ads in Billo’s top 5 categories.
For TikTok, there’s no current hook rate benchmark with a published method. Compare TikTok ads against your own account median until better data is available.
One caveat: in Billo’s H1 2026 data, some of the beauty and health ads with the highest hook rates barely broke even, so a strong hook still needs an offer that converts.
How to track and report hook rate
Measuring hook rate inside each ad platform keeps the math transparent and apples‑to‑apples.
In TikTok Ads Manager, add the built‑in 2‑second video views and impressions columns, then create a custom metric dividing the two. Add a second custom metric for hold rate, 6-second video views ÷ 2-second video views, to spot openings that grab attention but lose steam (TikTok Ads Manager Glossary).
In Meta Ads Manager, build a calculated field: 3‑second video views ÷ impressions. Add a sister metric for hold rate – ThruPlays ÷ 3‑second views . So you can see whether the story keeps viewers once the hook lands (Meta Help Doc).
Refresh these numbers 24 hours after launch, then daily. Promote creatives that clear a 30% hook rate and beat your account’s median hold rate, and pause the ones that sit below 21% after a fair number of impressions. For a single‑view dashboard, dump both metrics into a spreadsheet or use a template like Billo’s ad performance metrics guide to visualise Hook → Hold → Click. Keeping the trio side‑by‑side lets teams back winners fast and turn small tweaks into compounding ROAS gains.
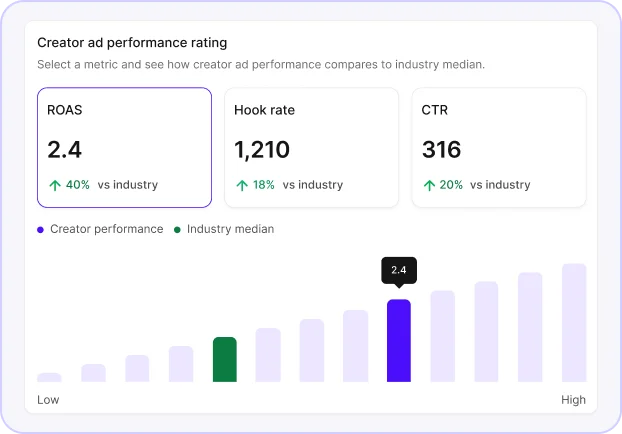
If an ad uses several videos, Meta’s creative breakdown in Ads Manager shows each video’s results separately, so you can see which hook is doing the work. Our guide to CTR benchmarks walks through the steps.
Boost your hook rate
Start with a crystal‑clear promise. Open by showing the payoff viewers care about – saving money, fixing a pain, or hitting a goal. TikTok ads that lead with a direct value prop, a trending audio clip, or a punchy question see meaningful lifts in thumb‑stop rate. Translate the promise onto the very first frame and subtitle so it’s unmistakable even on mute.
Add a pattern‑interrupt. An unexpected visual – smash cut, abrupt zoom, or prop reveal. It jolts users out of autopilot. Build tension fast, then pay it off before second three.
Show a real face and native cues. Human eye contact, bold on‑screen text, and platform‑native editing tricks (e.g., TikTok’s caption stickers) help your video blend in with organic content. Lean on authentic UGC formats – see Billo’s library of proven UGC hooks and broader UGC marketing tips for inspiration.
Test each lever in isolation: swap the first frame, rewrite the opening text, or layer fresh audio.

Integrating hook and hold rates
Great campaigns treat hook and hold as a one‑two punch, not isolated stats. Raise the hook first – no amount of mid‑video magic will matter if you never stop the scroll. Once you’re clearing a reliable 30%+ hook, shift focus to hold rate to confirm the story keeps selling.
Diagnose in sequence. Start by charting Hook → Hold for every creative. A video with high hook but < 25% hold is a pacing problem. Viewers stick around only to bail once the narrative stalls, so tighten edits or add pattern‑interrupts after second three.
Formula‑driven tweaks. Build hold as ThruPlays ÷ 3-second views inside Meta, or as 6-second video views ÷ 2-second video views inside TikTok.
Optimize, then cascade. Fix the hook first, then the hold. On Meta, use a 30% hook rate as the bar, then compare the hold rate with your account median. A strong hook followed by a hold rate well below your median usually means the video loses pace right after the opening.
Treat hook and hold like gears: engage first, sustain next, and every rotation drives cheaper reach and stronger conversion.
Summary
In paid social, seconds decide sales. A strong hook rate stops the scroll; a healthy hold rate proves the story’s worth.
Hit around 30% hook and hold rate above your account median, then scale spend and test CTAs. Use the simple dashboards outlined above or utilize Billo platform insights with hook rates, CTR and ROAS to spot winners in hours, not weeks.
Ready to stack creative wins? Explore Billo’s library of high‑performing UGC video hooks or brief a new batch of creators today and turn every second into ROAS.
FAQs
What is a “good” hook rate on TikTok and Meta?
How do I calculate hook and hold rates inside the ad platforms?
Does improving hook rate actually lower my CPMs?
I have a great hook but my hold rate is under 25%. What quick fixes work?

SEO Lead
Passionate content and search marketer aiming to bring great products front and center. When not hunched over my keyboard, you will find me in a city running a race, cycling or simply enjoying my life with a book in hand.
Make creator marketing a data-backed growth channel

Related from Creative Insider

Marketing efficiency ratio: why MER falls when your creative is working

AI Generated Ads vs. Human UGC: What the Performance Data Actually Shows

2026 Black Friday Benchmarks: What Your Hook Rate, CTR & ROAS Should Look Like


