What Is a Good CTR for Ads? 2025 Benchmarks Across TikTok, Meta & YouTube
I lead the paid marketing team at Billo, focusing on performance, testing, and growth that scales. Over the past 6 years, I’ve worked across digital marketing - from running campaigns to building the strategies and systems behind them. What drives me is problem-solving. I like turning complex questions into simple, testable answers, and making decisions that actually drive impact.
Most marketers know CTR matters, but few know what actually counts as good. And with short-form video dominating platforms like TikTok, Meta, and YouTube, the bar for success is constantly shifting.
In this post, we’ll unpack what is a good CTR for ads in 2025. You’ll see real benchmarks across formats and industries, plus the key variables that move the needle – from creative type to platform placements.
TL;DR
- A “good” ad CTR beats your platform + industry median.
- TikTok CTRs often fall below 1%; Meta Feed hovers near 1.5%.
- YouTube CTRs typically range from 0.4-0.6%.
- TopView, Reels, and Spark Ads can 2-10× standard CTRs.
- UGC, short-form placements, and fast-refresh creatives outperform.
Overview of average CTRs in different platforms
| Platform | Average CTR | High-Performance Formats | Top CTR Potential |
|---|---|---|---|
| TikTok | ~0.84% | Spark Ads, TopView | Spark Ads: 3%, TopView: 14% |
| Facebook (Meta) | ~1.57% | Feed Video, Reels with UGC | Real Estate: 2.60% |
| Instagram (Meta) | ~0.6% | Feed Video, Reels, Carousel | Reels with UGC: 3.8% |
| YouTube | ~0.5-0.6% (TrueView) | Skippable TrueView, Bumper | Retail: 0.84% |
Why CTR still matters for performance video
Click-through rate (CTR) may not be new, but it remains one of the clearest signals of ad relevance and audience intent.
A strong ad CTR helps lower your cost per acquisition (CPA) by improving relevance scores, which in turn reduce auction costs on platforms like Meta and Google. As Google explains, higher CTRs can improve ad rank and lower the amount you pay per click, especially for traffic or conversion campaigns.
Even though ads don’t match the CTRs of search campaigns, they still play a critical role. A sub 1% CTR on a video might seem low, but paired with strong view-through and conversion rates, it still signals meaningful engagement (Google Ads Help Center, 2025).
Today, CTR still shapes the economics of your ad performance, making it a leading metric to track and optimize.
TikTok CTR benchmarks
On TikTok, CTR performance depends heavily on format, industry, and how well your content blends into the feed. The platform’s overall CTR average remains just under 1%, with global e-commerce campaigns clocking in at 0.84% and average CPMs around $3.21.
Industry medians (2025)
According to AdBacklog, sector-specific TikTok CTRs look like this:
- Finance: 0.40%
- Retail: 0.46%
- Beauty: 0.38%
- Food: 0.42%
These numbers highlight how crucial context is. What’s “good” for one vertical might underperform in another.
Format performance
TikTok’s ad formats also create a massive CTR variation. Here’s what 2025 data shows:
- In-Feed Ads: Avg. 1.5-2% CTR. These appear natively in users’ feeds and benefit from high relevance when content mimics organic posts.
- Spark Ads (UGC): 3%+ CTR. Spark promotes organic creator videos directly and consistently outperforms branded content due to perceived authenticity.
- TopView: 14% CTR. These are premium placements shown immediately upon app open, generating high attention and outsized click-throughs.
- Brand Takeover: ~8% CTR. These appear full-screen before any user interaction, making them effective but costly.
- Branded Hashtag Challenges: Engagement-driven and less CTR-focused, but can influence traffic across formats when paired with Spark Ads.
To dive deeper into how each format functions and performs, explore our TikTok ad format guide.
TikTok ad success hinges on both format and creative type. Brands aiming for breakout CTRs should focus on Spark Ads with UGC and TopView placements, not just optimizing In-Feed.
Meta CTR benchmarks
Meta platforms (Facebook and Instagram) offer stronger average CTRs than TikTok, particularly for traffic-driven campaigns.
According to WordStream’s 2024–25 benchmark data, Facebook video ads using traffic objectives average a 1.57% CTR across 23 industries. Sector standouts include:
- Real Estate: 2.60%
- Shopping: 1.67%
- Legal: 0.99%
- Beauty: 1.51%
- Healthcare: 1.61%
- Fashion: 1.14%
On Instagram, Feed video ads show similar patterns. Based on AdBacklog’s 2025 report:
- Real Estate: 0.99%
- Retail: 1.59%
- Legal: 1.61%
- Beauty: 1.16%
- Healthcare: 0.83%
Meta ad format breakdown
CTR on Meta varies significantly depending on where your ad appears and how it’s styled. Here’s how top formats perform:
- Facebook Feed Video: The most standard placement – native-looking, autoplaying videos that benefit from strong headlines and CTAs. These average around 1.57%, with high-performers in niche verticals hitting 2.5%+.
- Facebook Stories: These full-screen, vertical videos are immersive but short-lived. CTRs here tend to be lower (often below 1%) due to fast swiping behaviors and less intent-driven interaction.
- Instagram Reels Ads: Reels offer high reach and are algorithmically boosted, but CTRs lag Feed placements unless content feels truly native. As mentioned, average CTRs sit at 0.30-0.50%, but jump to 3.8% when paired with creator-led UGC.
- Instagram Feed Video: Generally outperforms Stories and Reels in CTR. Averages around 1.2%, especially in Retail and Legal sectors (AdBacklog, 2025).
- Collection & Carousel Ads: These hybrid formats offer interactive elements, users can swipe through images and tap into product pages. While exact CTRs vary, engagement is often higher for retail and e-commerce brands using motion-first assets.
Choose your format based on scroll behavior and content intent. Reels may not always win on CTR, but they can shine with the right creative, especially UGC.
What does Meta Andromeda update mean for your ad creatives.
YouTube CTR benchmarks
YouTube offers enormous reach and high intent, but CTRs here typically trail Meta and TikTok. In 2025, the platform’s average ad CTR sits around 0.5-0.6%, with format and industry playing a big role.
Industry medians (2025):
- Retail: 0.84%
- Beauty: 0.44%
- Travel: 0.78%
- Automotive: 0.65%
- Education: 0.56%
- Finance: 0.40%
These numbers reflect YouTube’s unique viewer behavior – longer content formats and passive engagement tend to lower CTR.
Format-specific CTRs:
- Skippable TrueView Ads: 0.5-0.65% CTR with ~30% view-through rate. This format performs best when paired with strong thumbnails and early hooks.
- Non-skippable Ads (15s): Often under 0.3% CTR. Less control for users often equals lower interaction.
- Bumper Ads (6s): CTRs are typically below 0.1%. These are built more for brand lift than click-throughs.
YouTube also rewards creative testing. Changing just the thumbnail or refining the first 3 seconds of a video can meaningfully lift CTR. Platforms like Lebesgue show that brands using fast-refresh testing cycles see up to 45% improvement.
A “good” YouTube CTR starts at ~0.65% for TrueView. Focus on testing openers and thumbnails to maximize performance in a low-CTR environment.
Cross-platform industry medians
What counts as a “good” ad CTR depends heavily on your industry and platform. Below is a side-by-side comparison of 2025 benchmark CTRs for TikTok, Meta (Facebook), Instagram, and YouTube (AdBacklog, 2025; WordStream, 2024–25):
| Industry | TikTok | Instagram Feed | YouTube | |
|---|---|---|---|---|
| Retail & E-commerce | 0.46% | 1.67% | 1.59% | 0.84% |
| Finance & Insurance | 0.40% | 0.85% | 0.56% | 0.40% |
| Beauty & Personal Care | 0.38% | 1.51% | 1.16% | 0.44% |
| Travel & Tourism | 0.40% | 2.20% | 0.90% | 0.78% |
| Healthcare | 0.38% (Beauty as proxy) | 1.61% | 0.83% | — |
These benchmarks highlight where each platform shines. Meta consistently outperforms in conversion-heavy verticals, while TikTok and YouTube lean stronger in awareness and engagement-based sectors.
Don’t chase platform-wide “good” CTRs, instead benchmark against your vertical to spot underperformance and opportunity.
Why benchmarks vary: creative, placement & audience factors
Ad CTR isn’t just about the platform, it’s about how your content shows up and who sees it.
Creative format matters more than polish
TikTok’s own guidance shows that raw, native-looking content outperforms polished ads. Spark Ads using UGC often 2-3× the CTR of traditional in-feed creative because they feel organic, not staged.
Placement influences attention
Meta notes that Feed, Stories, and Reels placements have different user behaviors – scroll speed, tap zones, and attention spans all shift. Reels might lag in CTR but shine in engagement, while Feed placements tend to drive more direct clicks.
Audience targeting changes outcomes
Even with identical creative, CTR will swing based on who sees it. Warm audiences (e.g., retargeting or followers) typically click more often. Cold traffic needs stronger hooks and clearer offers to perform at benchmark levels.
High-performing CTRs come from creative-context match: native-feeling content, smart placements, and tight targeting, not just good editing.
Actionable frameworks to beat benchmark CTRs
If you’re falling short of “good” CTR benchmarks, it’s rarely a platform issue, it’s almost always creative. Here’s how top-performing brands optimize.
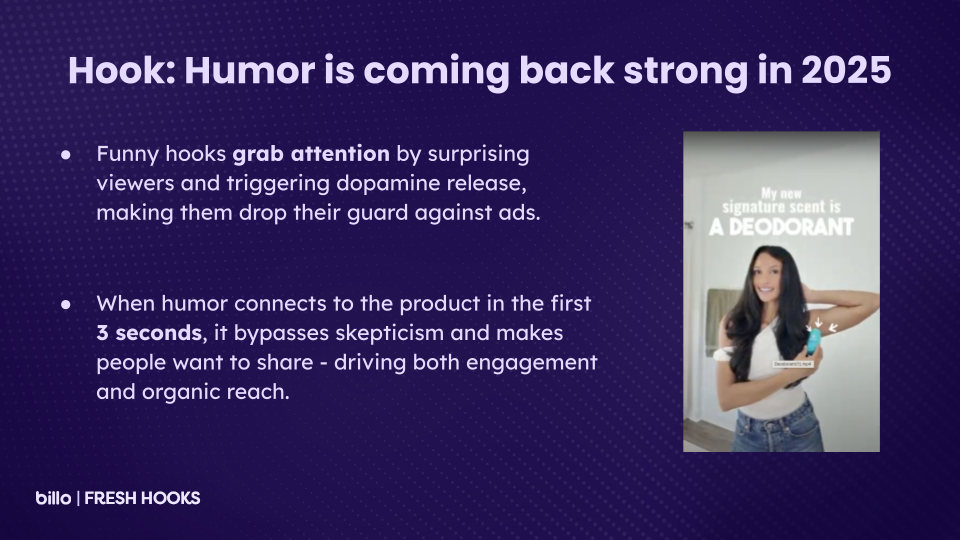
1. Hook hard in the first 3 seconds
Your opening frames determine everything. According to Lebesgue, 63% of top watched videos hit their key message in the first 3 seconds of the ad. Start with motion, unexpected visuals, or curiosity hooks.
Here is a guide on the best hooks tested by Billo.
2. Use UGC and creator-led formats
Influencer-driven Spark Ads on TikTok and Reels on Instagram double CTR compared to branded studio shoots. In a 2025 Zebracat study, Reels with creator content hit 38% CTR, far above static or corporate-looking alternatives.
3. Refresh creative weekly
Especially on TikTok, creative fatigue kicks in fast. Refreshing ads every 7-10 days prevents performance dips. Even small changes like swapping thumbnails on YouTube can bump CTR without a full reshoot.
4. Test fast, scale what works
Don’t just post – experiment. Test different hooks, creators, formats, and CTAs. Billo’s creator insights let you compare performance data (CTR, ROAS, Hook Rate) before you even produce an ad.
High CTRs aren’t a fluke, they’re the result of systematic creative testing, UGC-first strategies, and rapid iteration cycles.
Summary & next steps
There’s no one-size-fits-all answer to what is a good CTR, but there is a smarter way to beat yours.
Start by benchmarking against your platform and industry. If you’re below average, focus your efforts on creative testing, UGC formats, and high-attention placements like Spark or Reels. That’s where the real CTR gains happen.
With Billo, you can skip the guesswork. Our Creative Performance Engine matches you with creators whose content already outperforms the industry – so you’re not just making videos, you’re making ads that click.
Next move?
→ Pull your last 90-day CTR data
→ Compare it to the benchmarks in this post
→ Set top-quartile targets, then brief your next UGC test ad with Billo
Explore how UGC marketing and performance video ads can help you beat benchmark CTRs faster.
FAQs
How much does ad placement affect CTR?
A lot. On TikTok, TopView or Spark Ads can drive 5-10× higher CTR than standard In-Feed placements. On Meta, Reels often double the CTR of Feed ads when paired with UGC.
Is a low YouTube CTR bad?
Not necessarily. YouTube CTRs tend to be lower than Meta or TikTok. A TrueView CTR of ≥0.65% is solid, but also track view-through and conversion rates to get the full picture.
How often should I refresh creative?
Weekly on TikTok, bi-weekly on Meta. Ad fatigue hits fast on short-form platforms, refreshing helps keep performance strong and CPCs low.
Does higher CTR always lower CPA?
Generally yes. If the clicks come from the right audience. High CTR with low-quality traffic can still spike your CPA, so pair it with targeting and conversion metrics.

Authentic creator videos, powered by real performance data
22,000+ brands use Billo to turn UGC into high-ROAS video ads.


Why Repurposing Winning Ad Concepts Beats Consta...
Repurposing winning ad concepts changes how performance teams scale creative. [...]...
Read full article
From Guesswork to Growth: A Practical Creative T...
Ad-hoc creative testing often produces noisy results. When multiple variables [...]...
Read full article
Testing Ad Variations: How to Consistently Lift ...
Most performance gains come from better creative, not targeting tweaks. [...]...
Read full article

