Marketing efficiency ratio: why MER falls when your creative is working


Have you ever sat in a monthly review where every campaign dashboard looked fine, but the business had clearly become less efficient? Channel reports show respectable return on ad spend. The blended number says something else, and nobody in the room can explain the gap.
Picture the meeting. The paid social lead shows hook rates up. The search lead shows brand campaigns at 19x. Then finance puts up one slide: revenue divided by marketing spend, down for the second quarter running. Someone asks what’s wrong with the creative. Within a week, the team is rebuilding campaigns that were working fine.
Billo’s analysis of 88,329 Meta video ads suggests why this keeps happening. In the first half of 2026, average hook rate rose from 24.42% to 25.44% compared with the previous six months, and click-through rate improved in 11 of 14 categories. Over the same period, average ROAS across the benchmark set fell from 2.41 to 2.17. The creative got better at stopping the scroll and at earning the click, and the money still came back about 10% thinner.
Here is how to read your own MER properly, and where to look first when it starts to slip.
TL;DR:
- MER is total revenue divided by total marketing spend. No attribution windows and no platform maths.
- A “good” MER depends on your margin, not on a benchmark. Two brands at 3.0x can sit on opposite sides of profitable.
- In H1 2026, creative engagement improved while ROAS fell. Rising media prices, not weaker creative, explain most of the drop.
- When MER falls, check price first, then creative supply, then channel mix, then margin. The cheapest explanation to check is usually the right one.
What the marketing efficiency ratio actually measures
The formula is refreshingly simple.
If your store made $400,000 in revenue last month on $100,000 of total marketing spend, your MER was 4.0x. Some teams call it blended ROAS. It’s the same calculation under a different name.
MER is useful because of what it leaves out. No click windows, no view-through conversions, no pixel-attributed sales. Nothing an ad platform reports about itself goes into either side of the calculation.
That is also its biggest weakness. MER pools revenue from three very different sources: existing customers, owned channels like email and organic, and paid acquisition. A strong retention month can lift your MER while acquisition quietly gets worse.
Imagine a skincare brand with a steady $100,000 monthly spend. In March it does $400,000 in revenue: $160,000 from new customers and $240,000 from returning ones. MER is 4.0x. In April, a well-timed email launch pushes returning-customer revenue to $300,000, while new-customer revenue slips to $130,000. MER rises to 4.3x and everyone celebrates. Meanwhile, the brand acquired 19% less new revenue for the same money, and that problem will surface in next quarter’s retention numbers.
Read MER as a business health check, not a channel scorecard. For the channel-level view, you’ll want CPM, CPA and click-through rate beside it.
What a good MER looks like
This is the question everyone asks first. The useful answer starts with arithmetic, not a benchmark.
Work out what share of revenue you keep after cost of goods, shipping, fulfilment and merchant fees, but before ad spend. Your breakeven MER is one divided by that number:
A brand that keeps 40% of revenue before ad spend breaks even at 2.5x. A brand that keeps 25% breaks even at 4.0x.
Let’s make that concrete. Imagine two brands, an apparel label and a supplements company, both reporting a MER of 3.0x in the same quarterly review. At 3.0x, ad spend eats 33% of revenue.
- The apparel label keeps 40% before ads. After ad spend, it keeps roughly 7% of revenue. It’s profitable, if thin.
- The supplements company keeps 25% before ads. After ad spend, it loses roughly 8% on every dollar of revenue.
Same number on the slide, opposite outcomes. That’s why a benchmark borrowed from another brand is close to useless as a target.
The same logic gives you a goal, not just a floor. Say you keep 45% before ad spend and want to keep 20% after it. Ad spend then has to stay under 25% of revenue, which means holding MER at 4.0x or better.
For context, 299 DTC brands running $231M of Q1 2026 spend against $1.01B in revenue posted a median MER of 4.23x at a 29.3% contribution margin. Treat it as a reference point, not a target.
Check your category before you panic
Category matters more than most benchmark articles admit. Across the 88,329 Meta video ads in Billo’s H1 2026 analysis, average ROAS varied nearly fivefold across 14 categories:
| Category | Average ROAS, H1 2026 |
|---|---|
| Baby & Toddler | 4.99 |
| Electronics | 3.44 |
| Home & Garden | 2.83 |
| Food & Beverages | 2.51 |
| Other | 2.48 |
| Apparel & Accessories | 2.46 |
| Services | 2.27 |
| Arts & Entertainment | 2.04 |
| Sporting Goods | 2.02 |
| Business & Industrial | 1.84 |
| Health & Beauty | 1.82 |
| Toys & Games | 1.62 |
| Animals & Pet Supplies | 1.05 |
| Software | 1.04 |
| Cross-industry average | 2.17 |
Imagine you run paid media for a pet food brand and your Meta ROAS is 1.3x. Compared with the 2.17 cross-industry average, that looks like a crisis. Compared with other pet brands at 1.05, you’re outperforming your category by almost a quarter. The first reading leads to a creative overhaul. The second leads to a conversation about subscription retention and lifetime value, which is where pet brands usually make their money.
Set your MER target from your own cost structure, then compare yourself with last quarter, not with someone else’s margins.
MER vs ROAS, blended ROAS and CAC
These metrics answer different questions, and most reporting confusion comes from using one to answer another’s question.
- Channel ROAS counts only the revenue a specific platform claims credit for. It’s good for comparing creatives and campaigns inside one platform, because the measurement bias is at least consistent there.
- MER judges whether the business as a whole turns spend into revenue.
- CAC divides ad spend by new customers. It answers whether you’re buying customers at a price their lifetime value supports, the question MER deliberately blurs.
The gap between platform ROAS and reality has been measured, and it’s worth taking in. On the same Q1 2026 channel mix dataset, Meta acquisition campaigns reported 1.83x platform ROAS against 2.07x incremental ROAS, while Google Brand reported 19.07x against an incremental 5.72x.
In other words, brand search overclaims by more than three times, and acquisition campaigns slightly undersell themselves. Let’s say your team ranks channels by dashboard ROAS and trims whatever sits at the bottom. The first thing to go is the prospecting spend that feeds brand search in the first place. A few months later, brand search volume softens and nobody connects it back to that decision.
Why MER falls while channel reports look healthy
Let’s go back to the engagement data from the introduction. The story inside those six months is less tidy than the half-over-half comparison suggests.
The hook rate gain was front-loaded. The cross-industry average peaked at 26.52% in March, then fell every month to 23.99% by June. Click-through rate followed a similar pattern, peaking at 2.03% in February and sliding to 1.65% by June. Creative performance didn’t simply improve. It improved, then started giving those gains back within the same half.
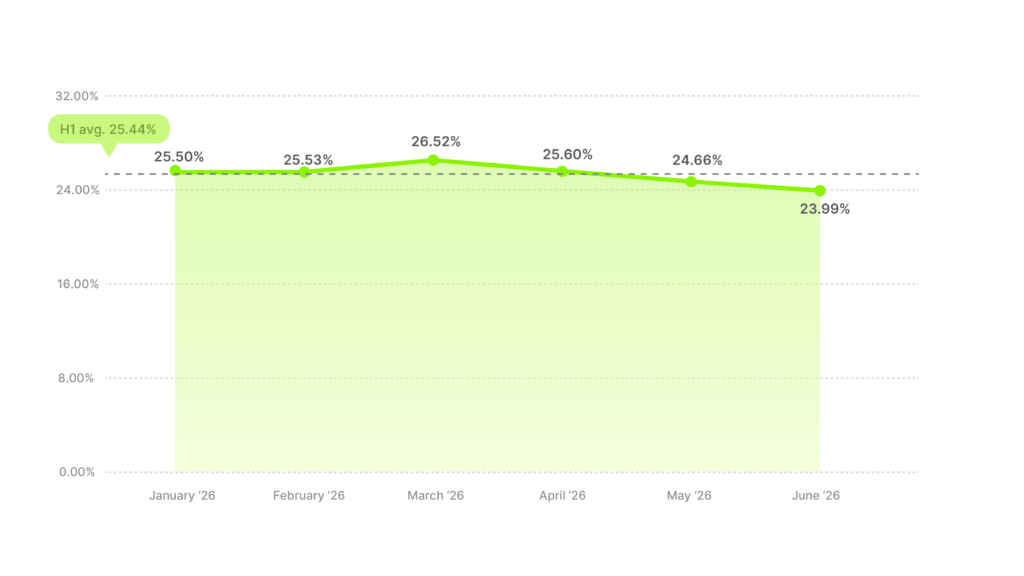
The category spread also widened. The gap between the best and worst categories on click-through rate grew from 0.64 percentage points in H2 2025 to 0.99 in H1 2026. The averages are hiding increasingly different experiences depending on what you sell.
Still, none of that explains a 10% drop in ROAS. Attention held up reasonably well. What changed was the price of buying it.
Media price: the cause nobody puts on the slide
DTC portfolio CPMs climbed from $9.84 in January 2024 to $13.00 in January 2025, then to $15.54 in January 2026 and $18.01 by March. That’s almost double in just over two years. Meta’s average price per ad also rose 12% year over year in Q2 2026.
The arithmetic that follows is unforgiving. When CPM rises and your budget stays the same, impressions fall proportionally. A 20% CPM increase removes 16.7% of every volume metric at once: impressions, clicks, add-to-carts and purchases all shrink together.
Imagine a brand spending $50,000 a month at a $15 CPM. That buys about 3.3 million impressions. At $18, the same $50,000 buys about 2.8 million. Hook rate, CTR and conversion rate can all stay perfectly flat, and the brand will still sell roughly 17% less. Every campaign dashboard shows the same healthy rates. Only the totals move.
Seasonality makes it worse. The October to November CPM jump in 2025 went from $17.13 to $21.55, a 26% rise on an already elevated base. If Q4 planning assumes last year’s efficiency, it’s already wrong.
The wider budget picture explains why this hurts so much right now. According to The CMO Survey 2026, marketing budgets now stand at 9.0% of company revenue, and their share of overall company budgets is the lowest since 2021. Overall marketing spend grew just 1.7%, while digital spend grew 8.2%. Teams are putting more of a tighter budget into channels that are getting more expensive.
Two quieter causes
Price is the loudest cause, but not the only one.
- Channel mix drift. MER moves whenever spend shifts toward brand terms or retention campaigns that were always going to look efficient. A few points of budget moving into brand search can flatter the blended number on its own.
- Margin drift. Discounting, higher shipping rates or rising fulfillment costs can leave MER flat while profitability erodes underneath it.
A four-step diagnostic for a falling MER
Work through these in order. The cheapest explanation to check is also the most common one, so start there.
1. Check the price you paid.
Pull the CPM trend for the same placements over the last 90 days before you touch anything else. A higher input cost isn’t a performance failure, and treating it as one sends teams rebuilding campaigns that were working.
2. Count your creative supply.
Look at how many new ads you launched per week and how many cleared meaningful spend. Across 504 stores and $3.35B in trailing-year Meta spend, only 7.2% of ads cleared $1,000 in spend and 0.9% became true winners. If launch volume dropped, MER was always going to follow.
3. Recalculate your mix.
Work out spend share by channel for the period, then re-weight it with incrementality factors before drawing any conclusions about efficiency.
4. Recompute contribution margin.
Contribution margin subtracts cost of goods, ad spend, shipping, fulfilment and merchant fees from net sales plus shipping revenue. Between 20% and 35% of net sales is generally considered healthy. It catches the profitability problems a stable MER can hide.
What this looks like in practice
Let’s walk through an example. A supplements brand made $500,000 in Q1 on $122,000 of total marketing spend, a MER of 4.1x. In Q2, spend held flat at $122,000 while revenue fell to $415,000. MER dropped to 3.4x, and the quarterly review opened with someone asking what happened to the creative.
Step one. CPM on their main placements rose 22% quarter over quarter. On a flat budget, that removes about 18% of impressions before anything else happens. Apply an 18% volume loss to Q1 revenue and you land at roughly $410,000, within a rounding error of what they actually made.
Steps two to four. Creative launches held at ten new ads a week. Hook rate was steady. Channel mix barely moved. Margin before ad spend held at 45%.
The diagnosis took ten minutes and ruled out three of the four causes. This was a price event, and rebuilding the campaigns would have cost a month and fixed nothing.
What the brand does need to decide is the margin question. At 45% before ad spend, breakeven sits at 2.2x, so 3.4x is still profitable. But contribution margin fell from 20.6% to 15.6% of revenue across the two quarters, moving the business from healthy to the edge of the danger zone. That’s a pricing and budget conversation, not a creative one.
Now imagine the same brand had also cut creative launches from ten a week to four over the same period. They’d be facing two compounding causes and a much longer recovery, and they’d have no way to tell which one did the damage without running the steps in order.
The timing trap
One detail makes step two harder than it looks. Because 70-75% of current spend carries forward month to month, a weak creative month depresses MER for several months after it happens.
Let’s say your team ships a thin batch of creative in April because of a product launch crunch. May looks fine, because April’s spend is still riding on February and March winners. MER starts slipping in June, by which point everyone has forgotten April. The good news is that fatigue signals, like the steady hook rate decline in the H1 data, usually show up well before the MER decline does. Watch hook rate and CTR trends weekly, even if you only act on MER monthly.

The creative supply problem
Most teams treat creative volume as a production constraint. The data suggests treating it as the main input to blended efficiency.
The distribution is brutally top-heavy. In the $3.35B dataset, 74% of ads received barely any spend, 24% cleared $100, and roughly 1% of new ads absorbed 41% of new ad spend.
An independent dataset lands in the same place. Across 578,750 creatives and $1.29B of Meta spend from 6,015 advertiser accounts, about 5% of creatives became winners and 55% of spend concentrated on them. Enterprise advertisers shipped 18.8 new creatives per week.
Here’s why that matters for your Monday planning. More volume doesn’t improve the odds of any single creative. It improves your chances of finding the one that carries the account.
Let’s put numbers on it. A brand launching ten new ads a week ships about 520 a year. At a 0.9% win rate, that’s four or five true winners a year, roughly one a quarter. Cut to five ads a week and you’re down to two or three winners a year. There will be whole quarters with no new winner at all, and the account will run on ageing creative while CPMs keep climbing. I am sure you can guess what MER does next.
The same logic scales with budget. Imagine two brands, each spending $200,000 a month. The one with a strong creative hit rate needs 40 new ads to sustain that spend, while the one with a weak hit rate needs 200. Same budget, same platform, five times the production requirement.
If your MER is falling and your creative output is flat, you’ve probably found your answer.
Summary and next steps
MER earns its place because it’s the one number an ad platform can’t influence. It won’t tell you which campaign to pause, and it was never meant to. What it tells you is whether the money you put in came back out.
Three things to take into your next review:
- Calculate your breakeven MER from your own margin before ad spend, and judge your actual MER against that, not against someone else’s benchmark.
- Run the four checks in order, price first and margin last, before you change a single budget.
- Set a weekly creative volume floor based on your spend level, and treat it as a fixed cost of holding efficiency steady.
When you present MER, pair it with contribution margin and show the inputs beside it. Being able to show that engagement held while efficiency fell moves the conversation away from “the creative isn’t working” and toward the actual cause.
Step one of the diagnostic is easier when you know where your numbers sit against your category. Checking your hook rate, CTR and ROAS against Billo’s video ad benchmarks takes a few minutes and tells you whether the problem sits upstream of your creative or inside it.
FAQs
What is a good marketing efficiency ratio?
Is MER the same as blended ROAS?
How often should I check MER?
Can MER be misleading?

SEO Lead
Passionate content and search marketer aiming to bring great products front and center. When not hunched over my keyboard, you will find me in a city running a race, cycling or simply enjoying my life with a book in hand.
Make creator marketing a data-backed growth channel

Related from Creative Insider

AI Generated Ads vs. Human UGC: What the Performance Data Actually Shows

2026 Black Friday Benchmarks: What Your Hook Rate, CTR & ROAS Should Look Like

The Creative Operations Setup Paid Social Actually Needs