What the data told us
1. How much a category swings from month to month depends on how it gets bought. The widest swings belong to categories where nobody buys until a budget gets approved, a contract comes up for renewal, or a deal appears. The steadiest belong to categories people buy whenever they run out. Business & Industrial moved 1.53 pp across the half, against 0.28 pp for Apparel & Accessories.
2. The cross-industry average peaked in February, but only three categories did. Six peaked in May instead, and one peaked in June. If you’re planning around the month the market is strongest, you’re planning around a month your own category probably doesn’t share.
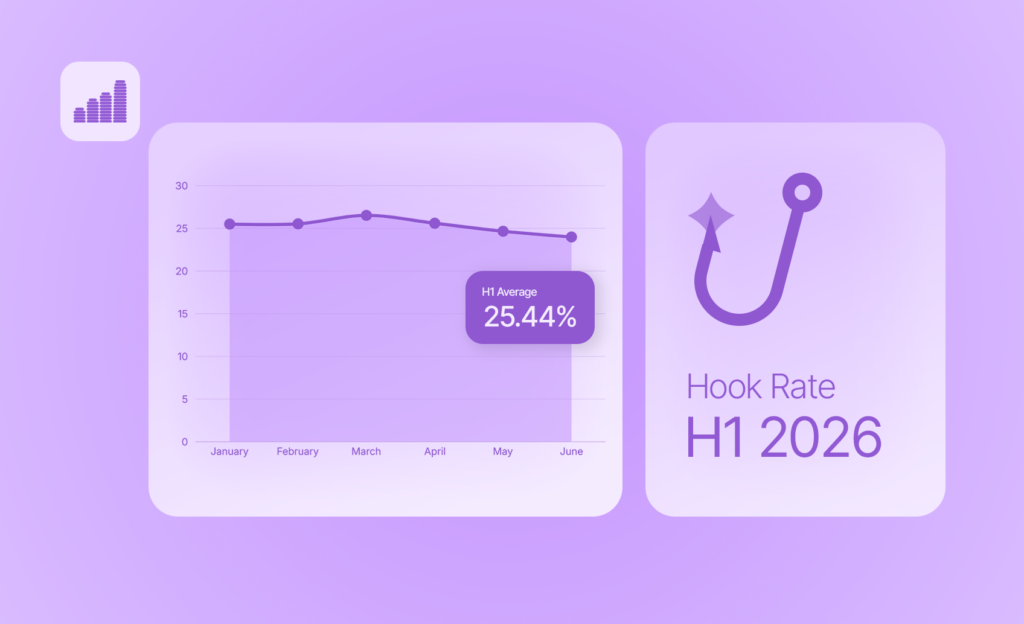
3. Two categories got better at earning attention and worse at earning the click. Business & Industrial and Sporting Goods both raised their hook rate this half while their CTR went the other way. They’re the only two that split like that, and they’re also the only two categories in the report that finished lower than last half.
Overall CTR trend, H1 2026
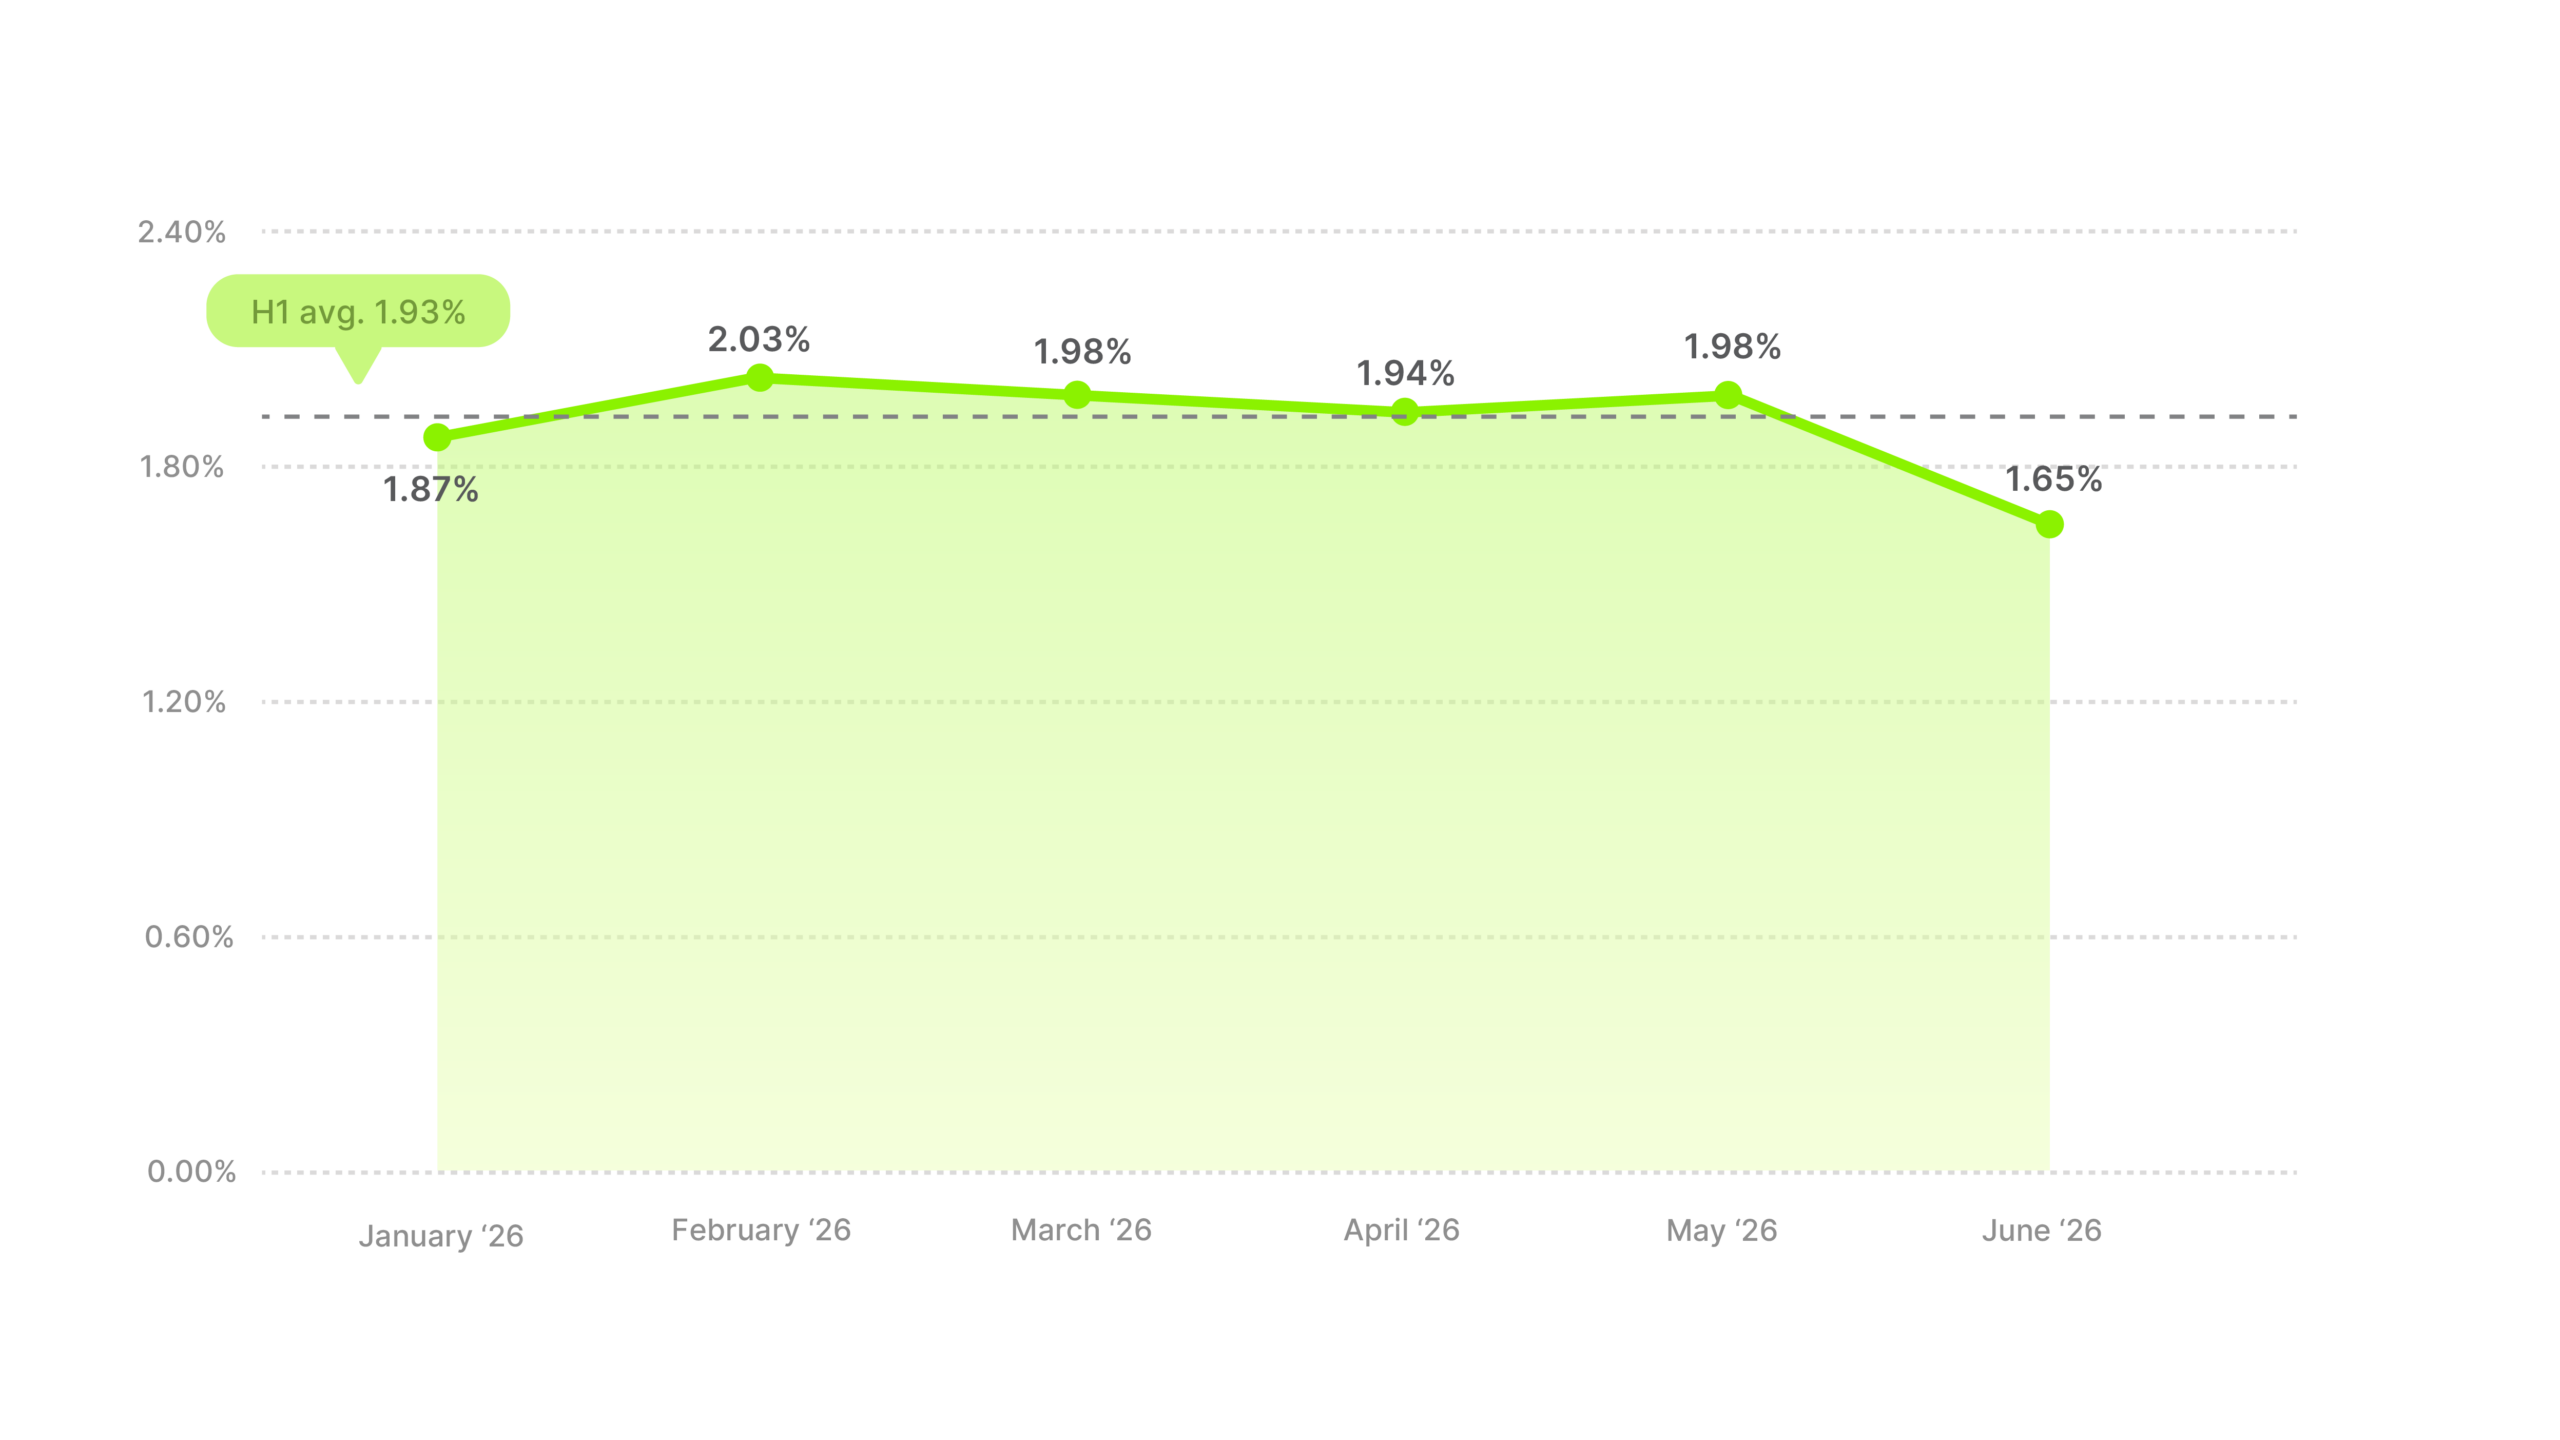
CTR opened at 1.87% in January, reached 2.03% in February, and held between 1.94% and 1.98% for three months before dropping to 1.65% in June. Highest month to lowest was 0.38 pp.
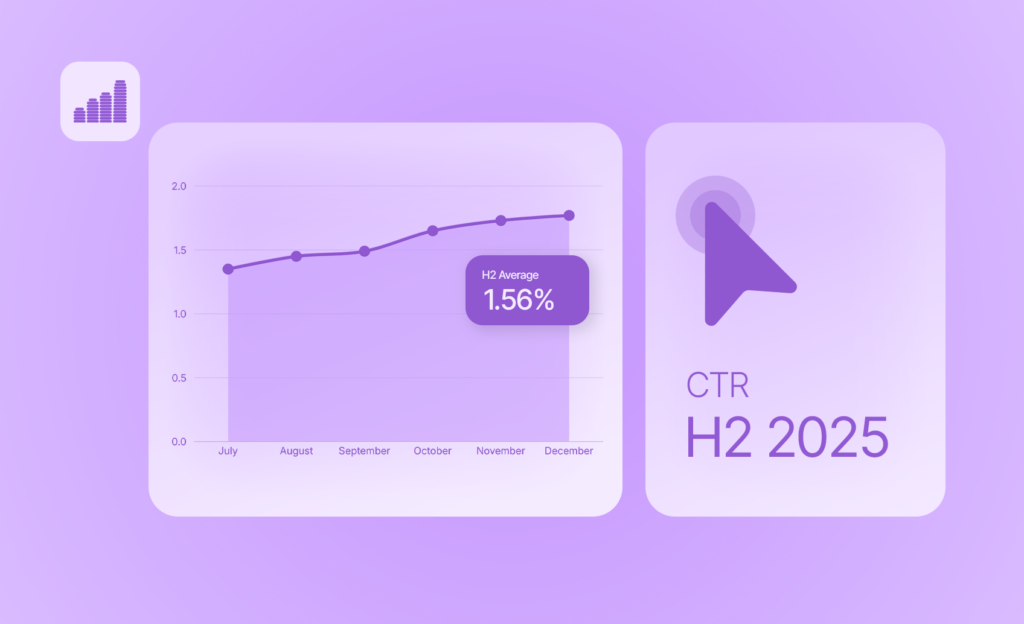
Last half was the opposite. From July to December 2025 the cross-industry average rose every month with no reversals, 1.35% to 1.77%. H1 2026 climbed once, into a four-month plateau, then gave back more ground in June alone than any single month of last half had gained.

June was the lowest month for eight of the fourteen categories. Only Arts & Entertainment actually rose in June, reaching 2.43%, its best month of the half. Sporting Goods came closest to joining it, peaking at 1.74% in May and holding 1.67% in June to finish near its high while most of the table finished at its low.

Use 1.93% as your baseline, and check the month before you judge the number against it. Hitting 1.93% in February left you just short of the market. Hitting the same 1.93% in June put you well clear of it.
CTR benchmarks by industry
The fourteen categories ranged 0.99 pp, from Health & Beauty at 2.36% down to Baby & Toddler at 1.37%. Last half that range was 0.64 pp. Almost every category improved and they still finished further apart than they started.
The middle of the table came apart too. Last half the six categories bunched in the middle were separated by a total of 0.07 pp, which is no separation at all. This half there’s a group above 2%, a floor below 1.55%, and the seven categories in between are spread across more than four times the range those six shared.
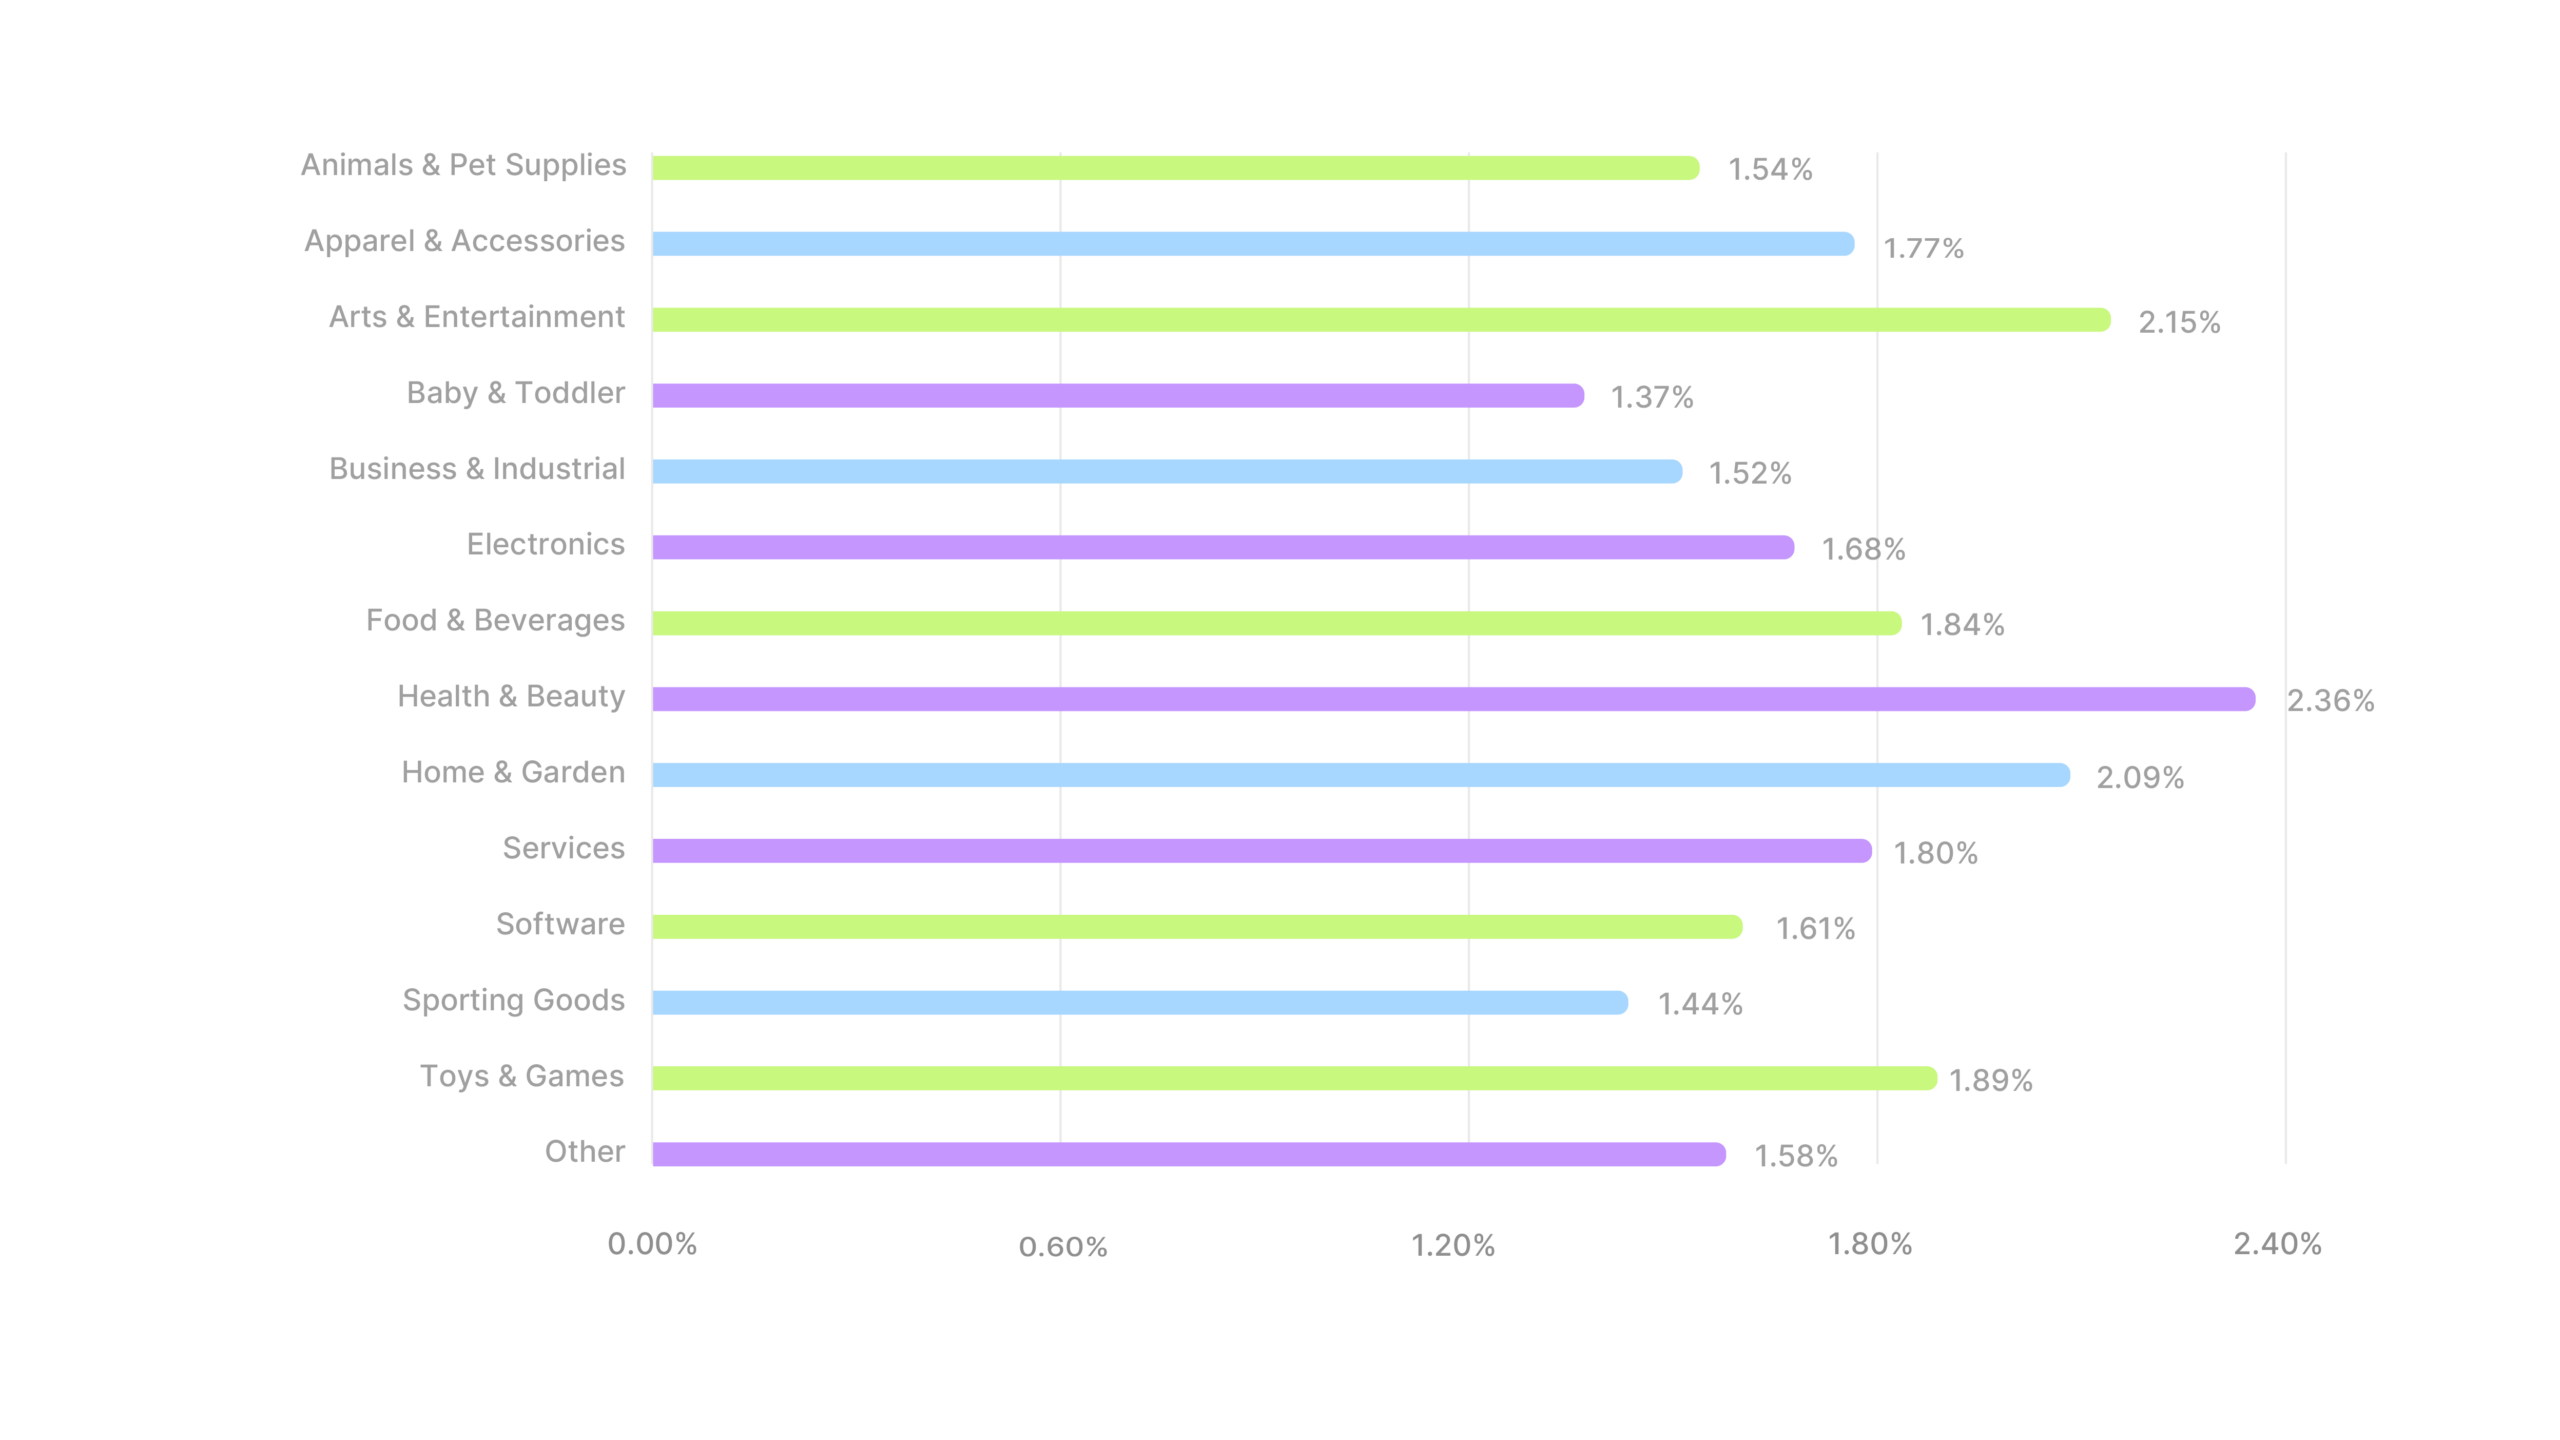
Toys & Games gained the most, 1.30% to 1.89%. Health & Beauty added 0.46 pp on top of an average that was already at the top of the report, and Food & Beverages and Services each gained 0.33 pp. Eleven of the fourteen finished higher than last half.
Only two finished lower, and both by a hair. Business & Industrial slipped 0.02 pp and Sporting Goods 0.03 pp. Both of them raised their hook rate across the same six months.
The categories that swung most are the ones where buying needs something to happen first. Business & Industrial moved 1.53 pp between its best month and its worst, Electronics 1.15, Services 0.81 and Software 0.67. In all four, people don’t buy until a budget gets approved, a contract comes up for renewal, or a deal appears. Those moments don’t spread evenly across six months.
Apparel & Accessories sat at the other end, moving 0.28 pp across the whole half, with Animals & Pet Supplies and Baby & Toddler at 0.32. People buy those when they need them, which is every month.
Industry deep dives
Fourteen categories below, each with its monthly line, its half-over-half change, and what it means for your strategy. Find yours and benchmark against its number, not against the cross-industry number.
Animals & Pet Supplies opened at its best month and never got back there. January reached 1.71% and February held 1.67%, then March and April sat at 1.39% and 1.40% before a May recovery to 1.59% and a 1.45% finish.
Industry CTR average
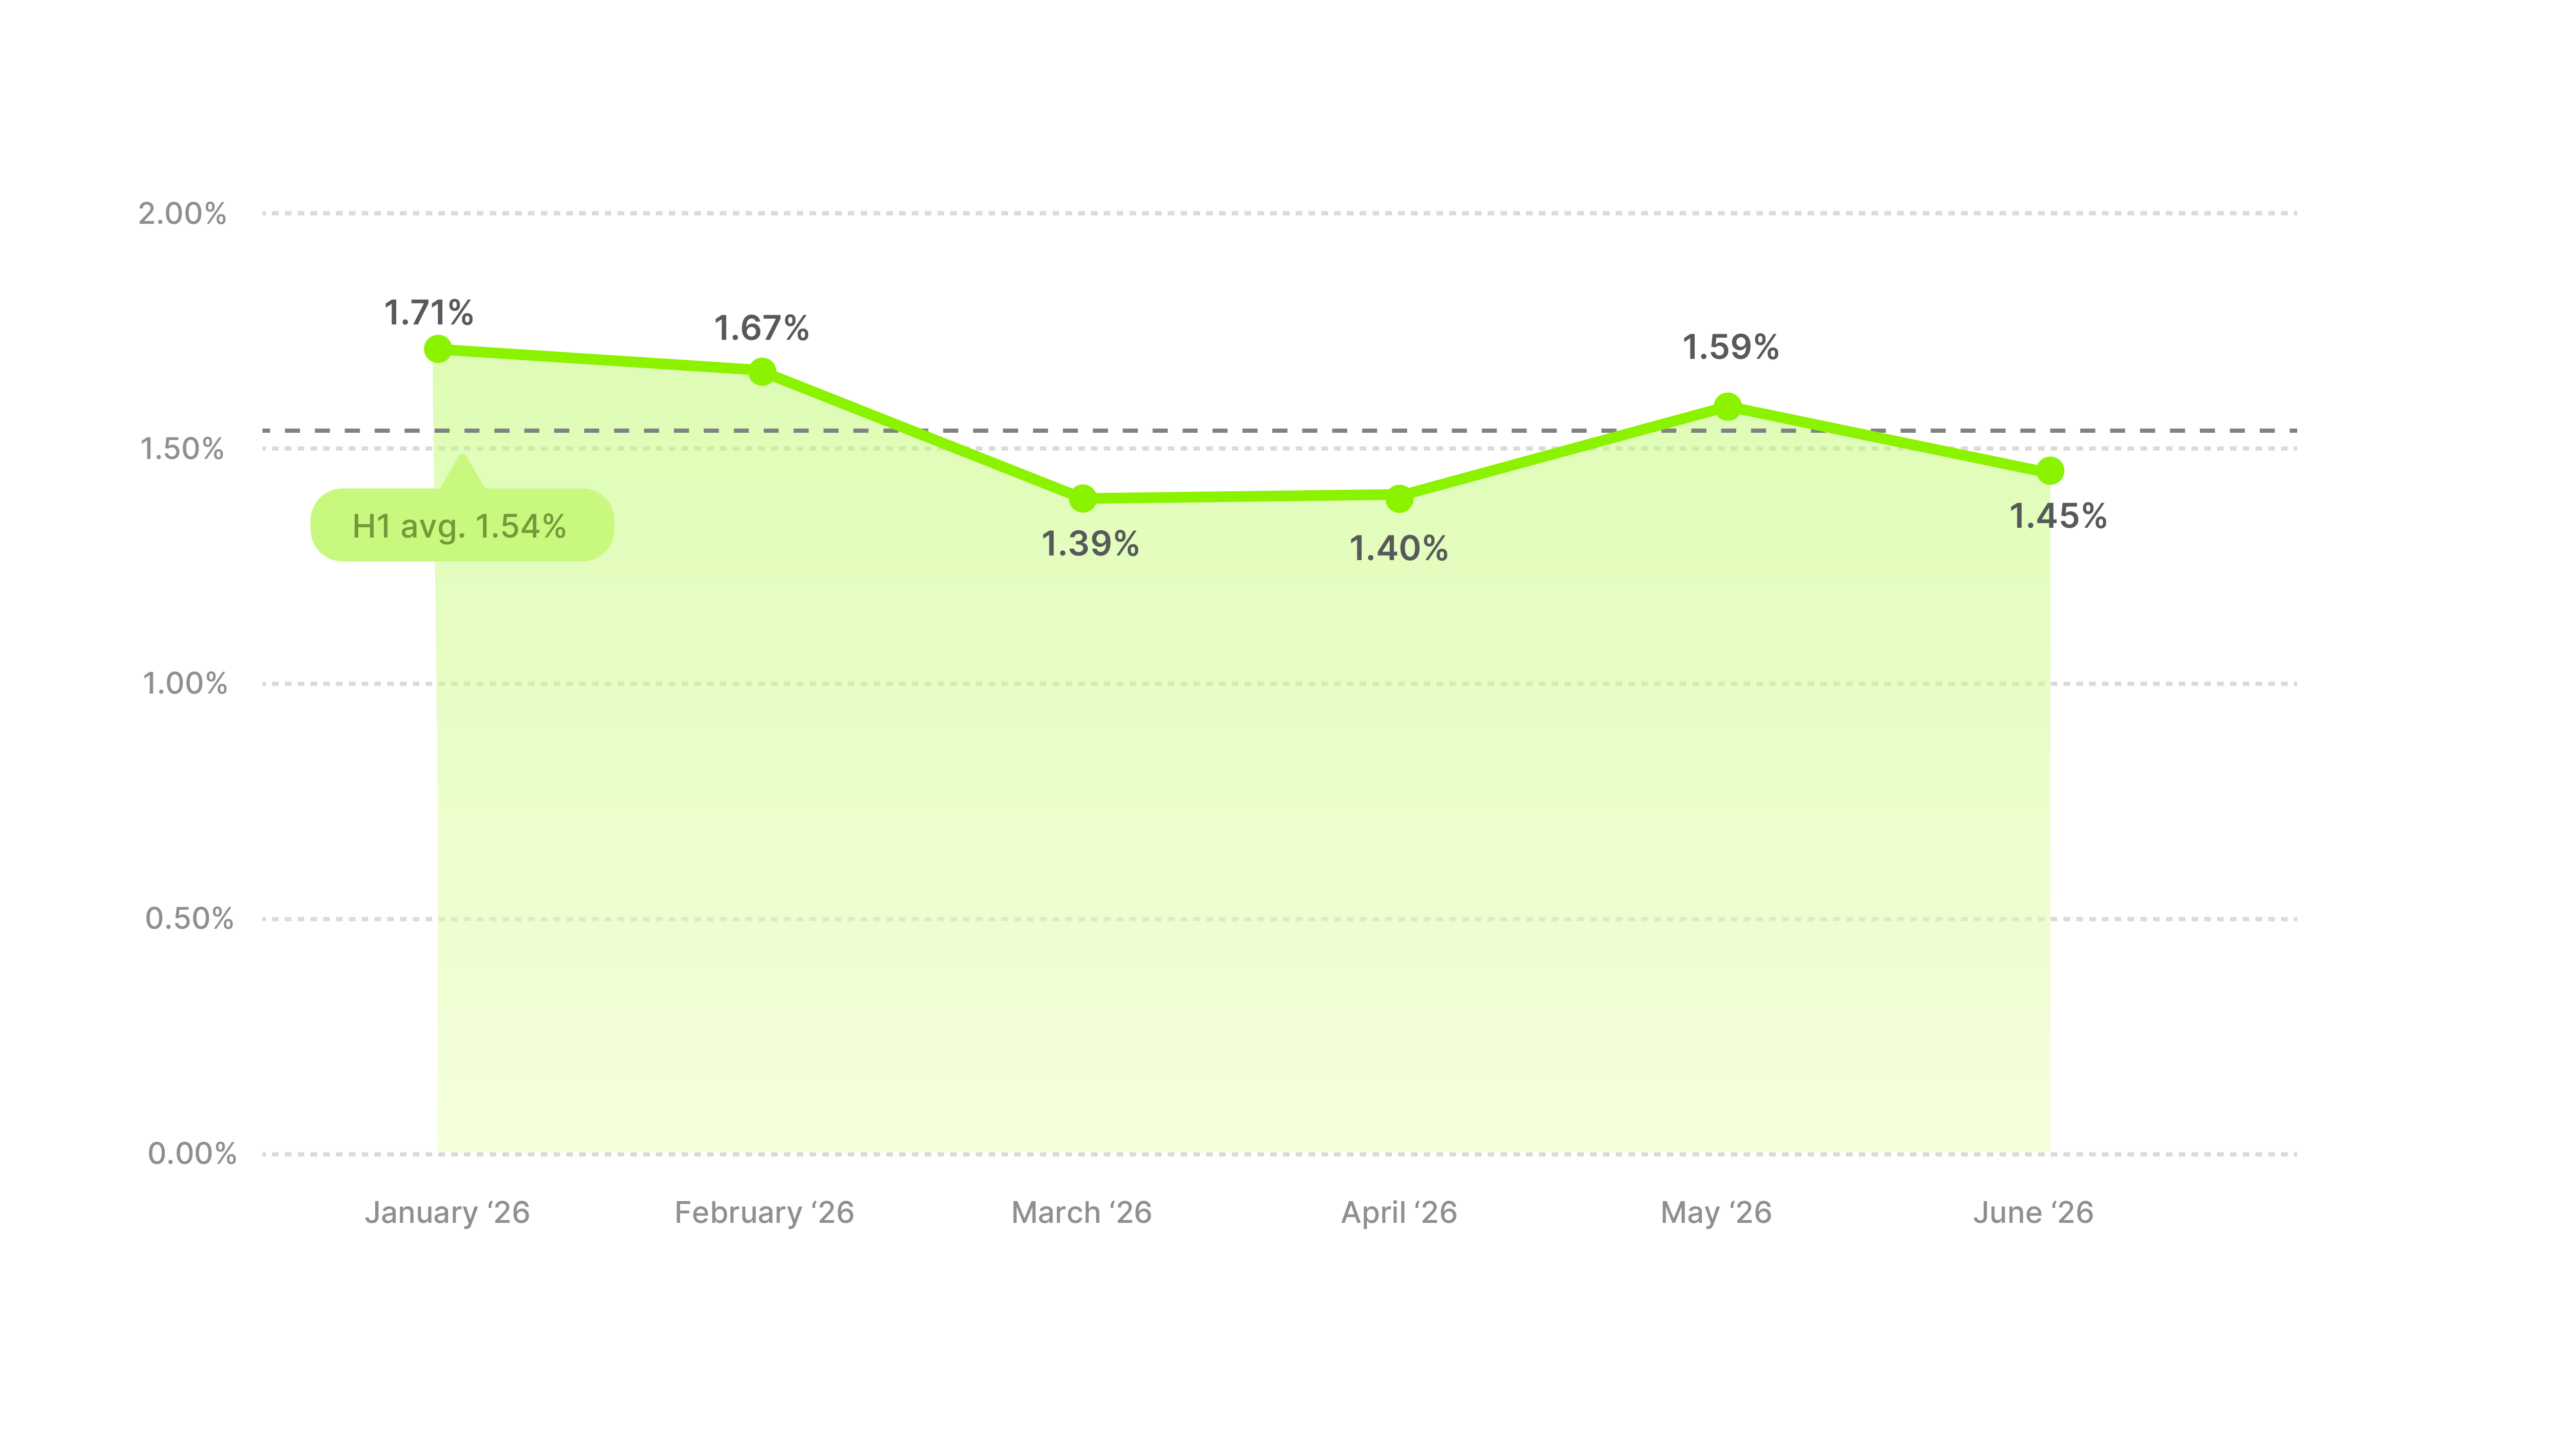
That middle dip ran against the market. March and April were the two lowest months Animals & Pet Supplies recorded all half, and they’re the same two months the cross-industry average spent sitting between 1.94% and 1.98%.
Last half ran the other way round. H2 2025 bottomed out in July at 0.82%, the weakest month any category recorded that half, then climbed to an October peak. When buying runs on need instead of a calendar, one half doesn’t tell you much about the next.
The half-average rose from 1.36% to 1.54%. Benchmark to 1.54% for the half, since the monthly line in this category hasn’t repeated itself once across two halves of data.
Getting above 1.54% means giving the viewer a reason to click today rather than the next time the bag runs out, such as a subscription discount, a bundle, or a first-order offer. When the calendar supplies no timing, the offer has to.
Apparel & Accessories ran the flattest line in the report. January through April sat between 1.74% and 1.77%, four months inside three hundredths of a point, then May reached 1.93% and June fell to 1.65%. The whole half covered 0.28 pp.
Industry CTR average
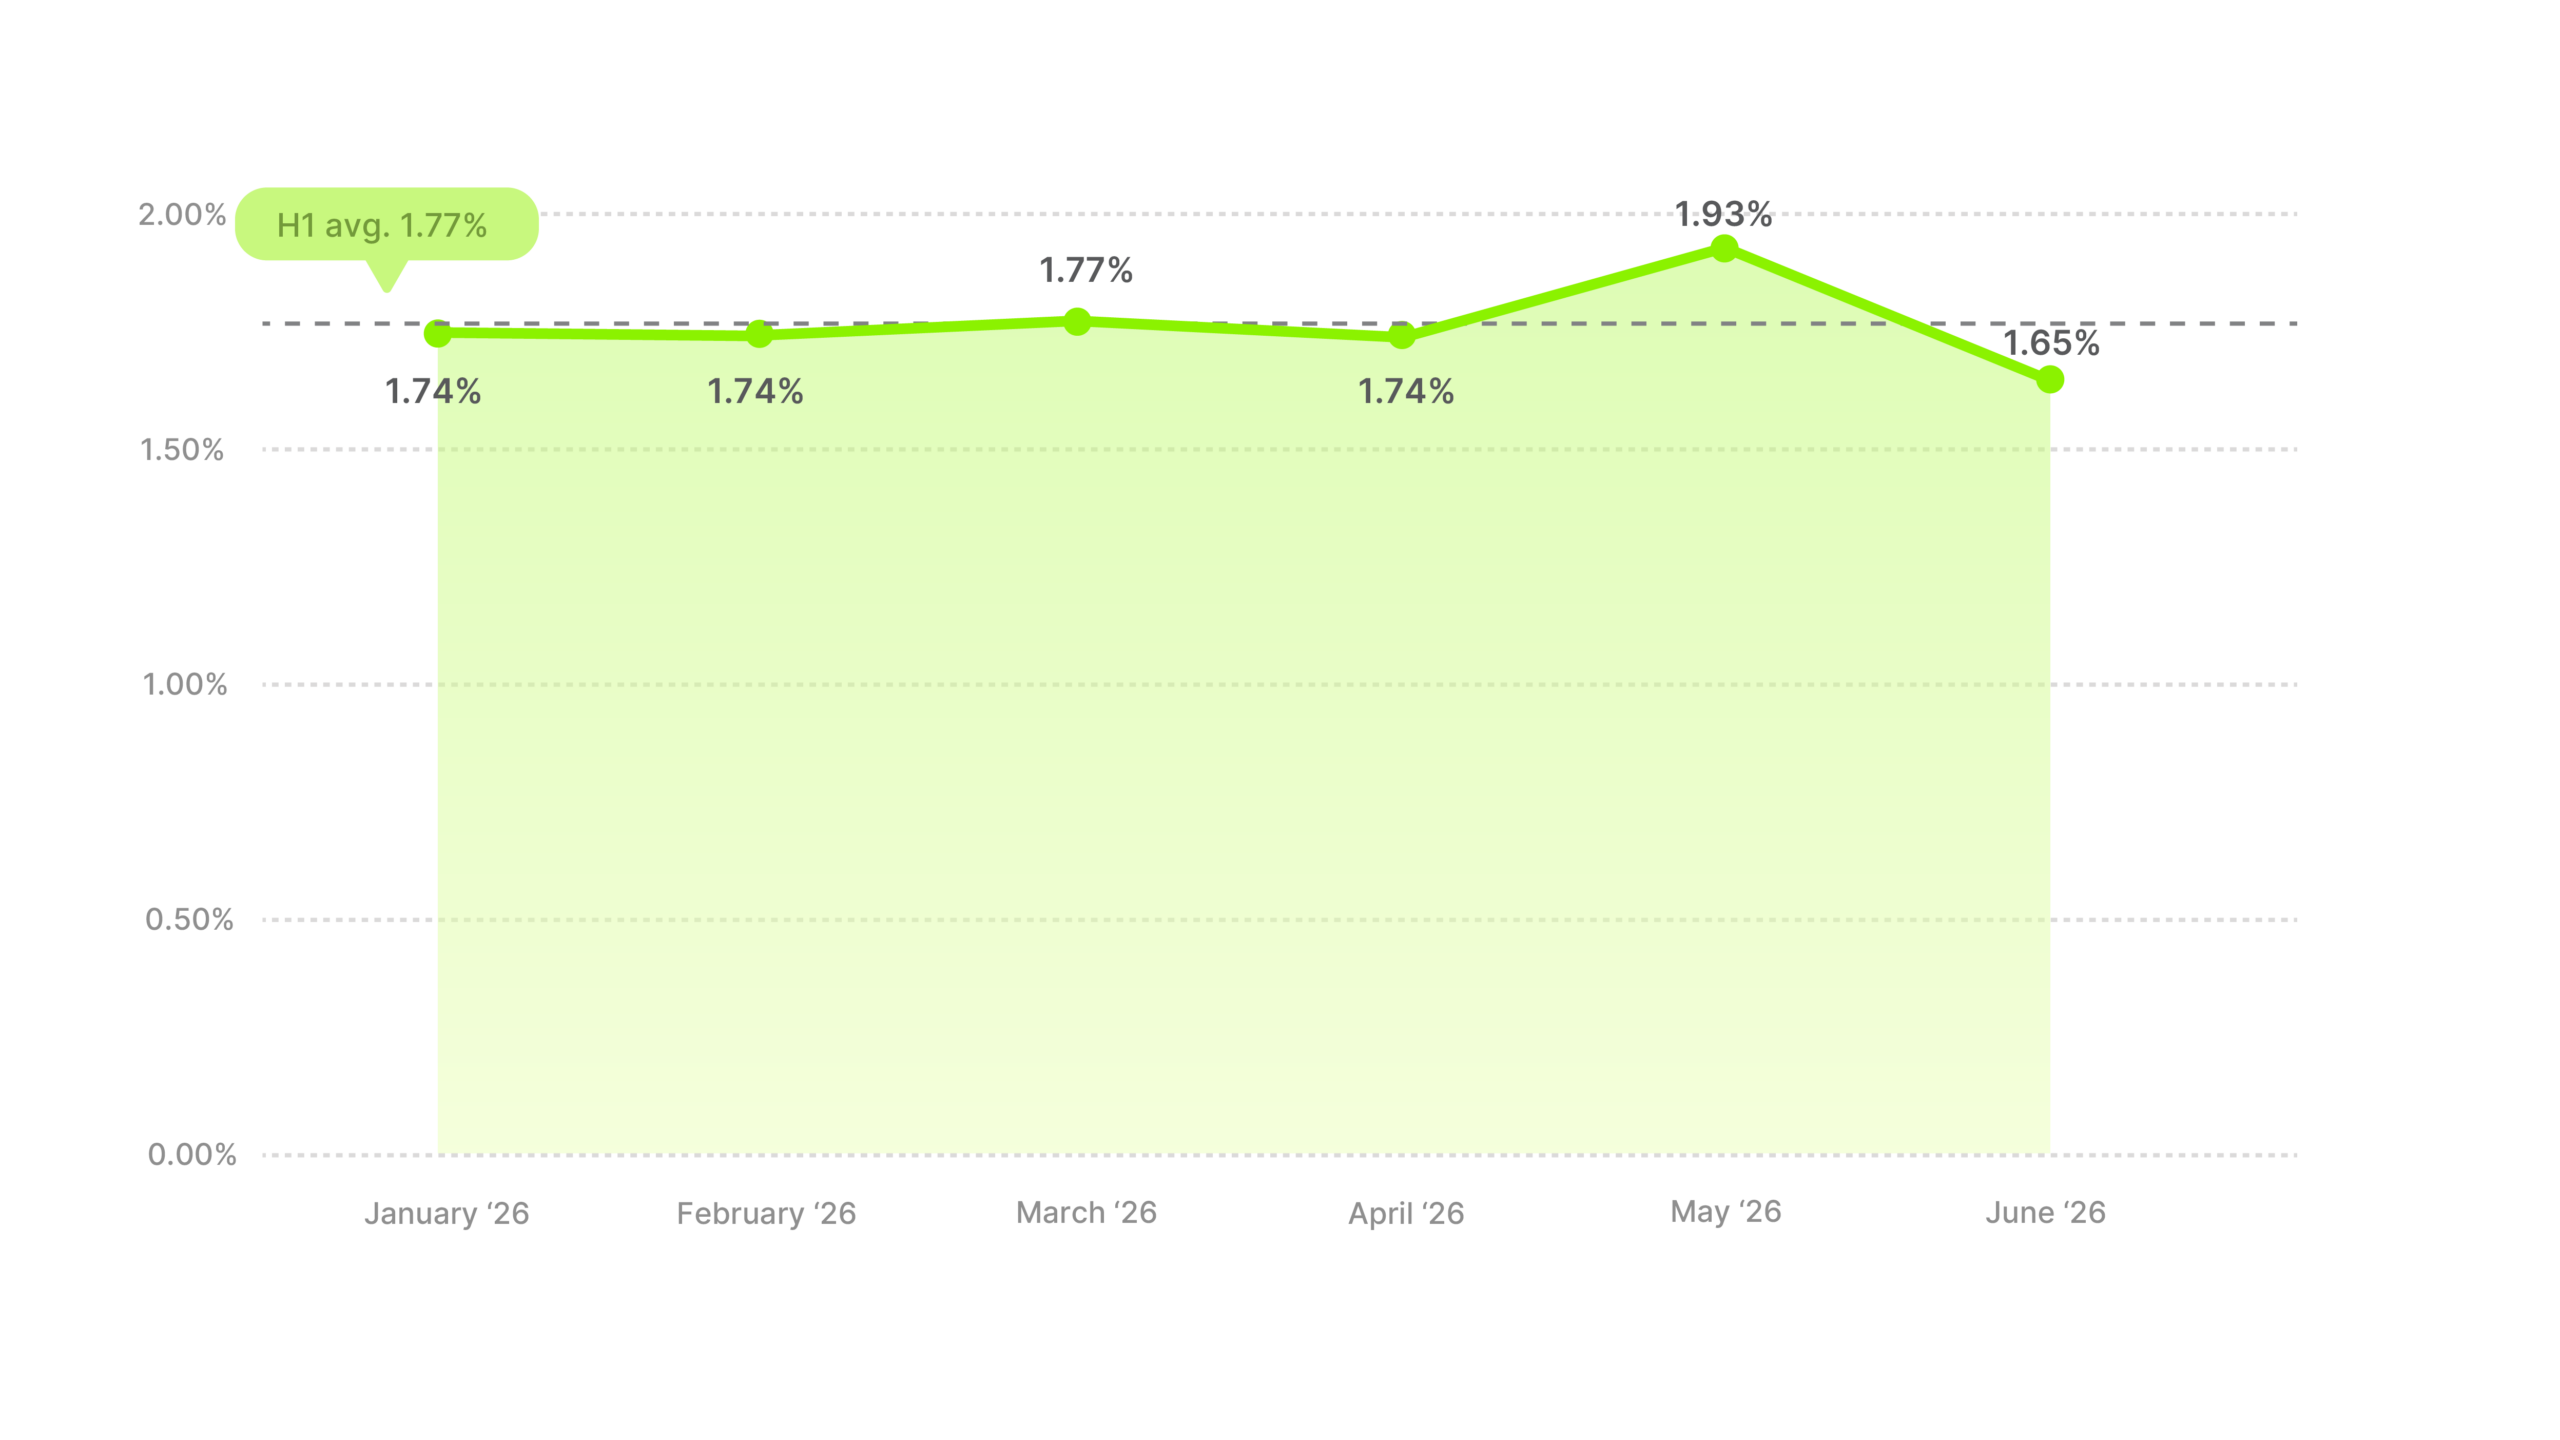
May is the one month that stands out, and it’s the one to plan around. Apparel & Accessories reached 1.93% then, well above its own 1.74% baseline, though still short of the 1.98% the market averaged that month.
Half over half the level rose from 1.54% to 1.77%, a real gain in a category that barely moves month to month.
To beat 1.77%, treat May as the whole game and the rest of the half as maintenance. Four flat months at 1.74% is what Apparel & Accessories does when nothing on the calendar is prompting the click.
Arts & Entertainment finished second in the report at 2.15%, and it was the only category whose best month was June. February dipped to 1.87%, and every month after that came in higher than the one before it, through 2.06% and 2.08% to 2.41% in May and 2.43% in June.
That’s the opposite of what the market did. June was the lowest month for eight of the fourteen categories and the lowest month for the cross-industry average, and Arts & Entertainment spent it at its high.
Industry CTR average
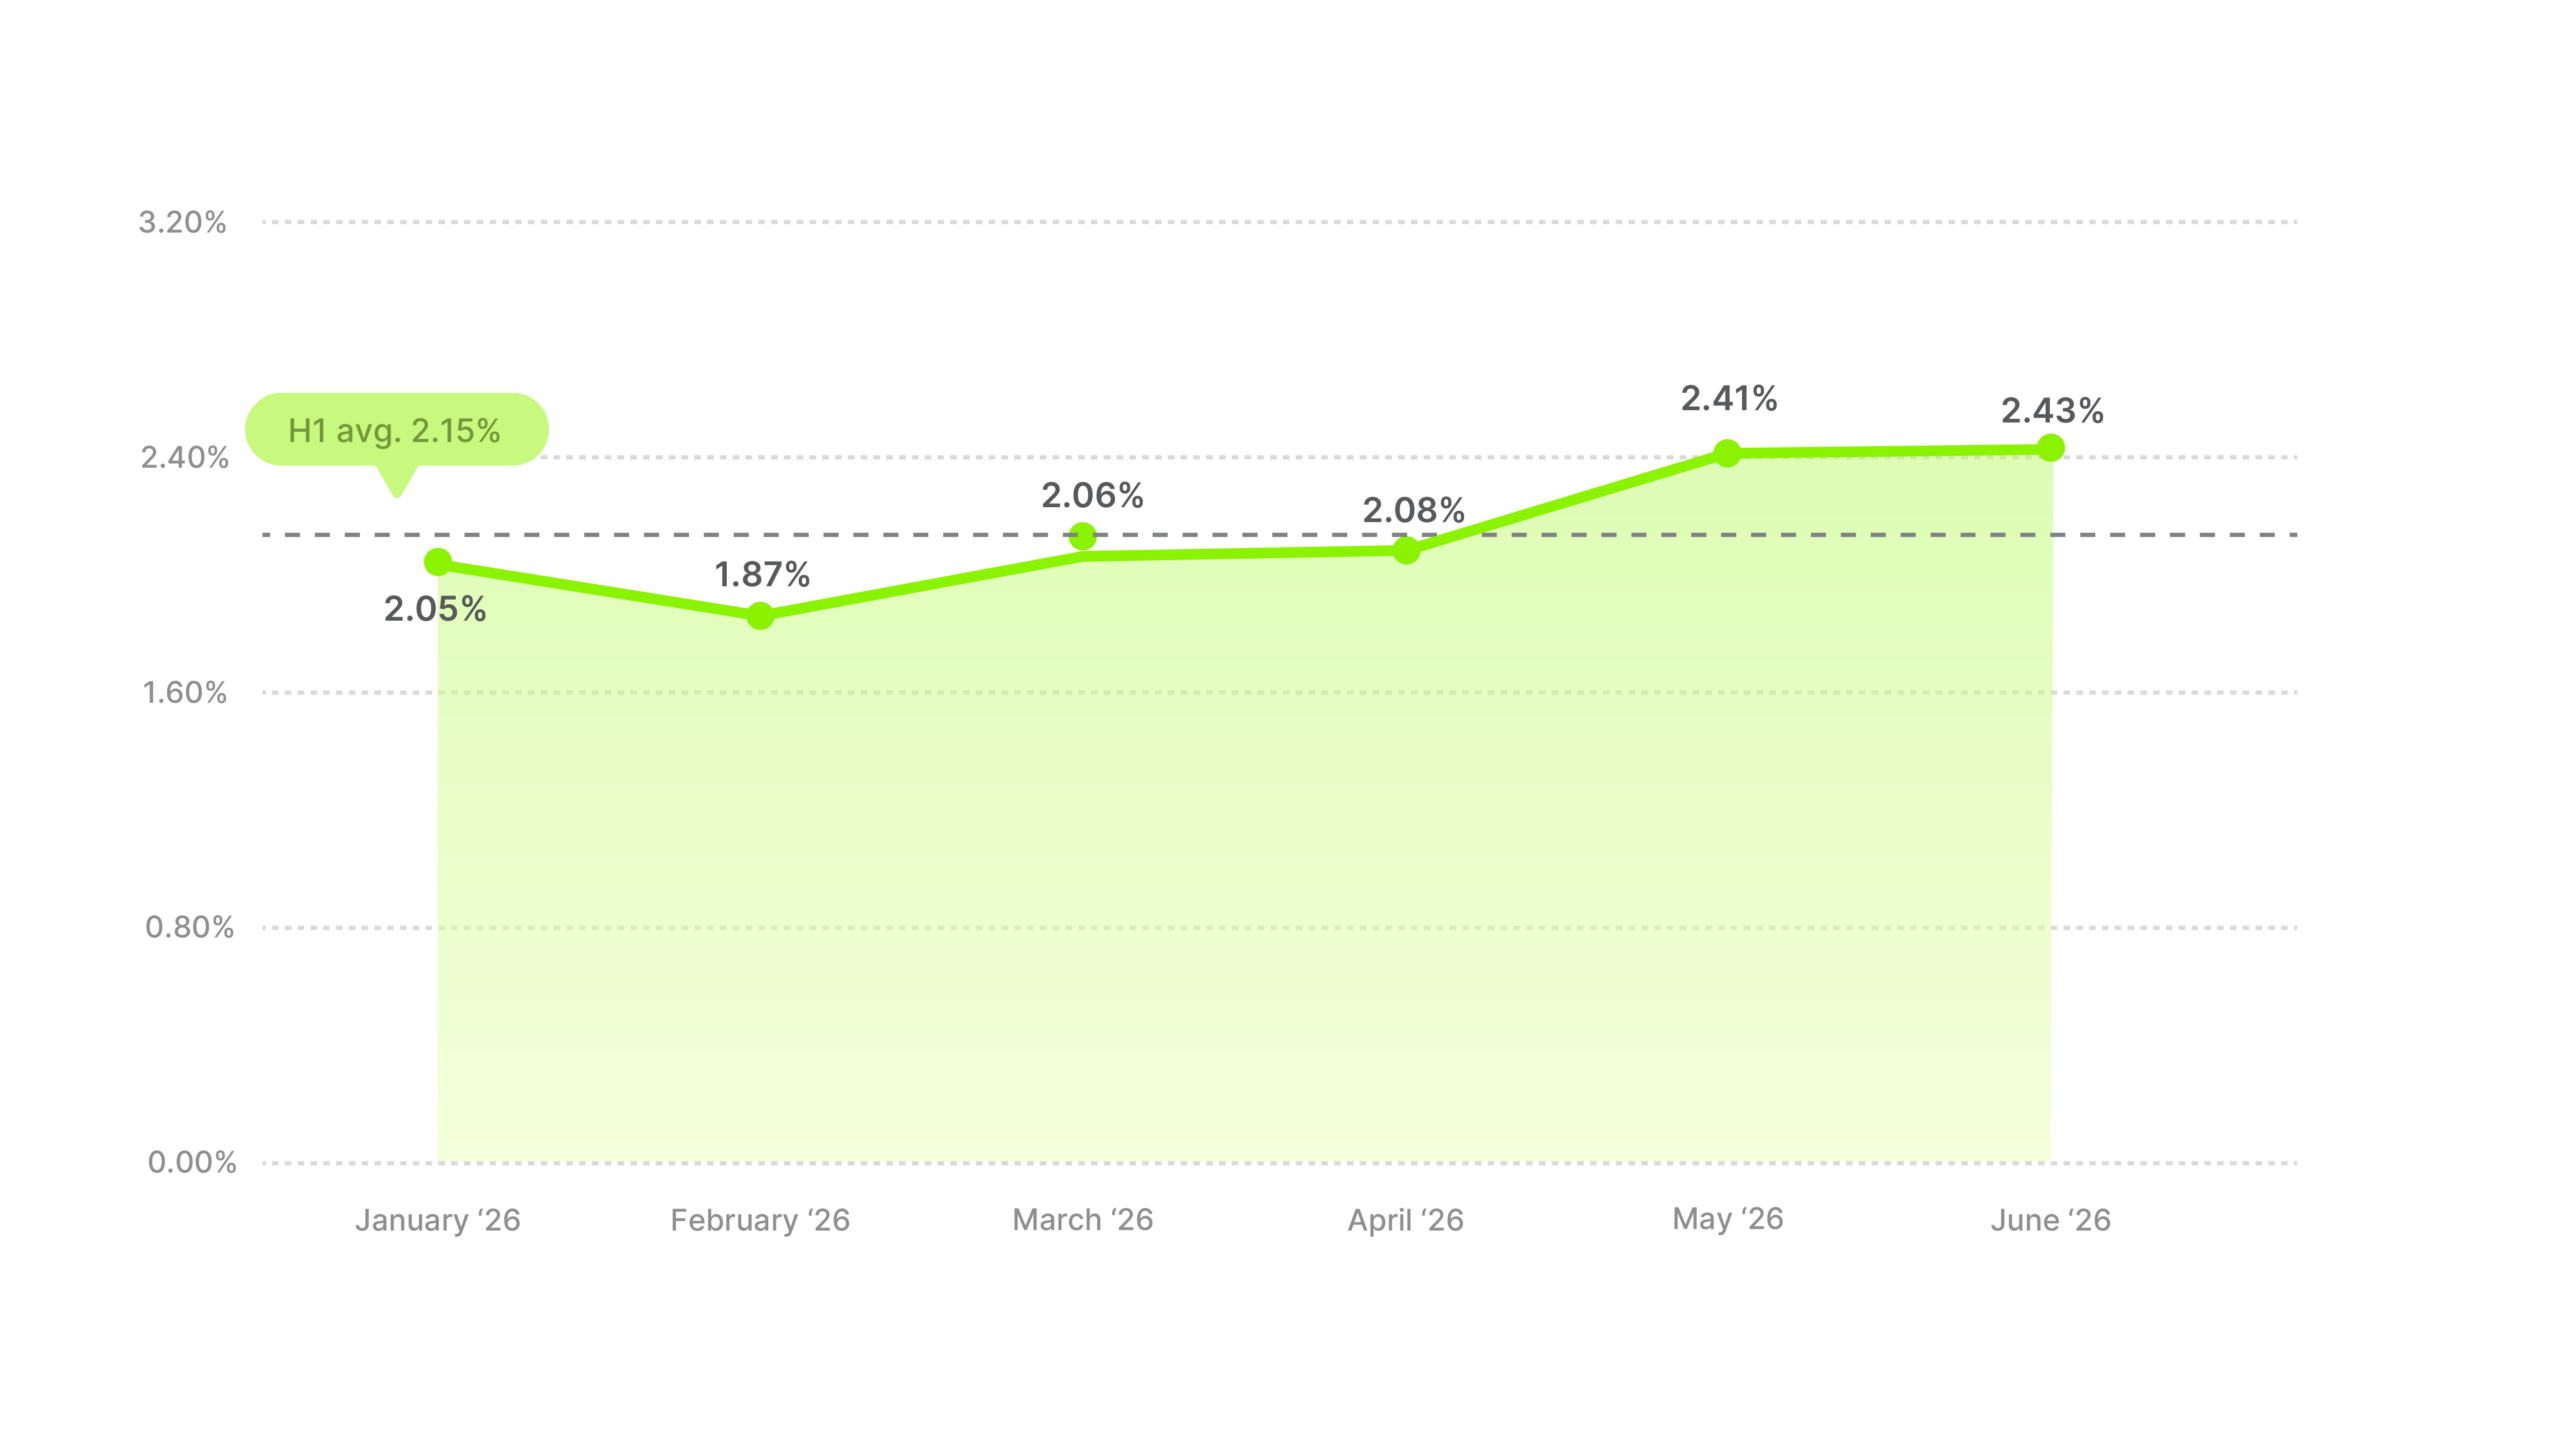
The likely reason is the events calendar. Festivals, tours and live events cluster in late spring and summer, which is exactly when Arts & Entertainment peaked, and the hobby and game side of the category sells against the same free time that opens up once school ends.
There’s a structural reason the level is high too. A craft kit or a game is an easy yes, so the click costs the viewer very little.
Against last half’s 1.87% that’s a 0.28 pp gain, and here the direction matters more than the level.
Most categories entered the back half of 2026 falling. Arts & Entertainment entered it at its best reading of the year, which gives it the clearest case in this report for spending more in H2 than you did in H1. Benchmark to 2.15%, and don’t write June’s 2.43% off as a one-off unless the next half says it was.
Baby & Toddler had the lowest CTR in the report at 1.37%, the same position it held last half. The monthly line zigzagged between 1.28% and 1.48% for five months and finished at 1.16% in June.
Industry CTR average
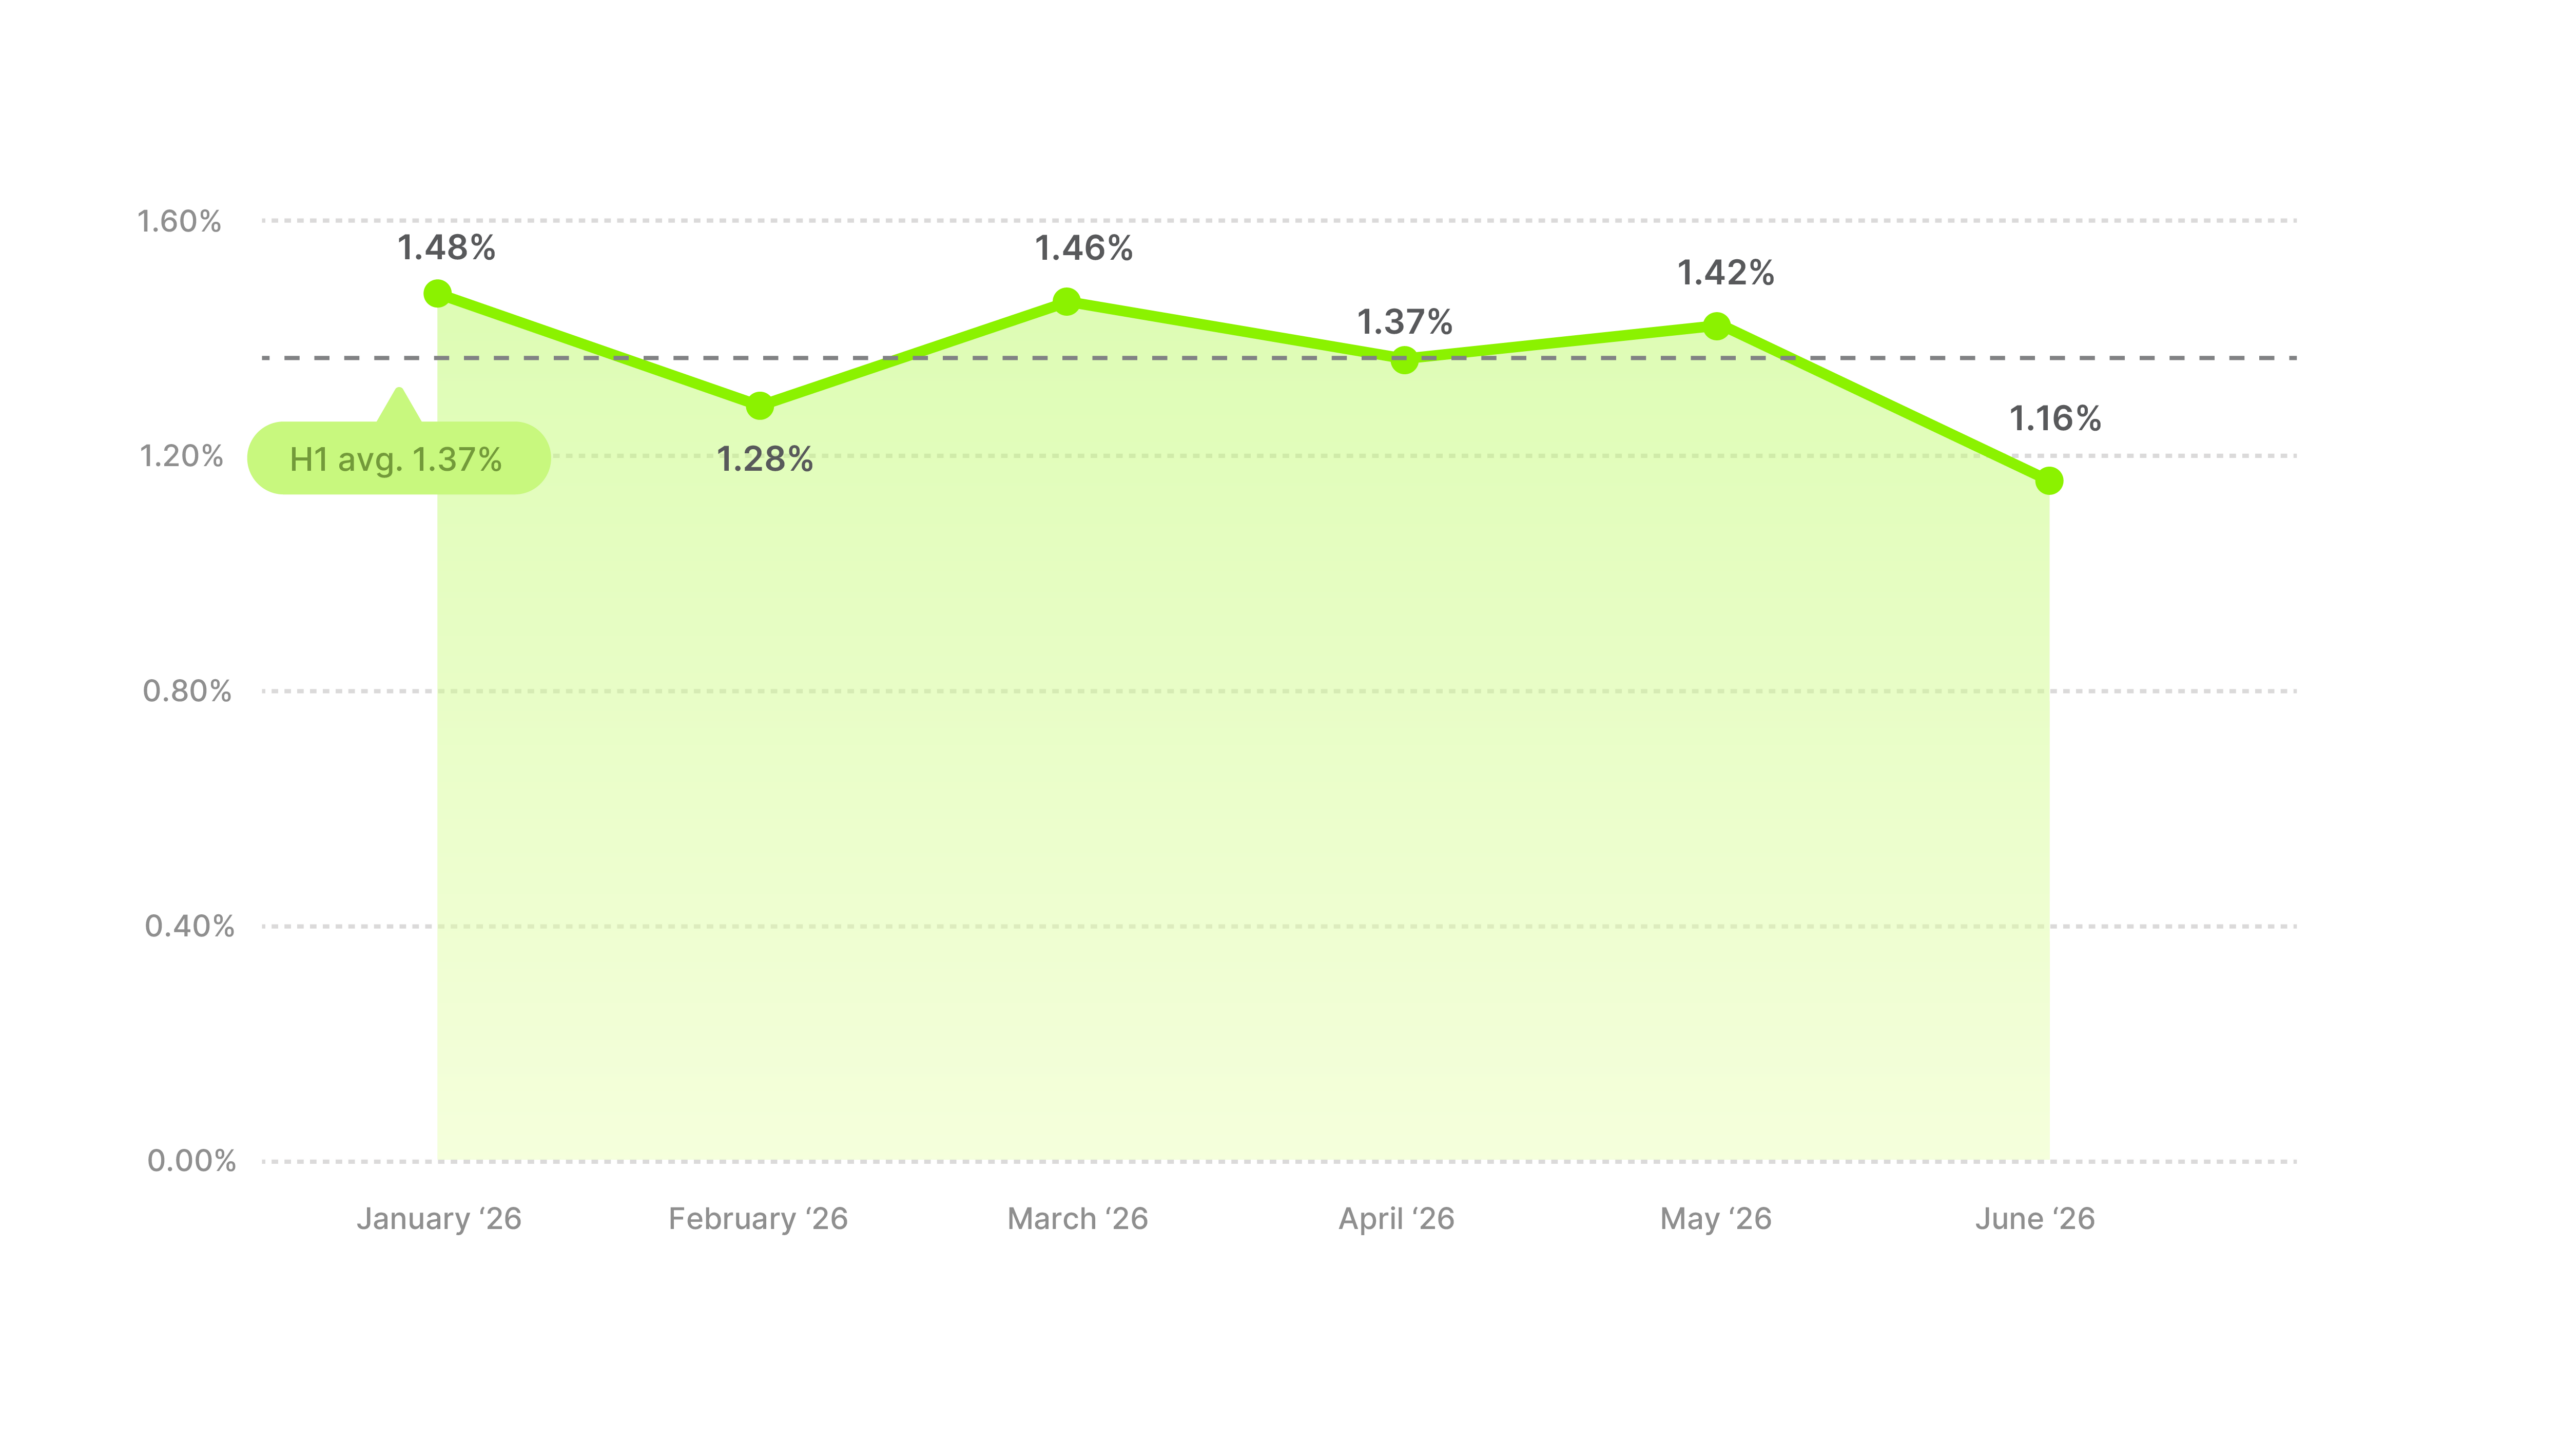
There’s no season in here to plan around. Diapers and car seats get replaced when the child needs them, so no gifting moment or sale window pulls the click forward. Waiting for one means waiting for something that never arrives.
The low number isn’t a verdict on the creative. A parent choosing what goes near their child takes longer to decide, and most of that deciding happens somewhere other than the ad. The click sits earlier in a longer process here than almost anywhere else in this report.
The half-average rose from 1.26% to 1.37%. Benchmark against 1.37% and against your own history, since measuring Baby & Toddler against the 1.93% cross-industry average will always look bad and it isn’t measuring anything you control.
Improving the number requires giving a cautious buyer the proof before the click rather than after it. Put the certification, the materials and the specific reassurance this category asks for on screen, inside the ad, where the research would otherwise have to start.
Business & Industrial moved more than any category in the report. January came in at 1.04%, the weakest month any category recorded all half. May reached 2.57%, better than every other single month except Health & Beauty’s February. That’s 1.53 pp between the best month and the worst, and only March and May finished above the category’s own 1.52% average.
Industry CTR average
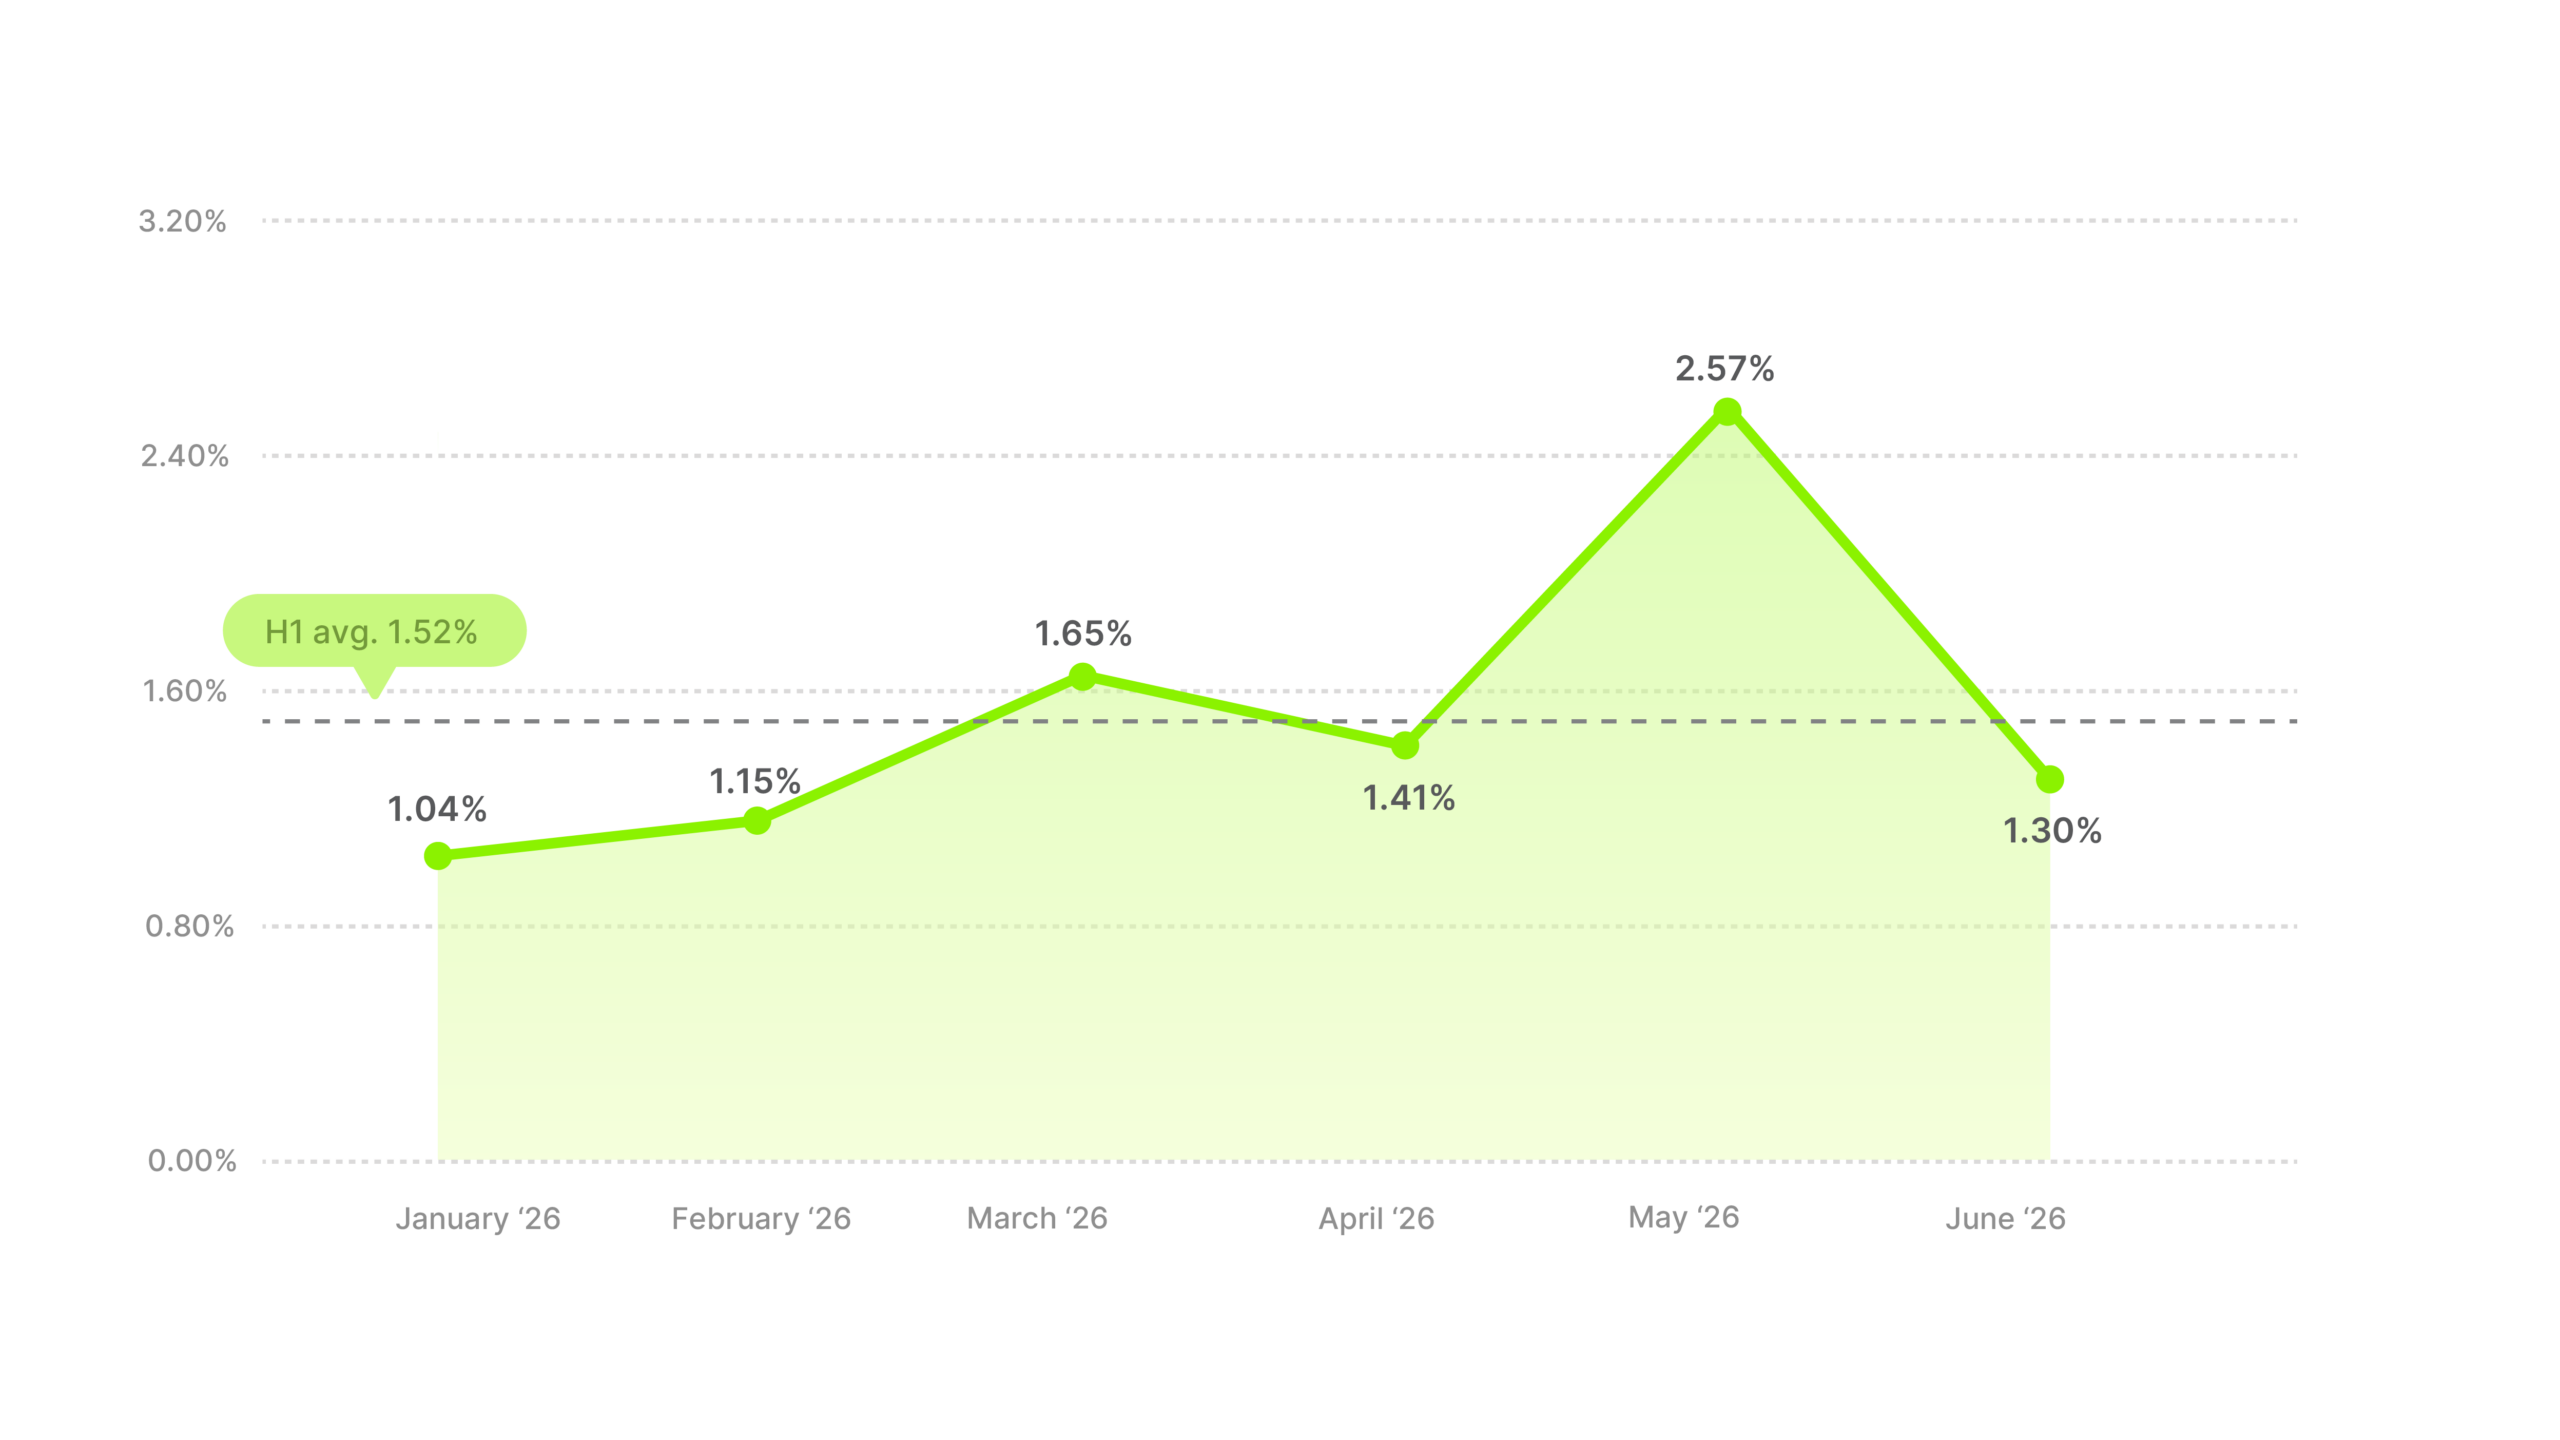
There’s no consumer calendar behind any of that. Business & Industrial sells to companies, and a company buys when a budget gets approved or a purchase order goes through, which can happen in any month. So most months are quiet, and then one isn’t.
Business & Industrial is also one of only two categories that got better at holding attention and worse at earning the click. Its hook rate rose to 28.74%, second-highest of the fourteen, while its CTR slipped from 1.54% to 1.52%. More people watched, and fewer of them clicked. The opening is working, so the drop is happening somewhere in the middle of the ad or at the call to action.
You can’t plan a Business & Industrial budget around a season, because there isn’t one. Picking a month means guessing when your buyers’ budgets open. Running steadily across the half is cheaper than guessing, and it’s the only way to be there when one of them does.
Electronics averaged 1.68%, up from 1.53% last half and still below the cross-industry average. Its monthly readings swung more than any category except Business & Industrial, from 2.28% in May down to 1.13% in June.
Industry CTR average
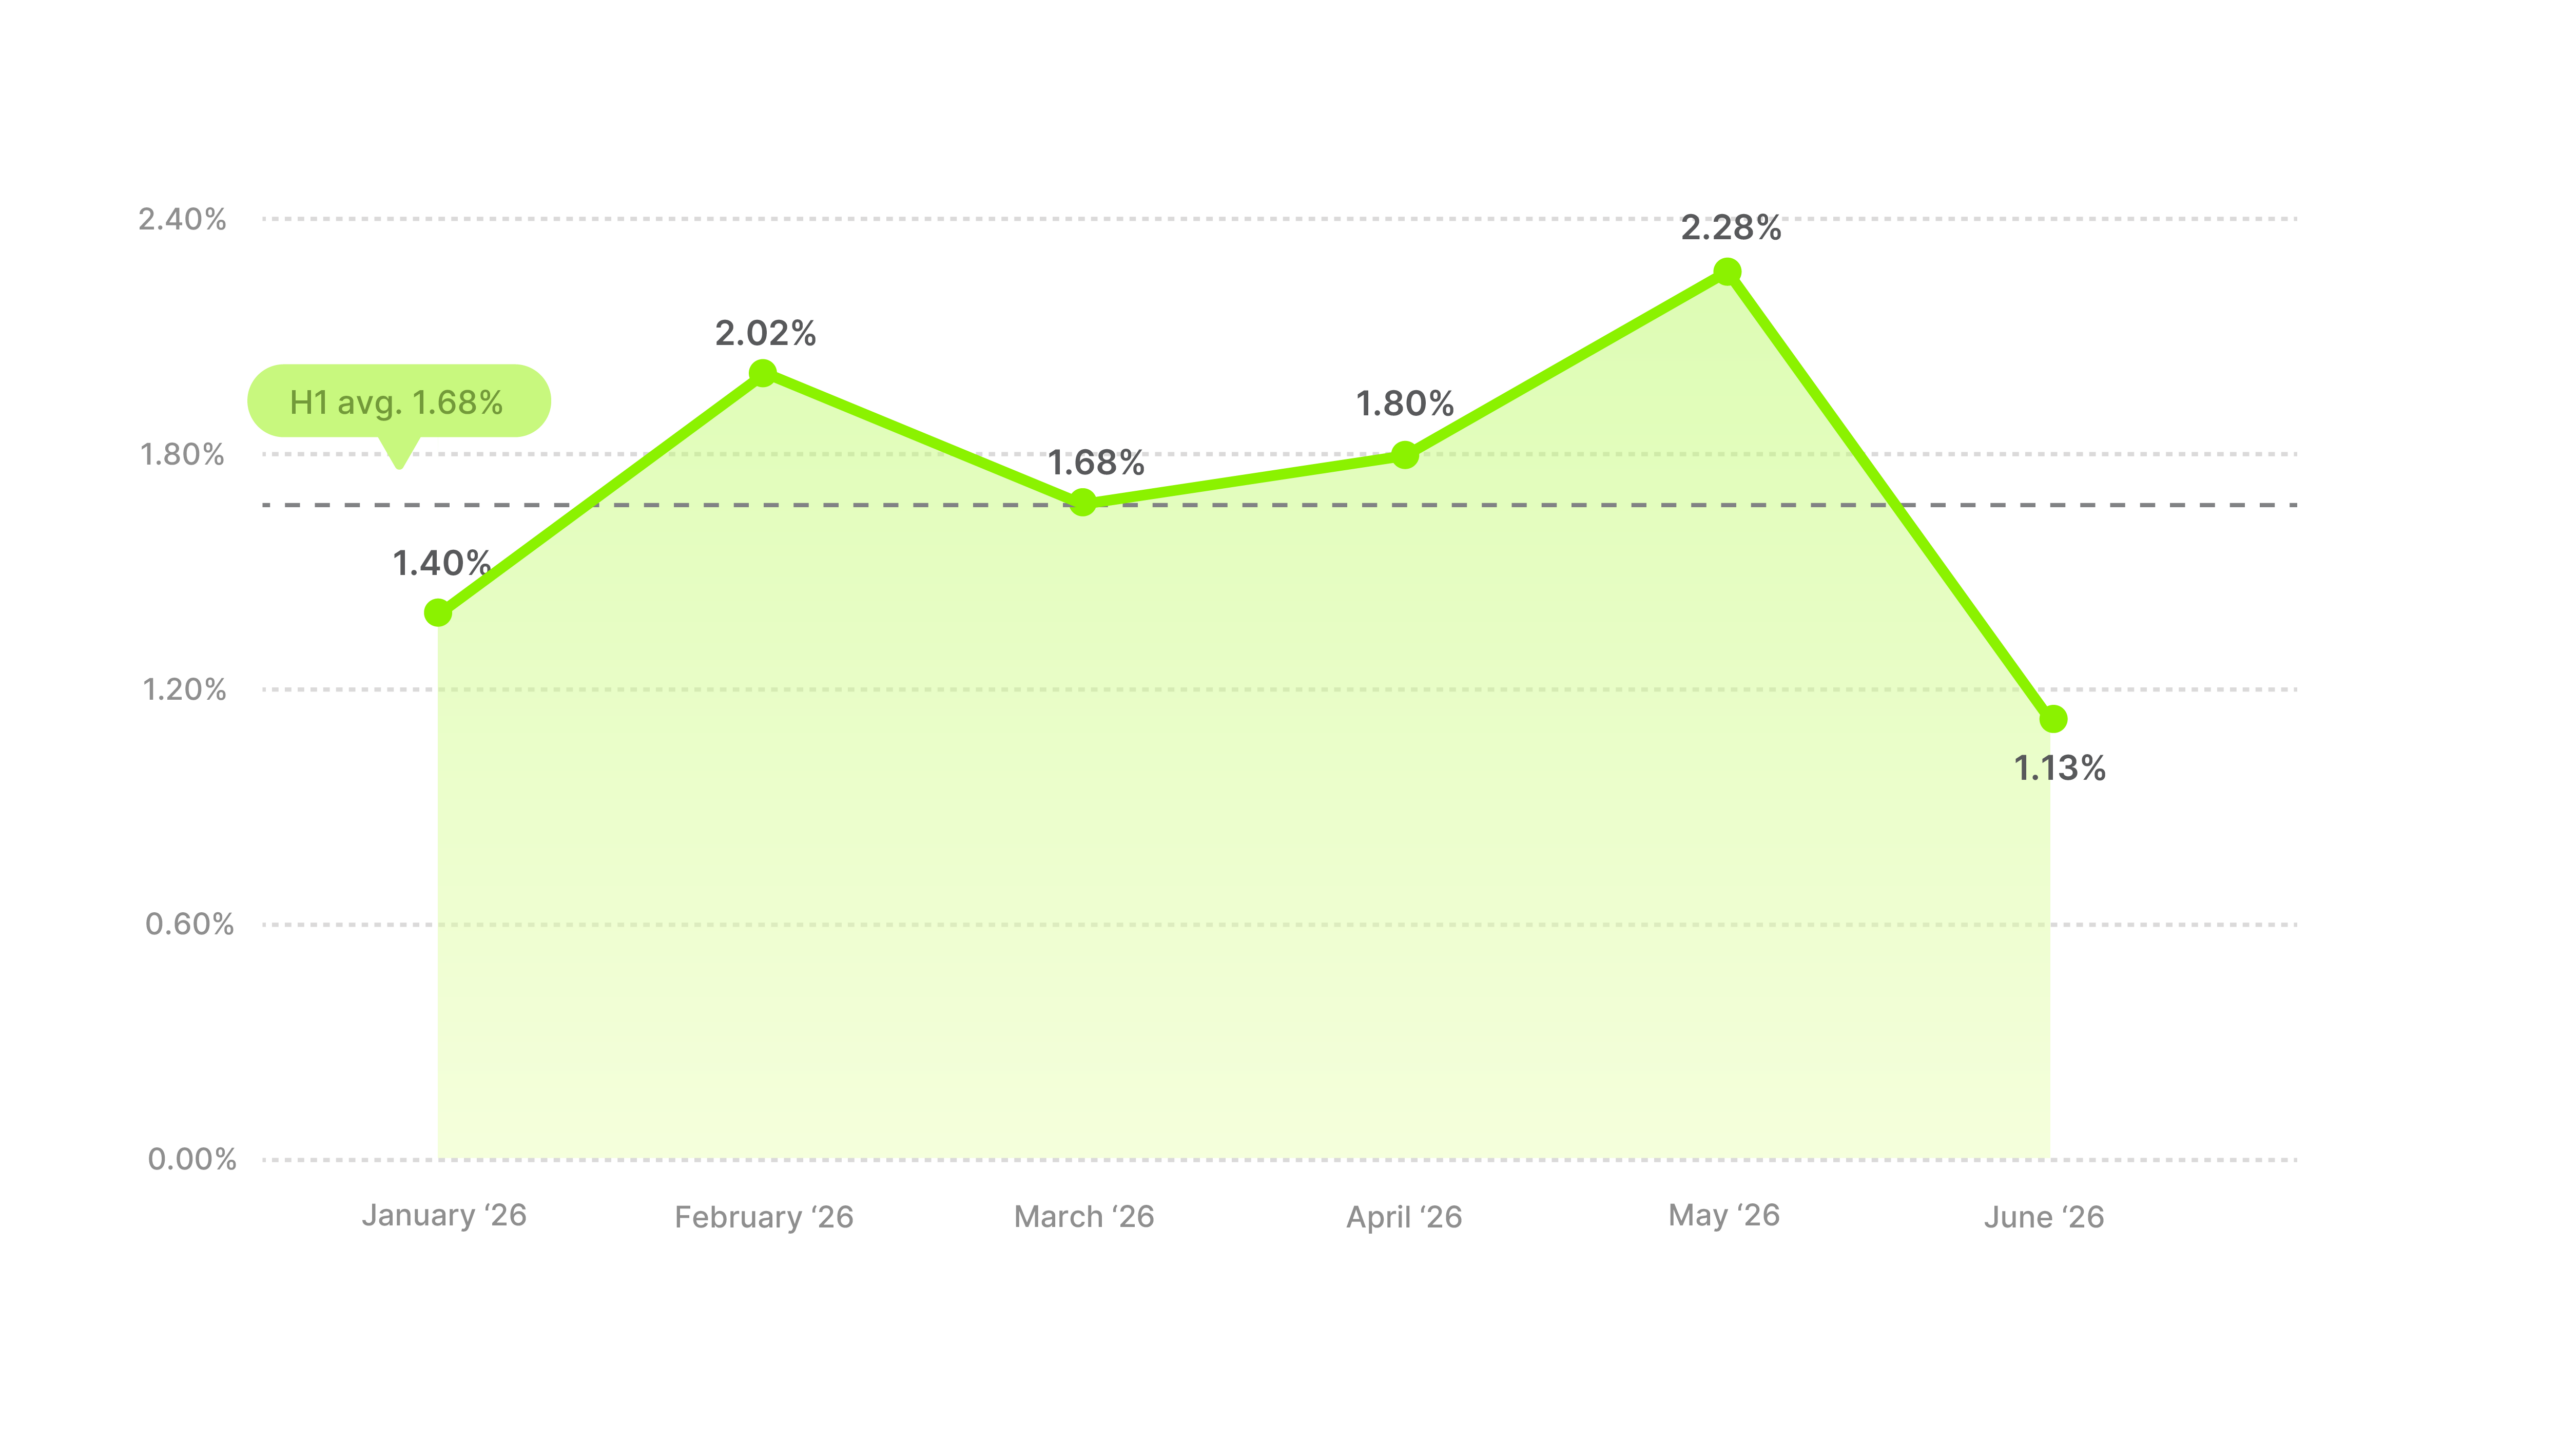
Don’t read much into any single month here. Use 1.68% as the benchmark, because the strong months look like one-off launches and promotions rather than anything seasonal.
People shop for electronics slowly. They research, they compare, and they wait for a reason to buy now. The first half of the year doesn’t give them many. There’s no Black Friday and no December gifting between January and June, so the only deal windows are the ones brands create themselves.
To get above 1.68%, give them that reason inside the ad. The price, the spec that beats the alternative, a straight comparison with whatever else they’re considering. A brand-feel ad won’t move someone who’s still comparing options.
Food & Beverages gained 0.33 pp this half, from 1.51% to 1.84%, one of the four biggest improvements in the report. January started slow at 1.55%, the lowest month of the half. From there it climbed to 2.11% in March, held 1.97% through April and May, and eased to 1.74% in June.
Industry CTR average
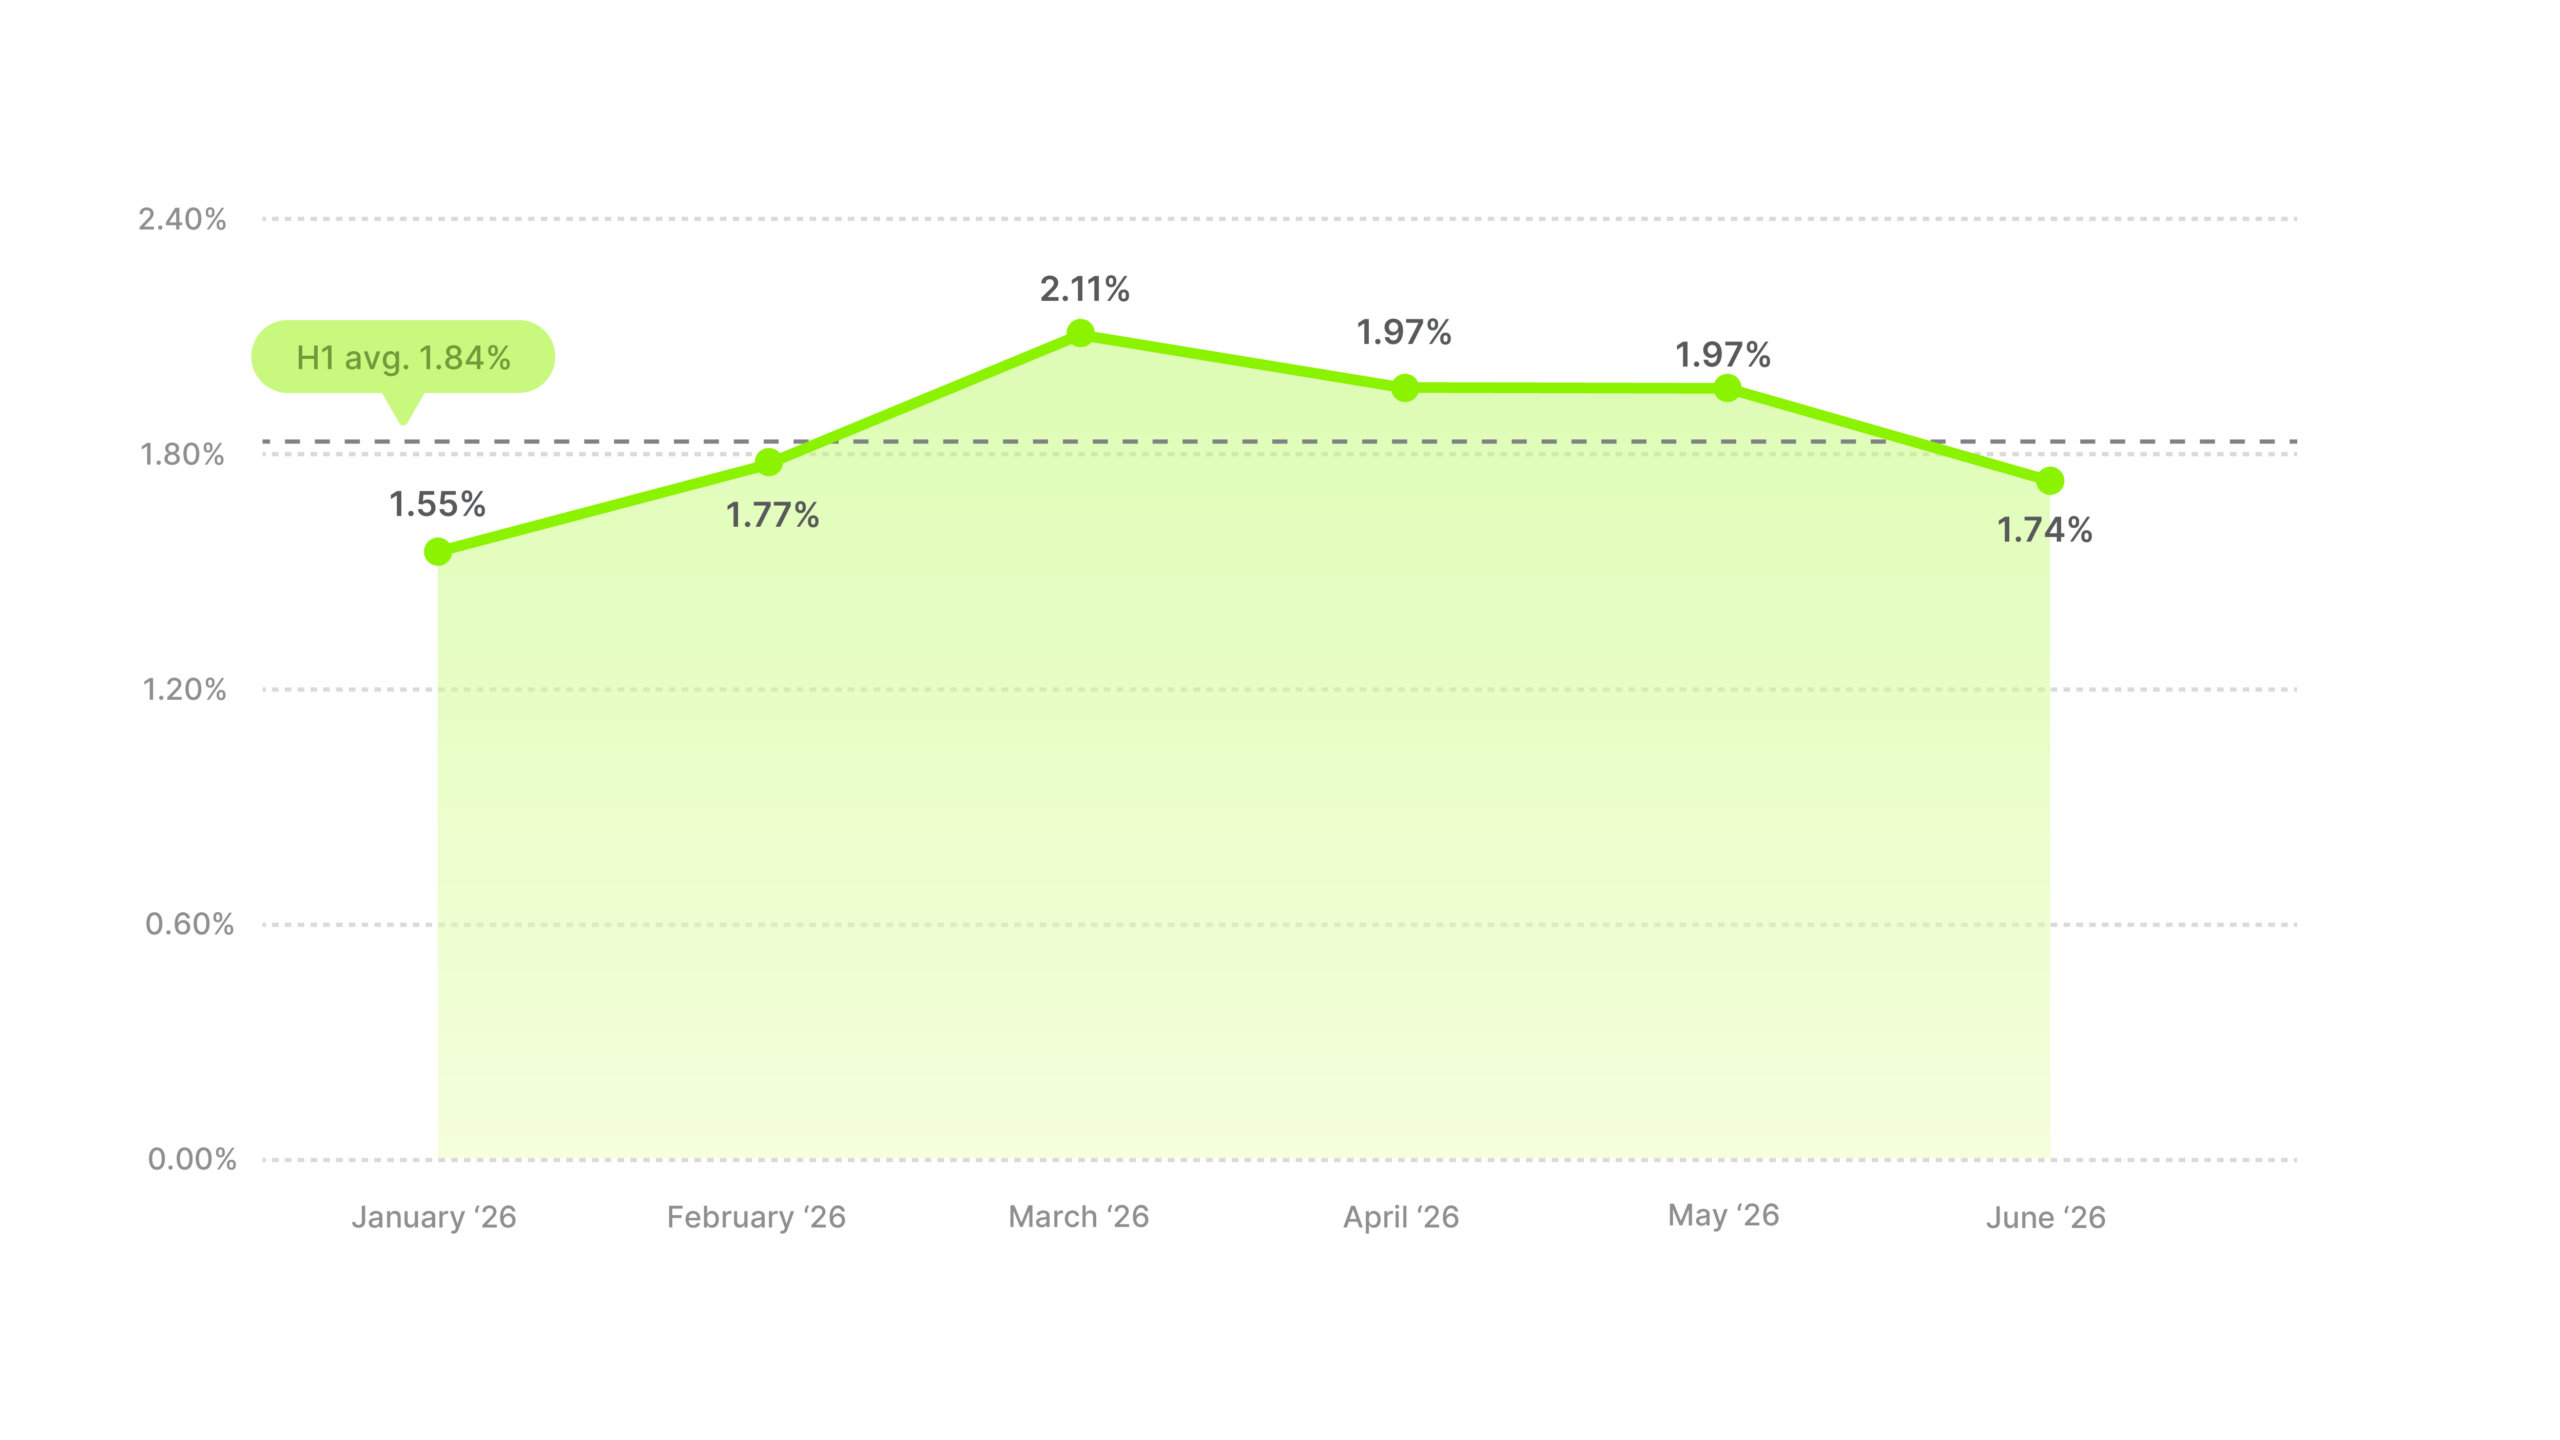
March, April and May are the months to plan around. All three ran at or above the category’s own 1.84% average, while January was well below it. That slow start probably reflects how new-year health resolutions actually play out, with people deciding in January and buying a month or two later.
Food and drink have a natural advantage on video. It looks good on camera, and trying something new is cheap, which is why this category does well on clicks without needing a moment in the calendar.
Beating 1.84% starts with the food itself. Show the pour, the bite, the steam coming off it, then give people a sampler or an introductory offer.
Health & Beauty had the highest CTR in the report at 2.36%. February reached 2.67%, the strongest month any category recorded this half.
What happened after February matters more than the half-average. Health & Beauty peaked there and then fell almost every month, down to 1.74% by June. Its lead over the rest of the market went with it, from 0.64 pp ahead in February to 0.09 pp ahead in June.
Against last half’s 1.90% that’s still a 0.46 pp gain, the second-largest in the report.
Industry CTR average
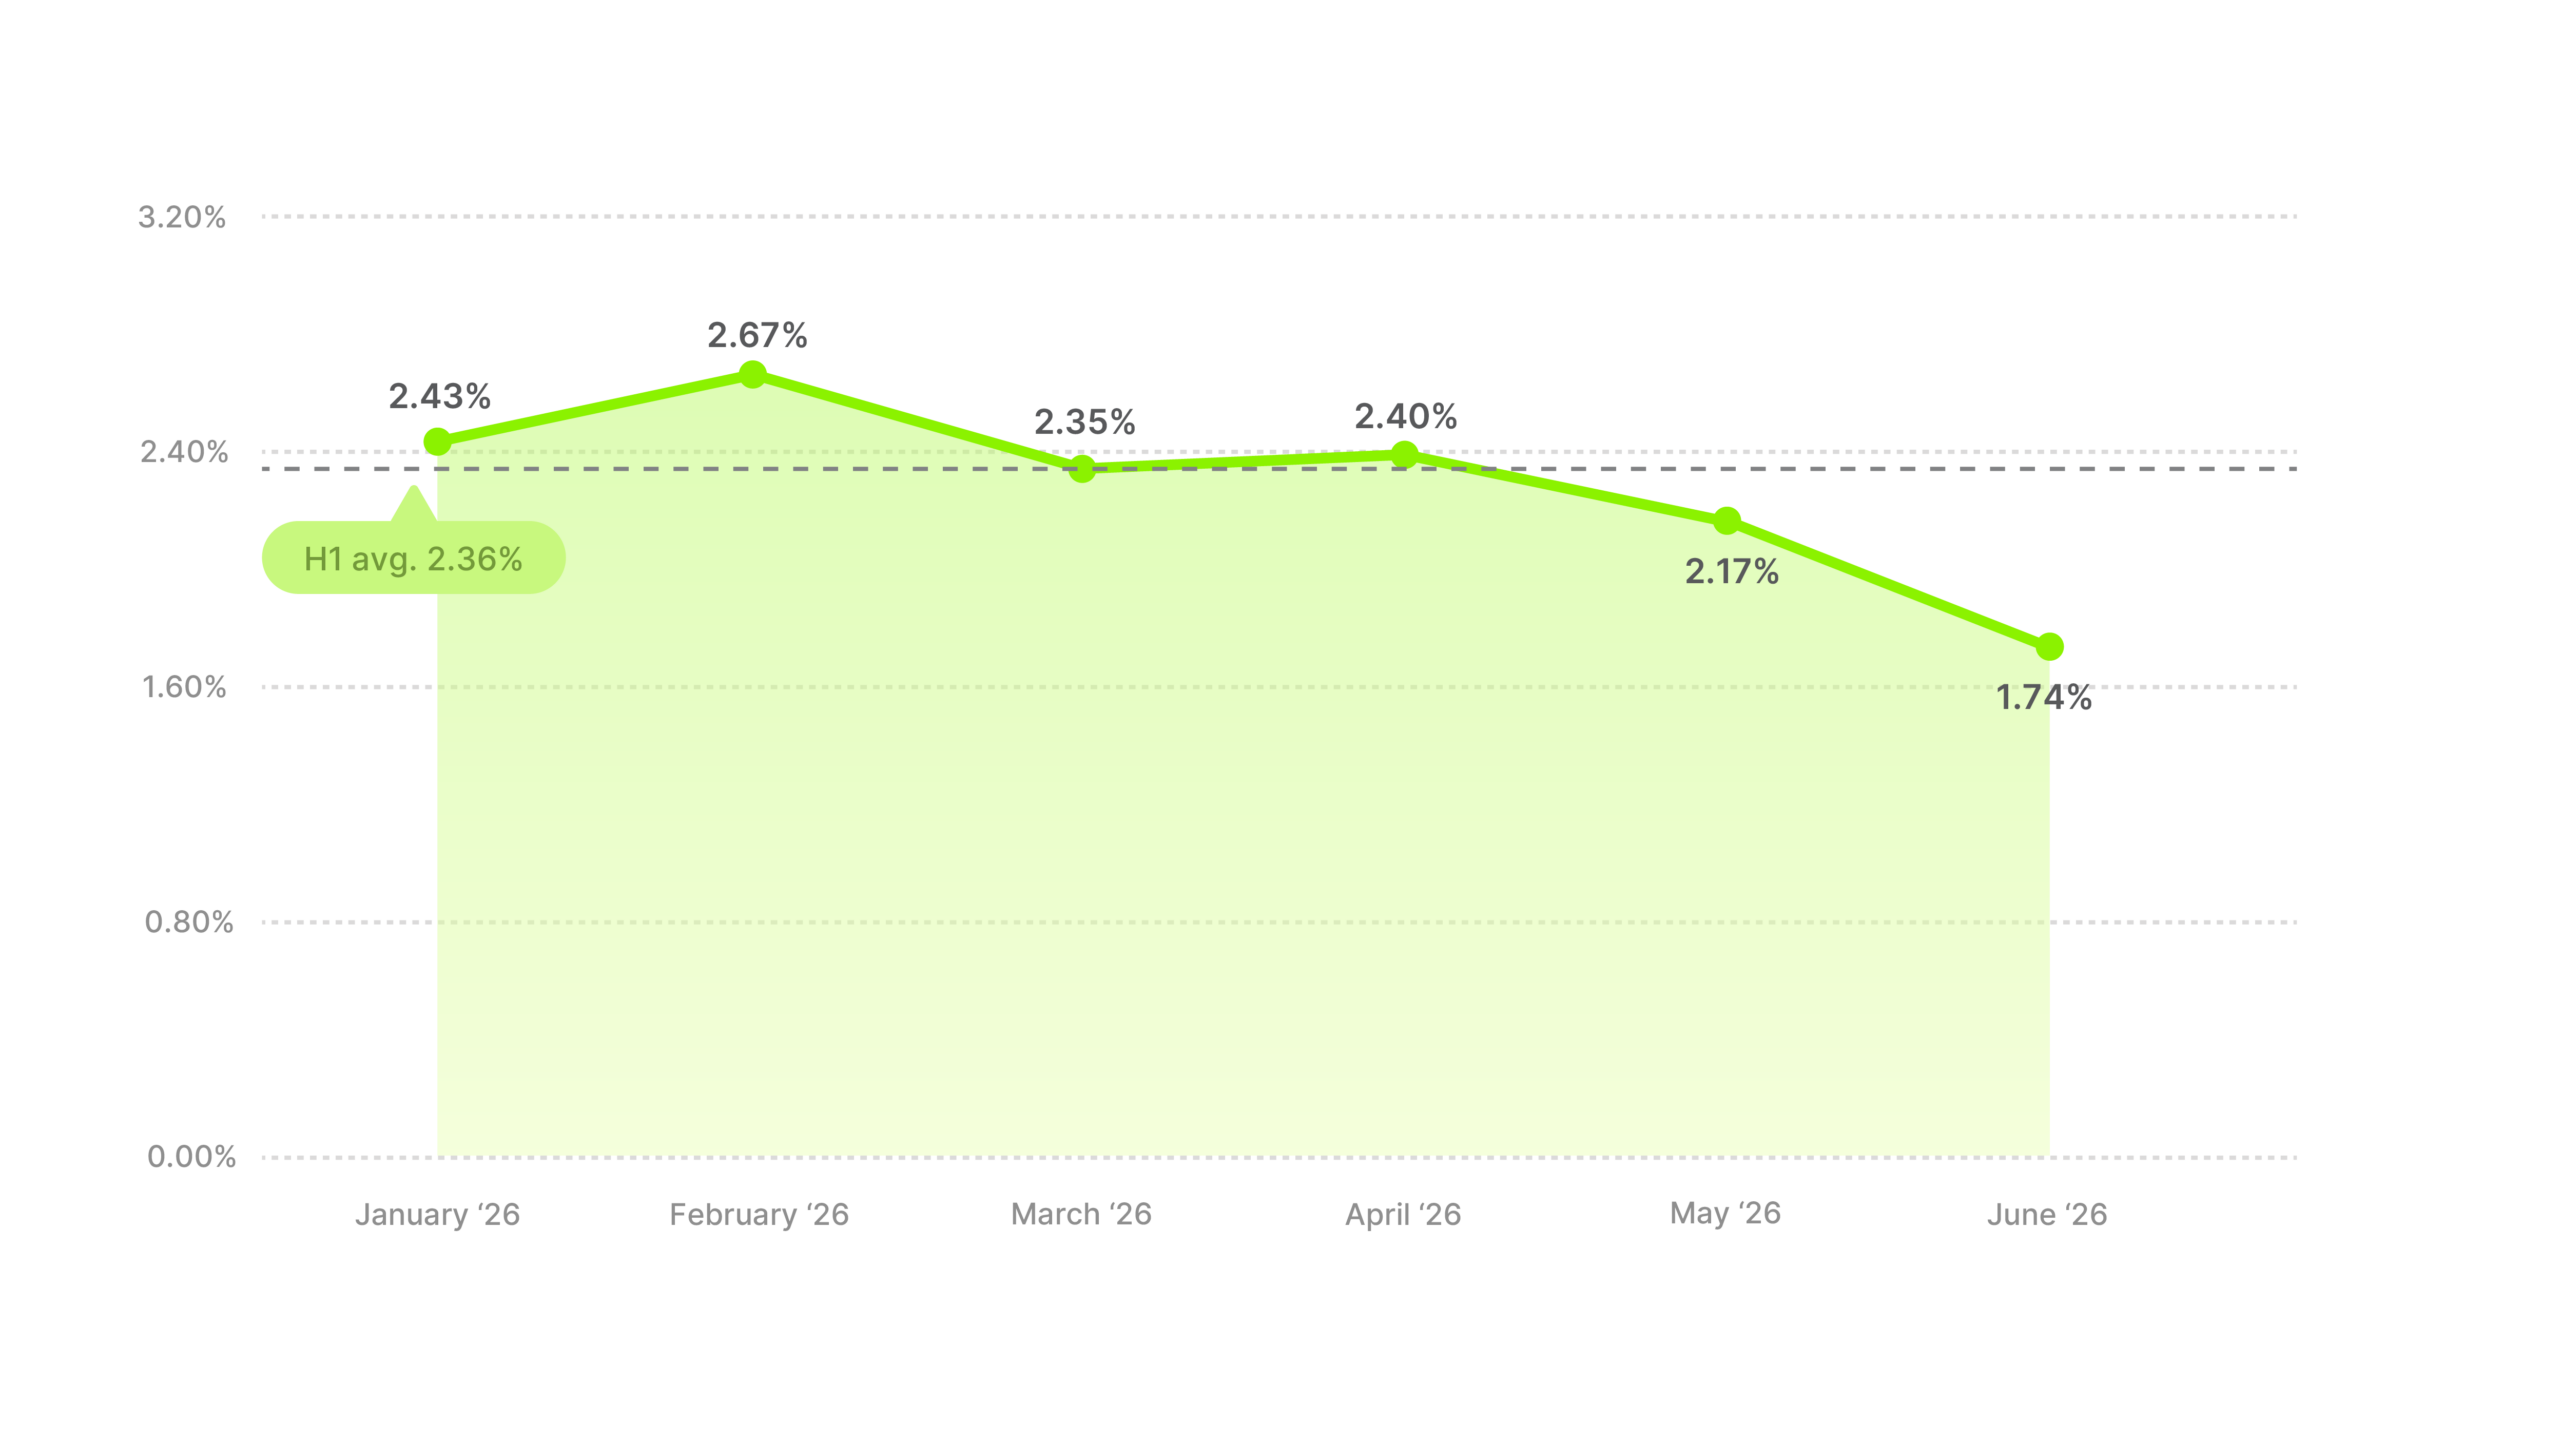
Benchmark against 2.36%. The 1.93% figure includes thirteen categories a Health & Beauty brand never competes with, so measuring against it sets the bar too low.
Don’t change much. Lead with the application, the texture, the visible change on someone’s skin, because people click here when they can see the product working. The one thing worth watching is whether June was seasonal or the start of something.
Home & Garden finished third on clicks at 2.09%, and only sixth on hook rate. Getting attention and getting a click are different problems, and Home & Garden is much better at the second one.
Industry CTR average
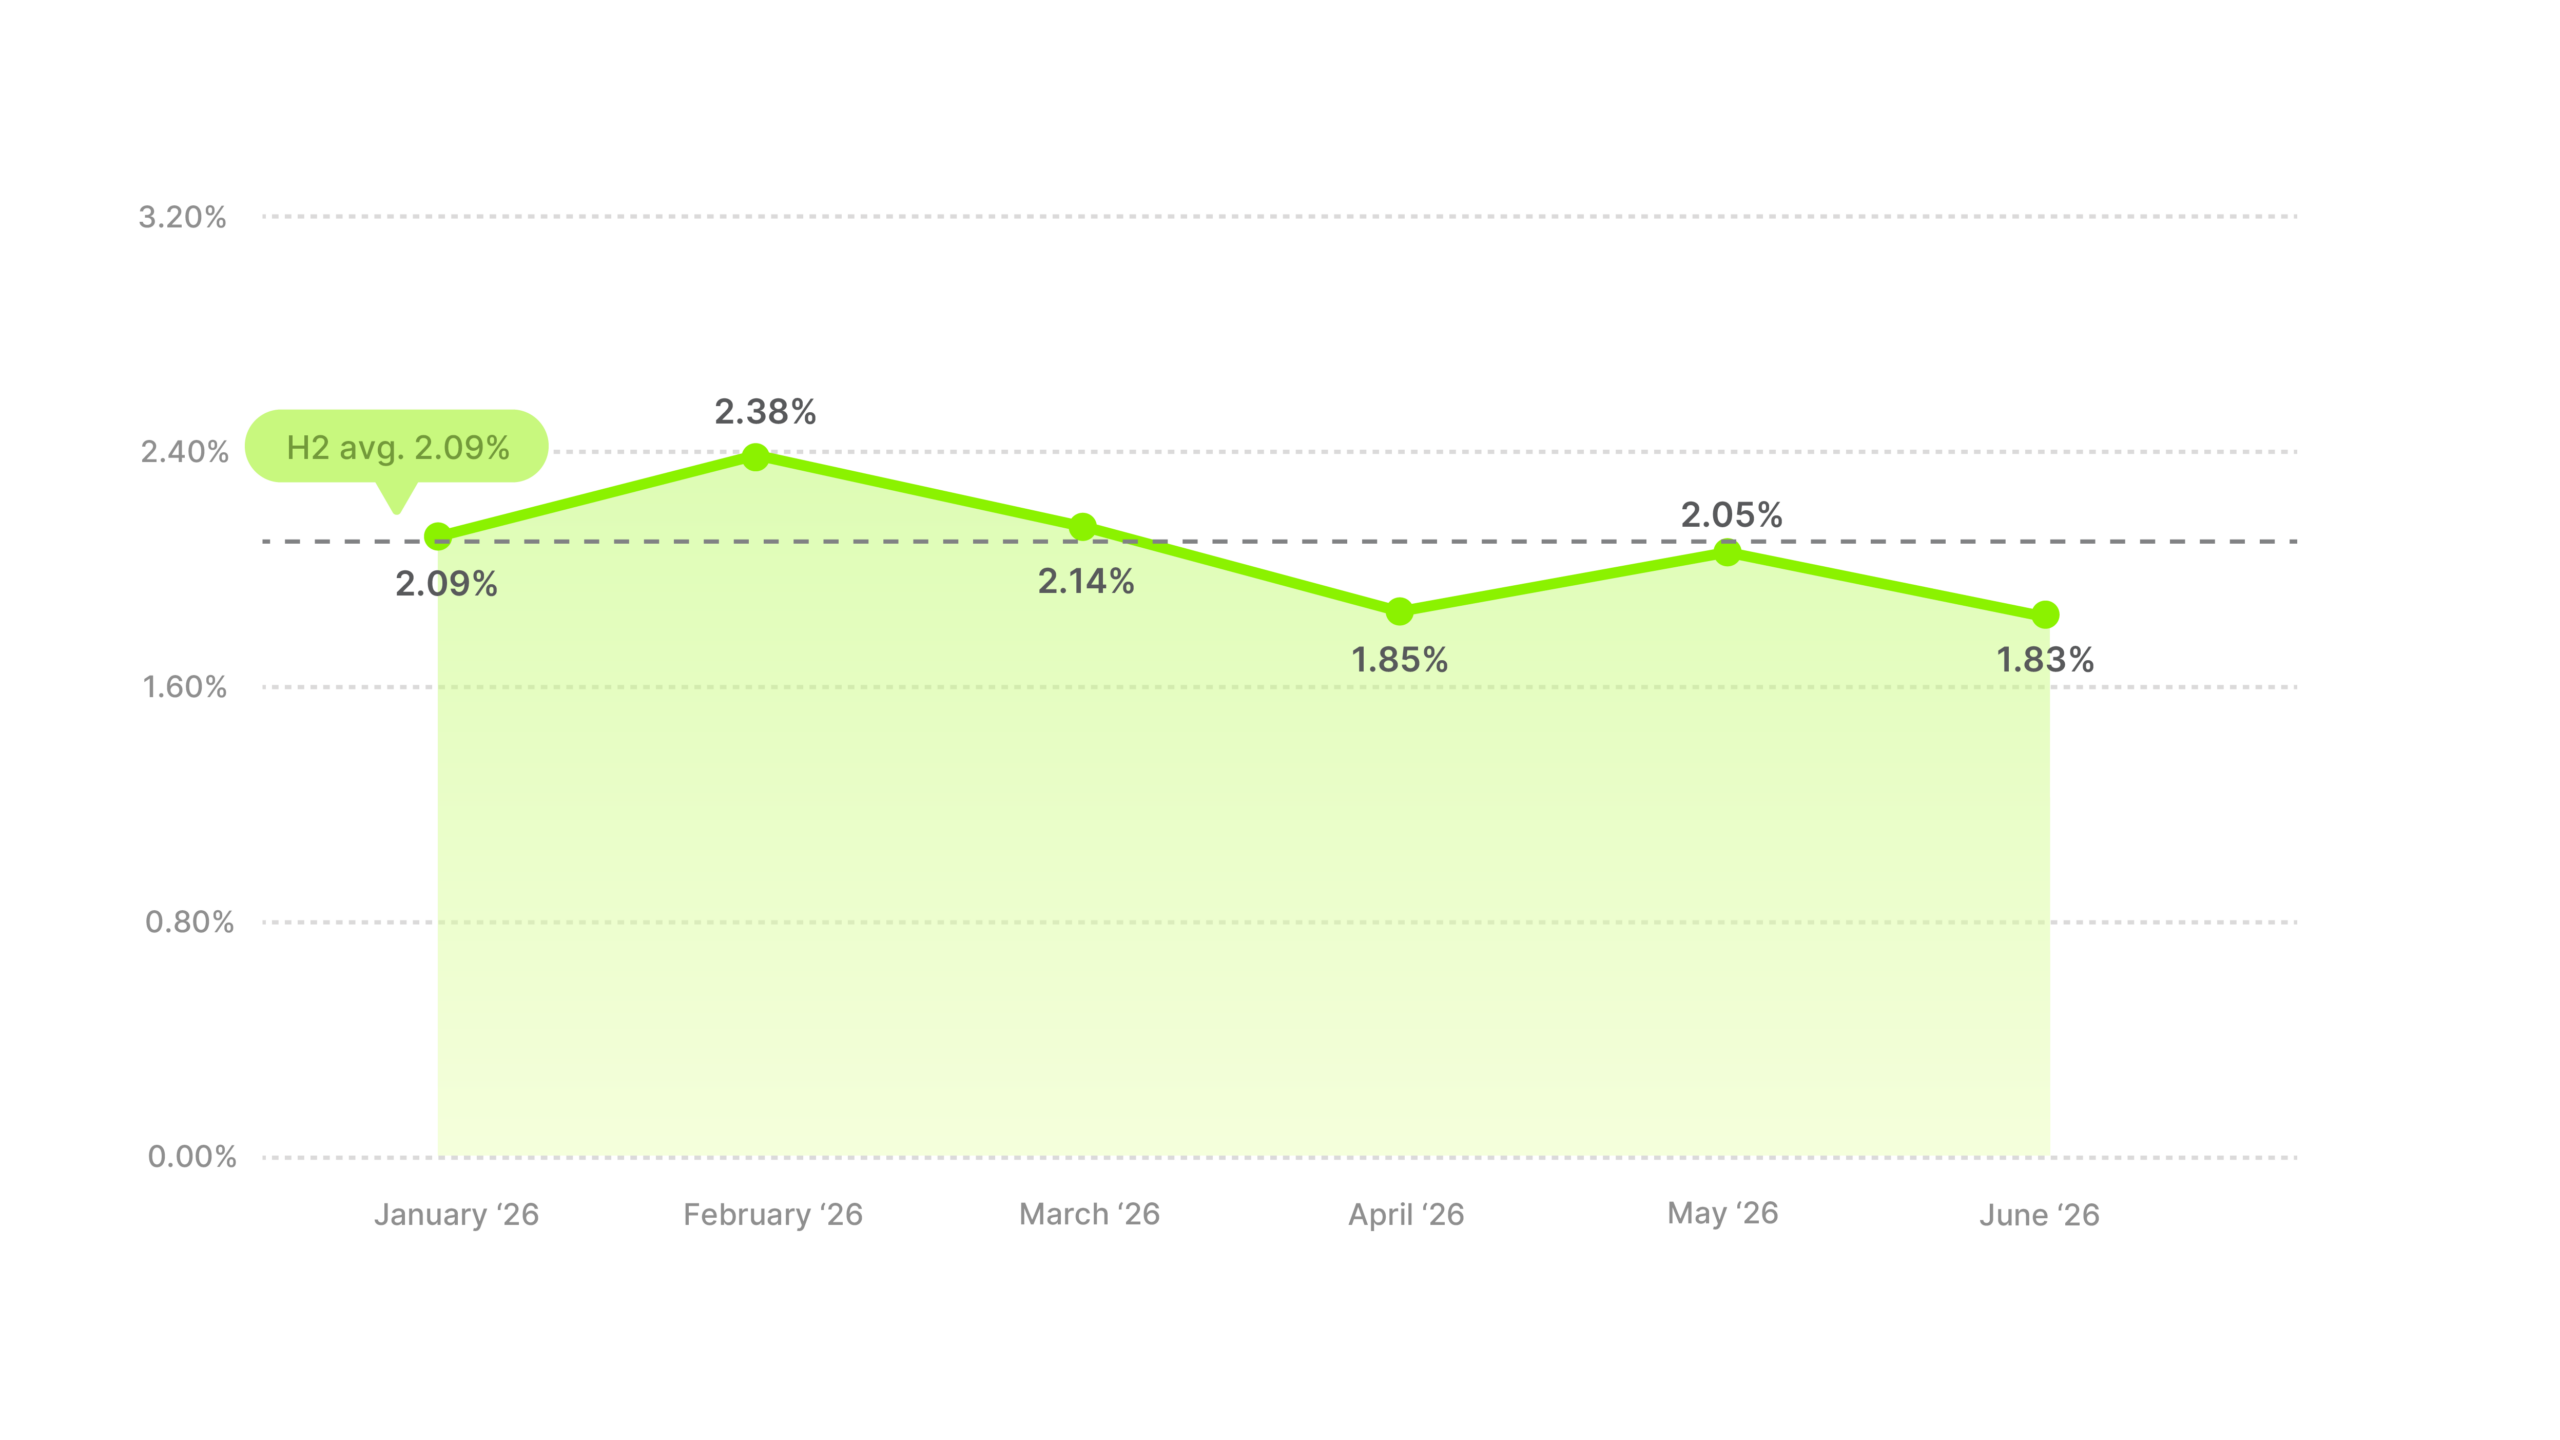
February was the peak at 2.38%, and January through March all ran at or above the category’s own 2.09% average. April dipped to 1.85%, May recovered to 2.05%, and June finished at 1.83%. The early months were the strong ones, which plausibly reflects a new-year refresh.
Home & Garden rose from 1.90% to 2.09% half over half and stayed in the top three both halves. The peak month moved from October to February, so you can count on the level in this category but not on the month.
Since the click here comes from the product itself, put the creative budget into the payoff. Show the finished room, the corner that used to be a mess, the thing that finally fits. Home & Garden is the one category in this report where a clever hook isn’t worth paying for.
Services gained 0.33 pp this half, 1.47% to 1.80%, which moved it from the bottom of the table into the upper middle. Its hook rate rose nearly four points over the same six months, the biggest attention gain in the report with Sporting Goods 0.01 pp behind. So Services got better at both jobs at once.
Industry CTR average
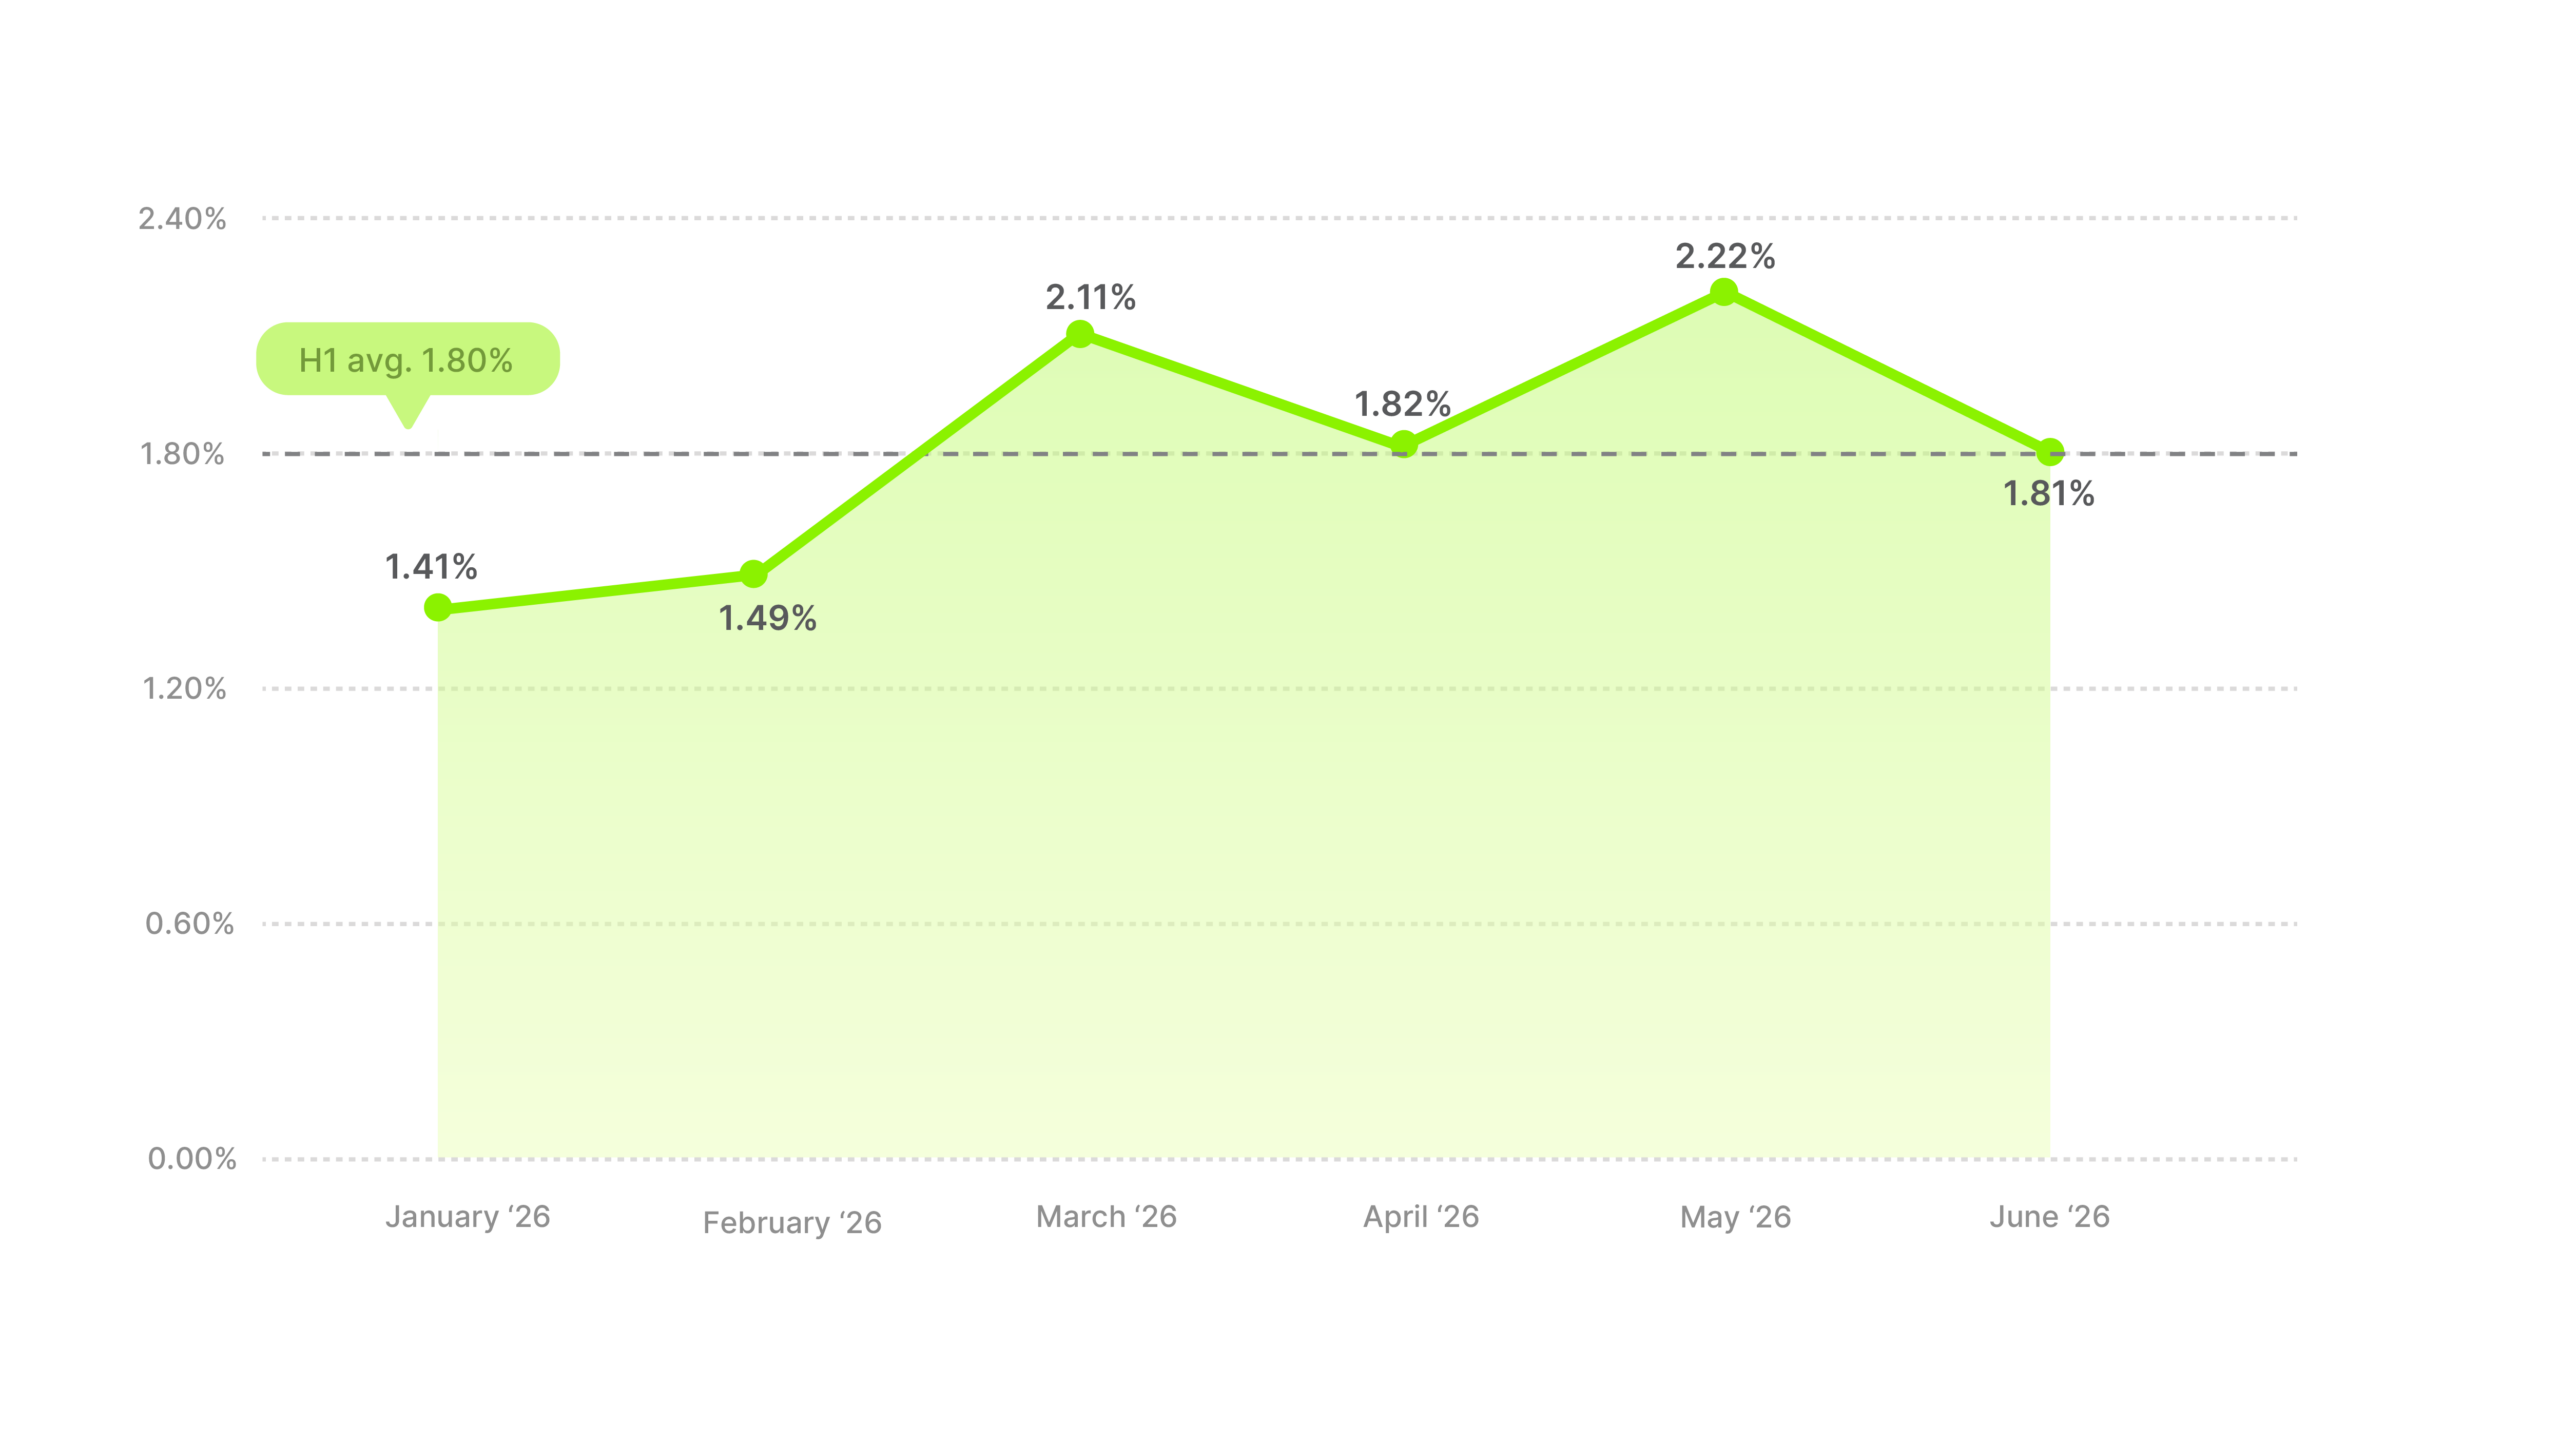
The monthly line is lumpy. January and February were around 1.4%, March jumped to 2.11%, April fell back to 1.82%, May reached 2.22% and June held 1.81%. There’s no rhythm in that to plan around, because services get bought when a need or a budget window shows up, and neither follows a shopping calendar.
Services has always struggled on clicks because there’s nothing to show. A subscription or a contract has no product shot and nothing to demonstrate. Whatever brands changed this half, it worked.
The months will swing around 1.80%, so judge yourself on the half. To beat that number, put a customer on screen who can say what changed for them, and give the change a number. That’s the closest this category gets to a product demo.
Software barely moved between halves, 1.59% then and 1.61% now.
The market is what changed. Last half Software’s 1.59% was above the cross-industry average. This half the market rose 0.37 pp while Software rose 0.02, so the same number is now below average.
Industry CTR average
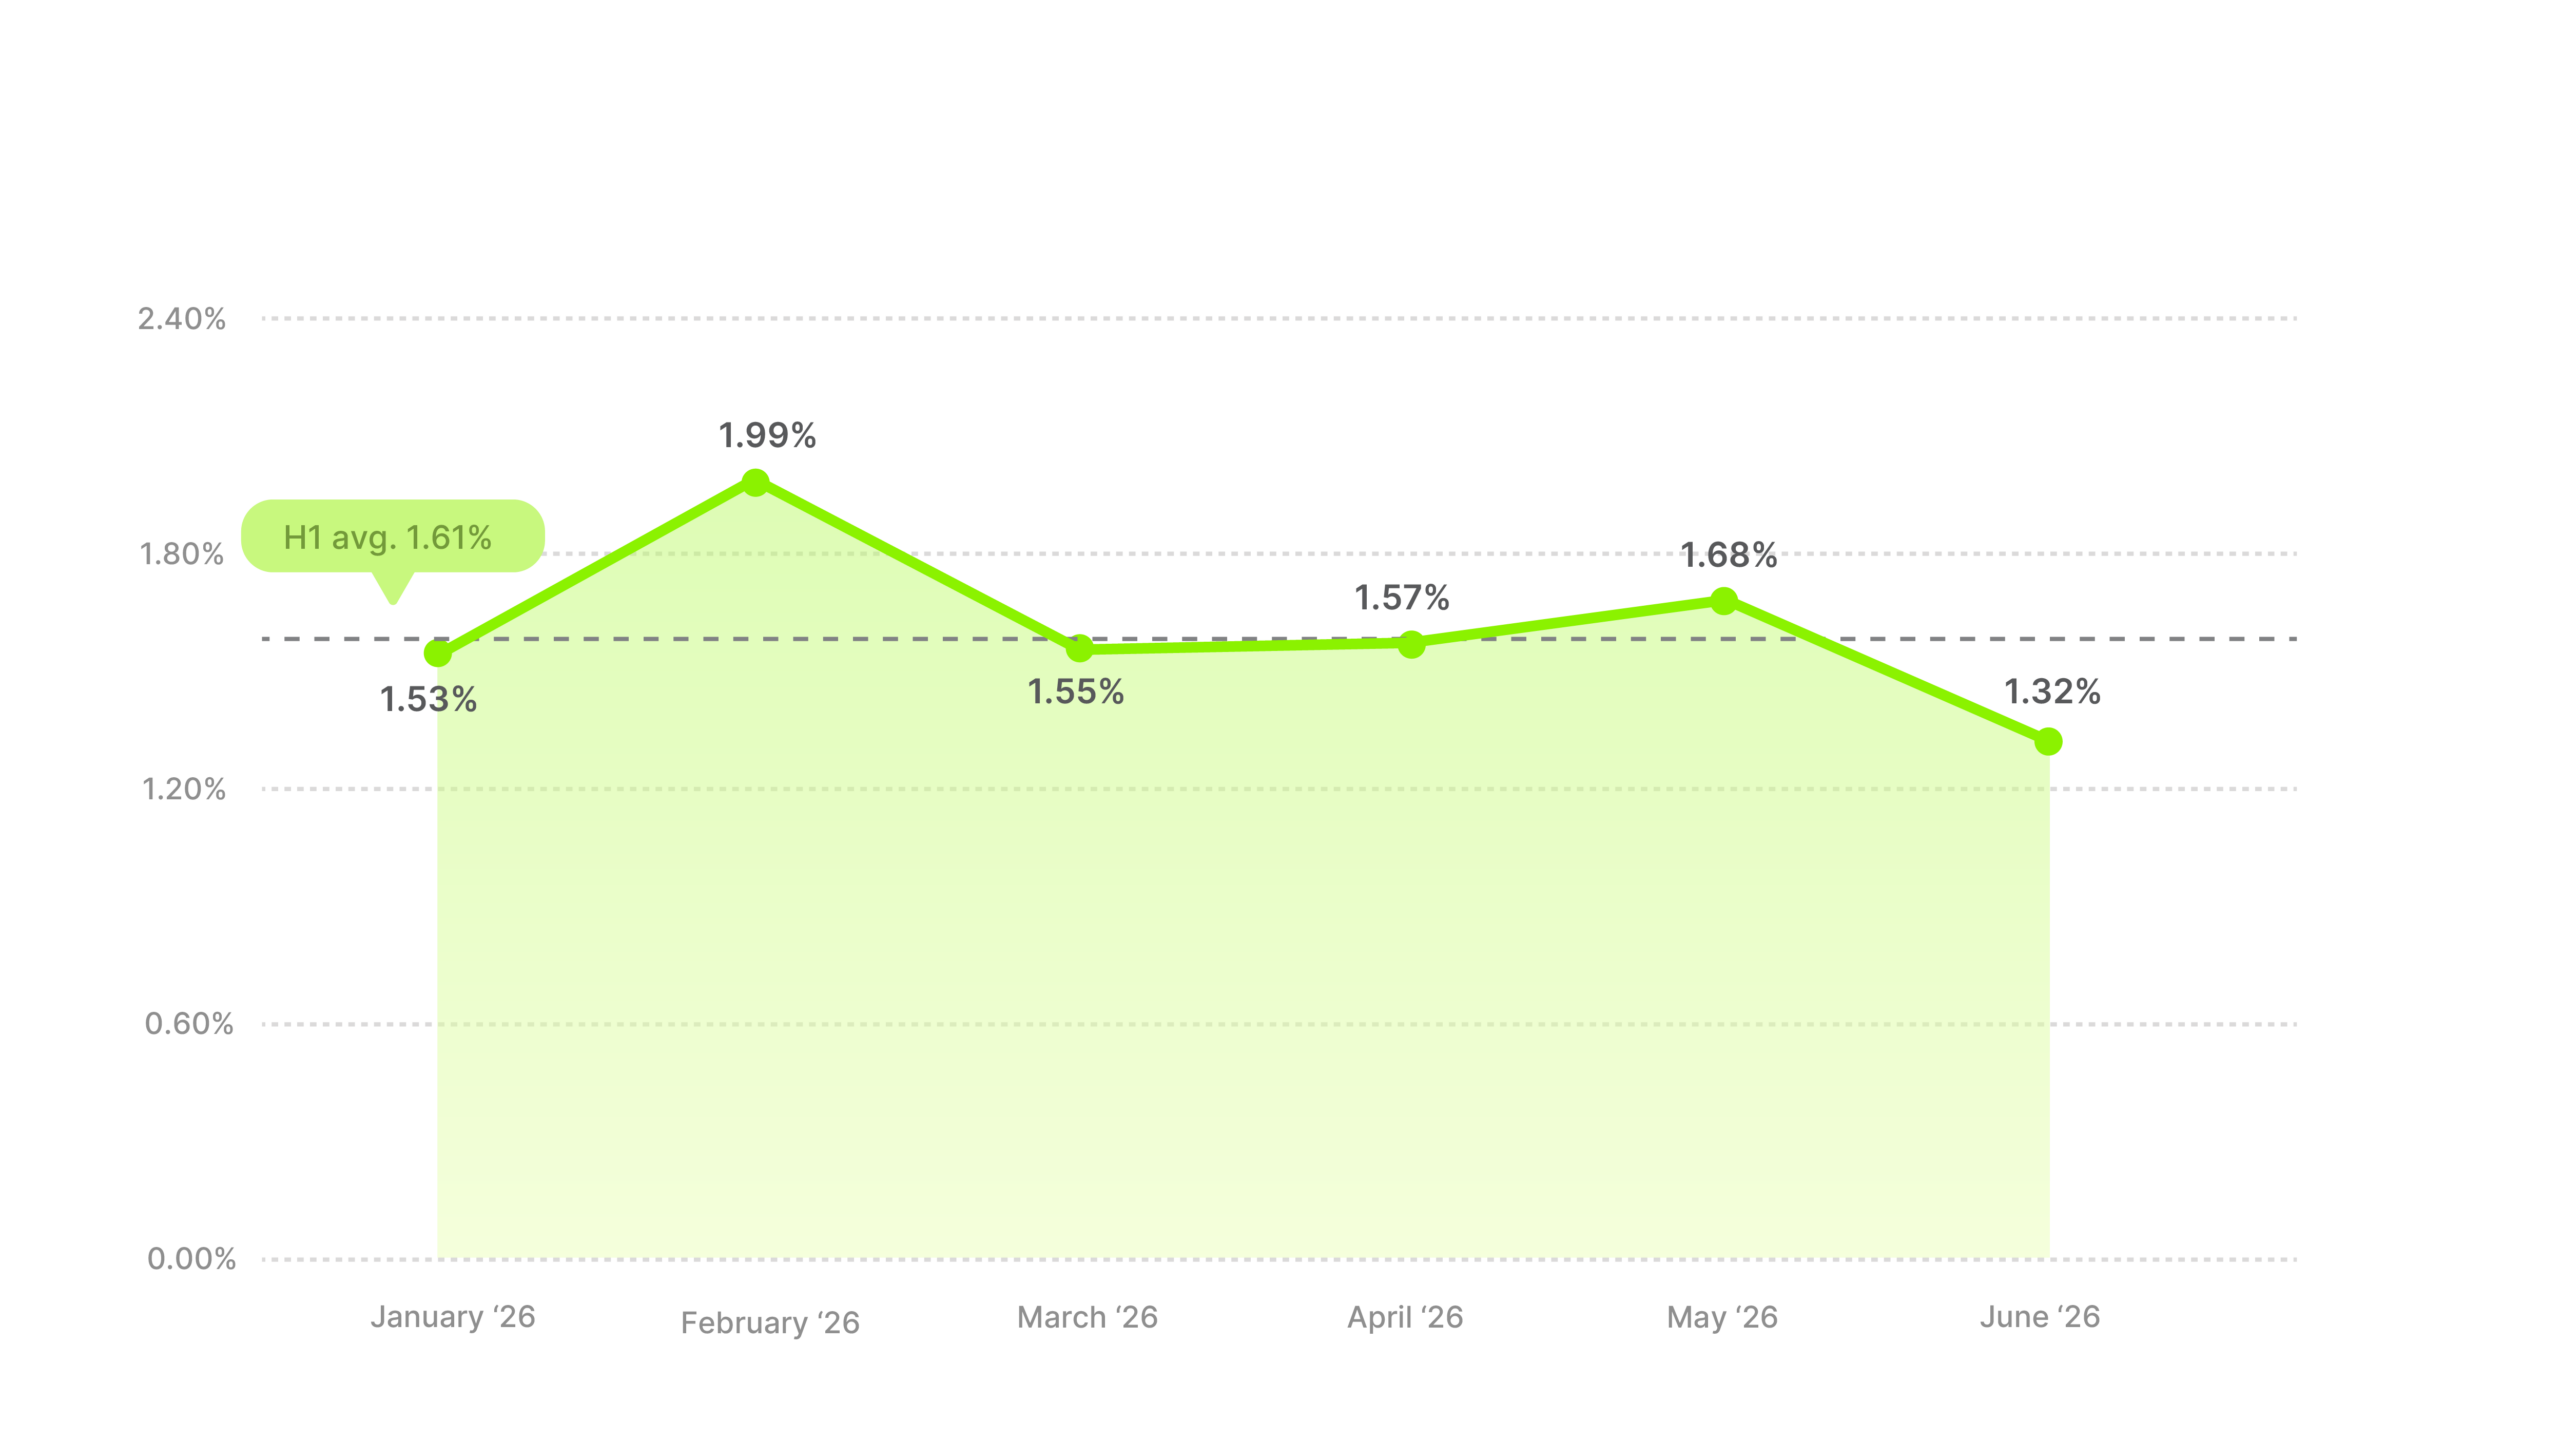
February is the one month that stands out, at 1.99%, plausibly new-year budget allocation. The rest of the half ran between 1.53% and 1.68% before finishing at 1.32% in June. Last half Software’s story was a big December jump. Nothing like it happened this half, which suggests that jump was a one-off budget event.
Nobody subscribes to software on impulse. A buyer needs a concrete reason and usually somebody else’s sign-off, and that’s most of why Software stays below the market even in its better months.
To get above 1.61%, show the product doing the job. A screen recording, the interface mid-task, the manual process it replaces. Then make the next step a free trial, because someone still building a case internally needs something to show their team.
Sporting Goods finished lower than last half, 1.47% down to 1.44%, one of only two categories in the report that did. But that’s a six-month average, and Sporting Goods was much better in May and June than in January.
Industry CTR average
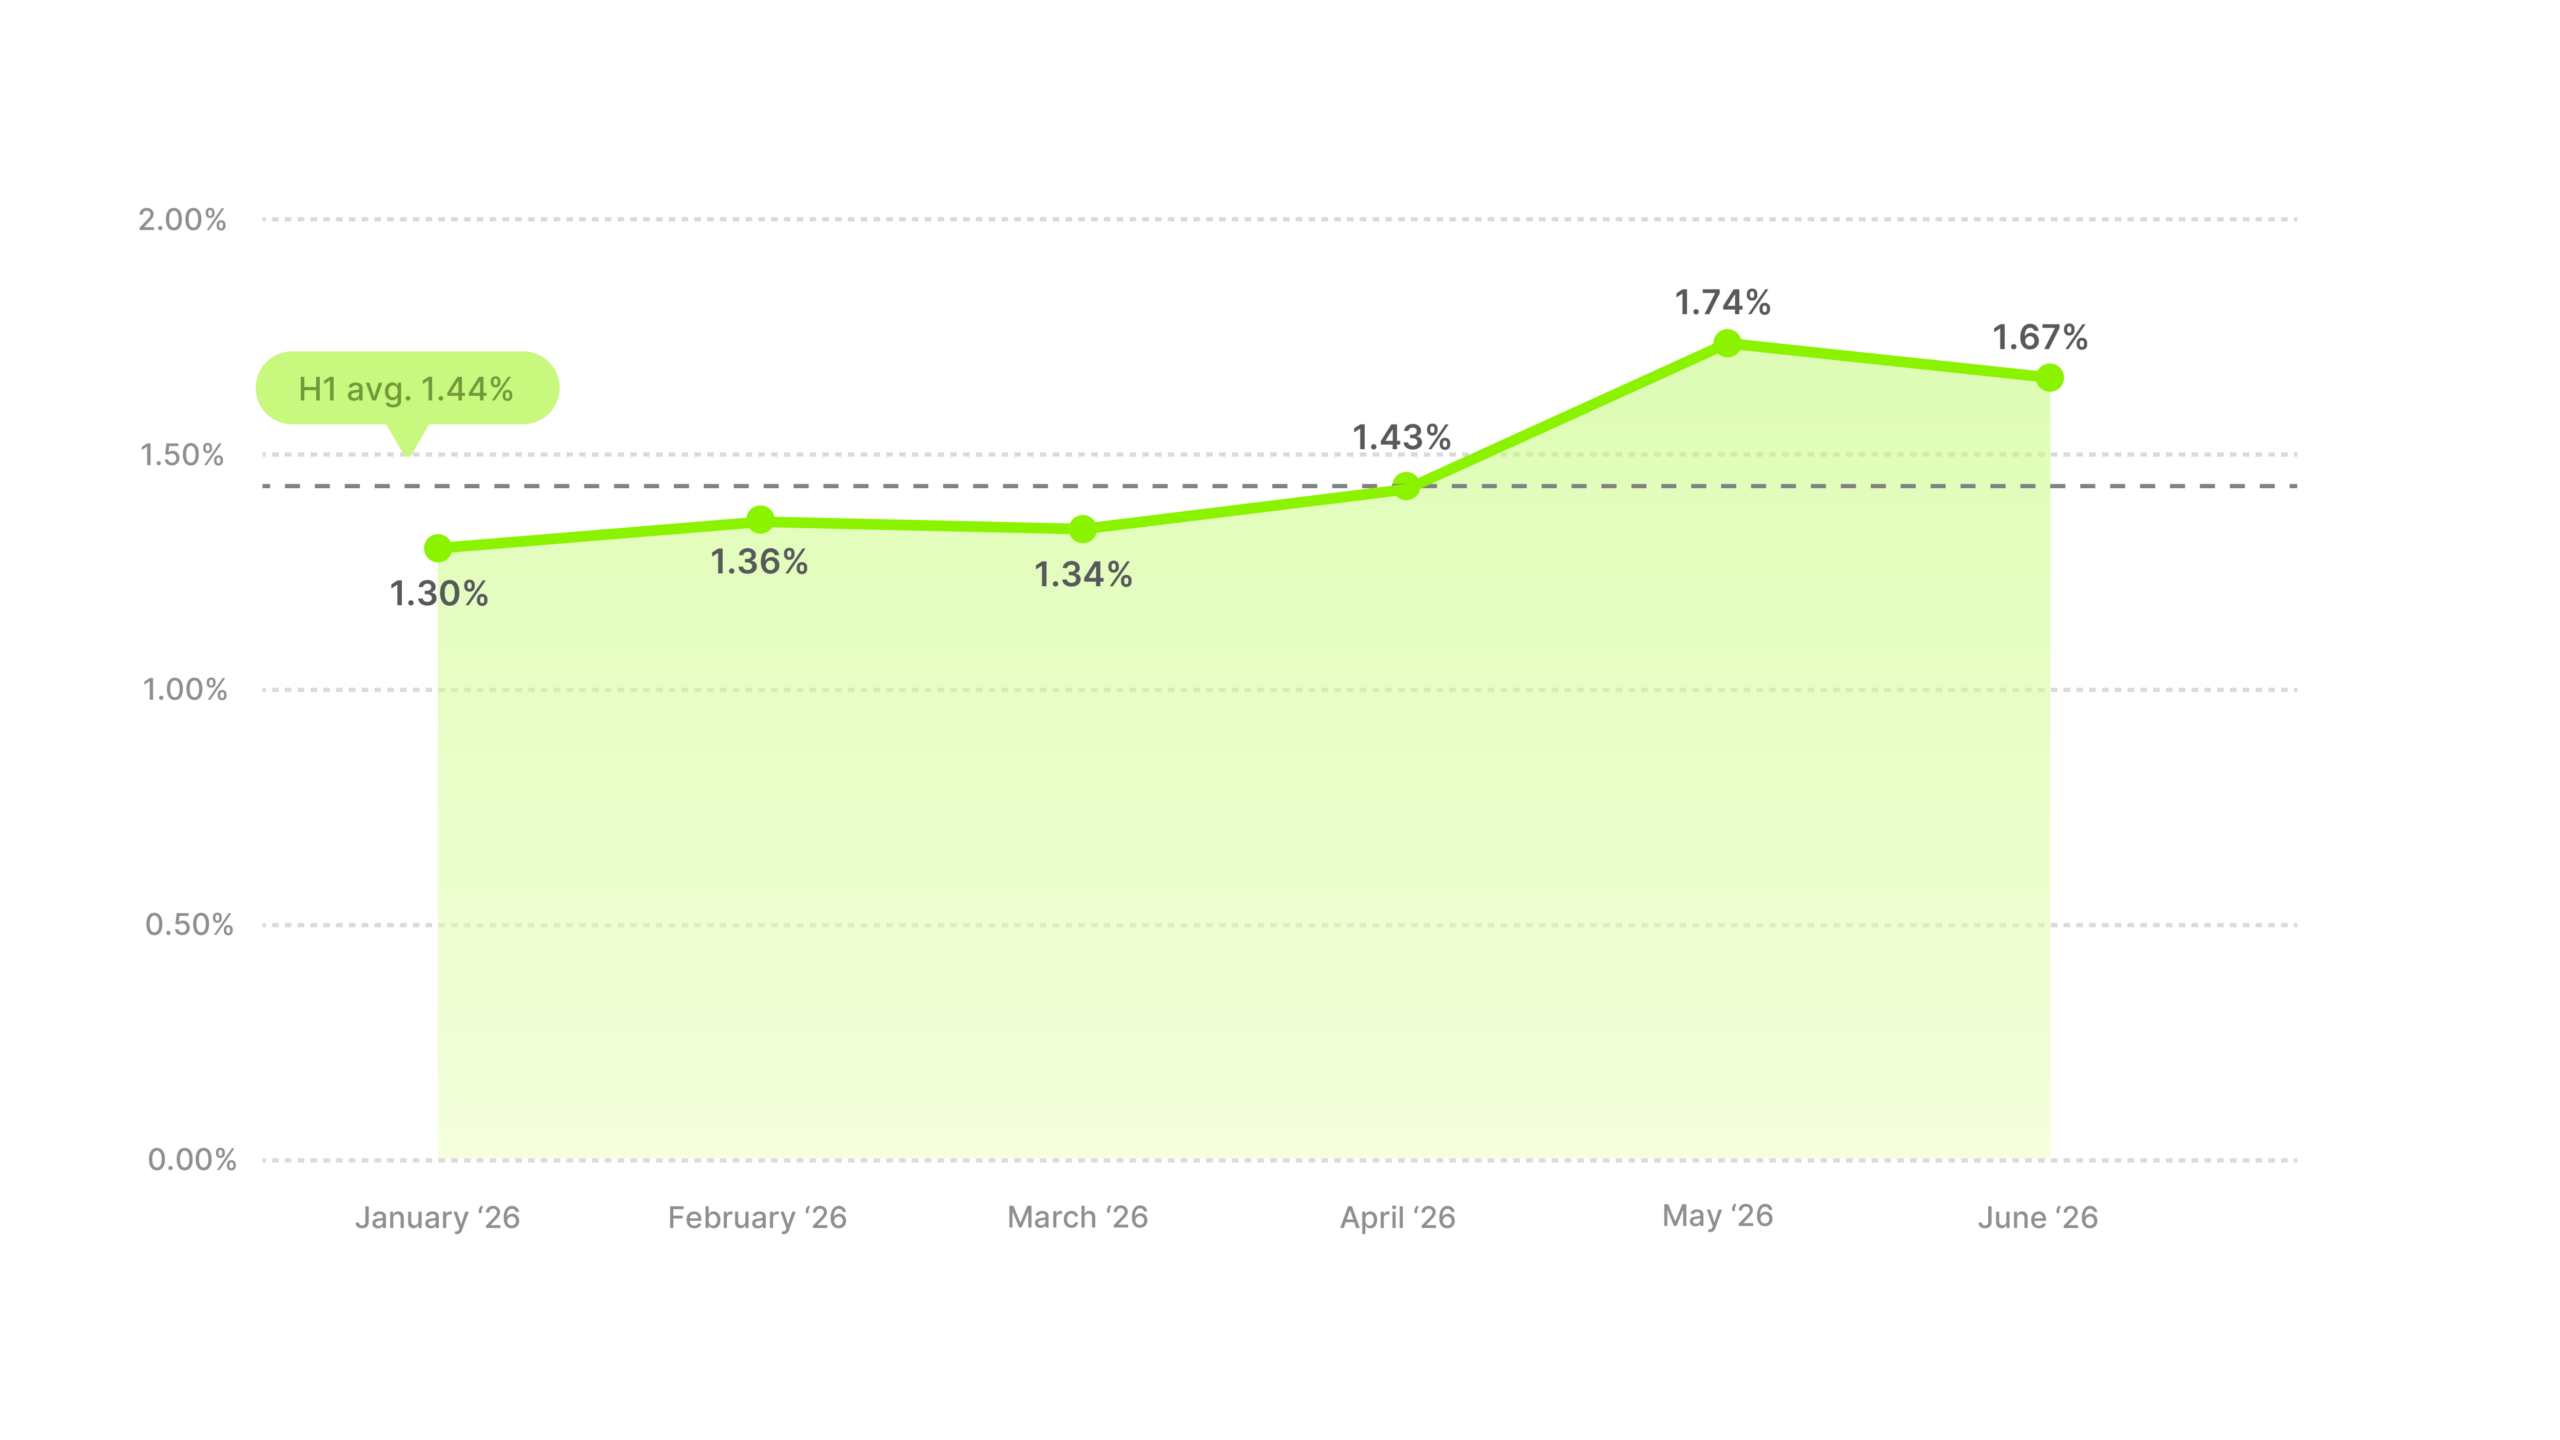
The first four months were flat and low, between 1.30% and 1.43%. Then May reached 1.74% and June held 1.67%. While eight of the fourteen categories finished the half at their lowest month, Sporting Goods finished near its highest.
The season is the obvious reason. Running, cycling, hiking and outdoor sport all pick up from spring into summer, and people buy the gear when they’re about to use it. No sale created that.
Sporting Goods raised its hook rate by nearly four points this half, the second-largest attention gain in the report, and its CTR still went down. Business & Industrial is the only other category where those two numbers moved in opposite directions.
The hook is working, so the fix is in what comes after it. Give people a reason to buy while the season is on, and put the spend into spring and summer instead of spreading it evenly across a flat winter.
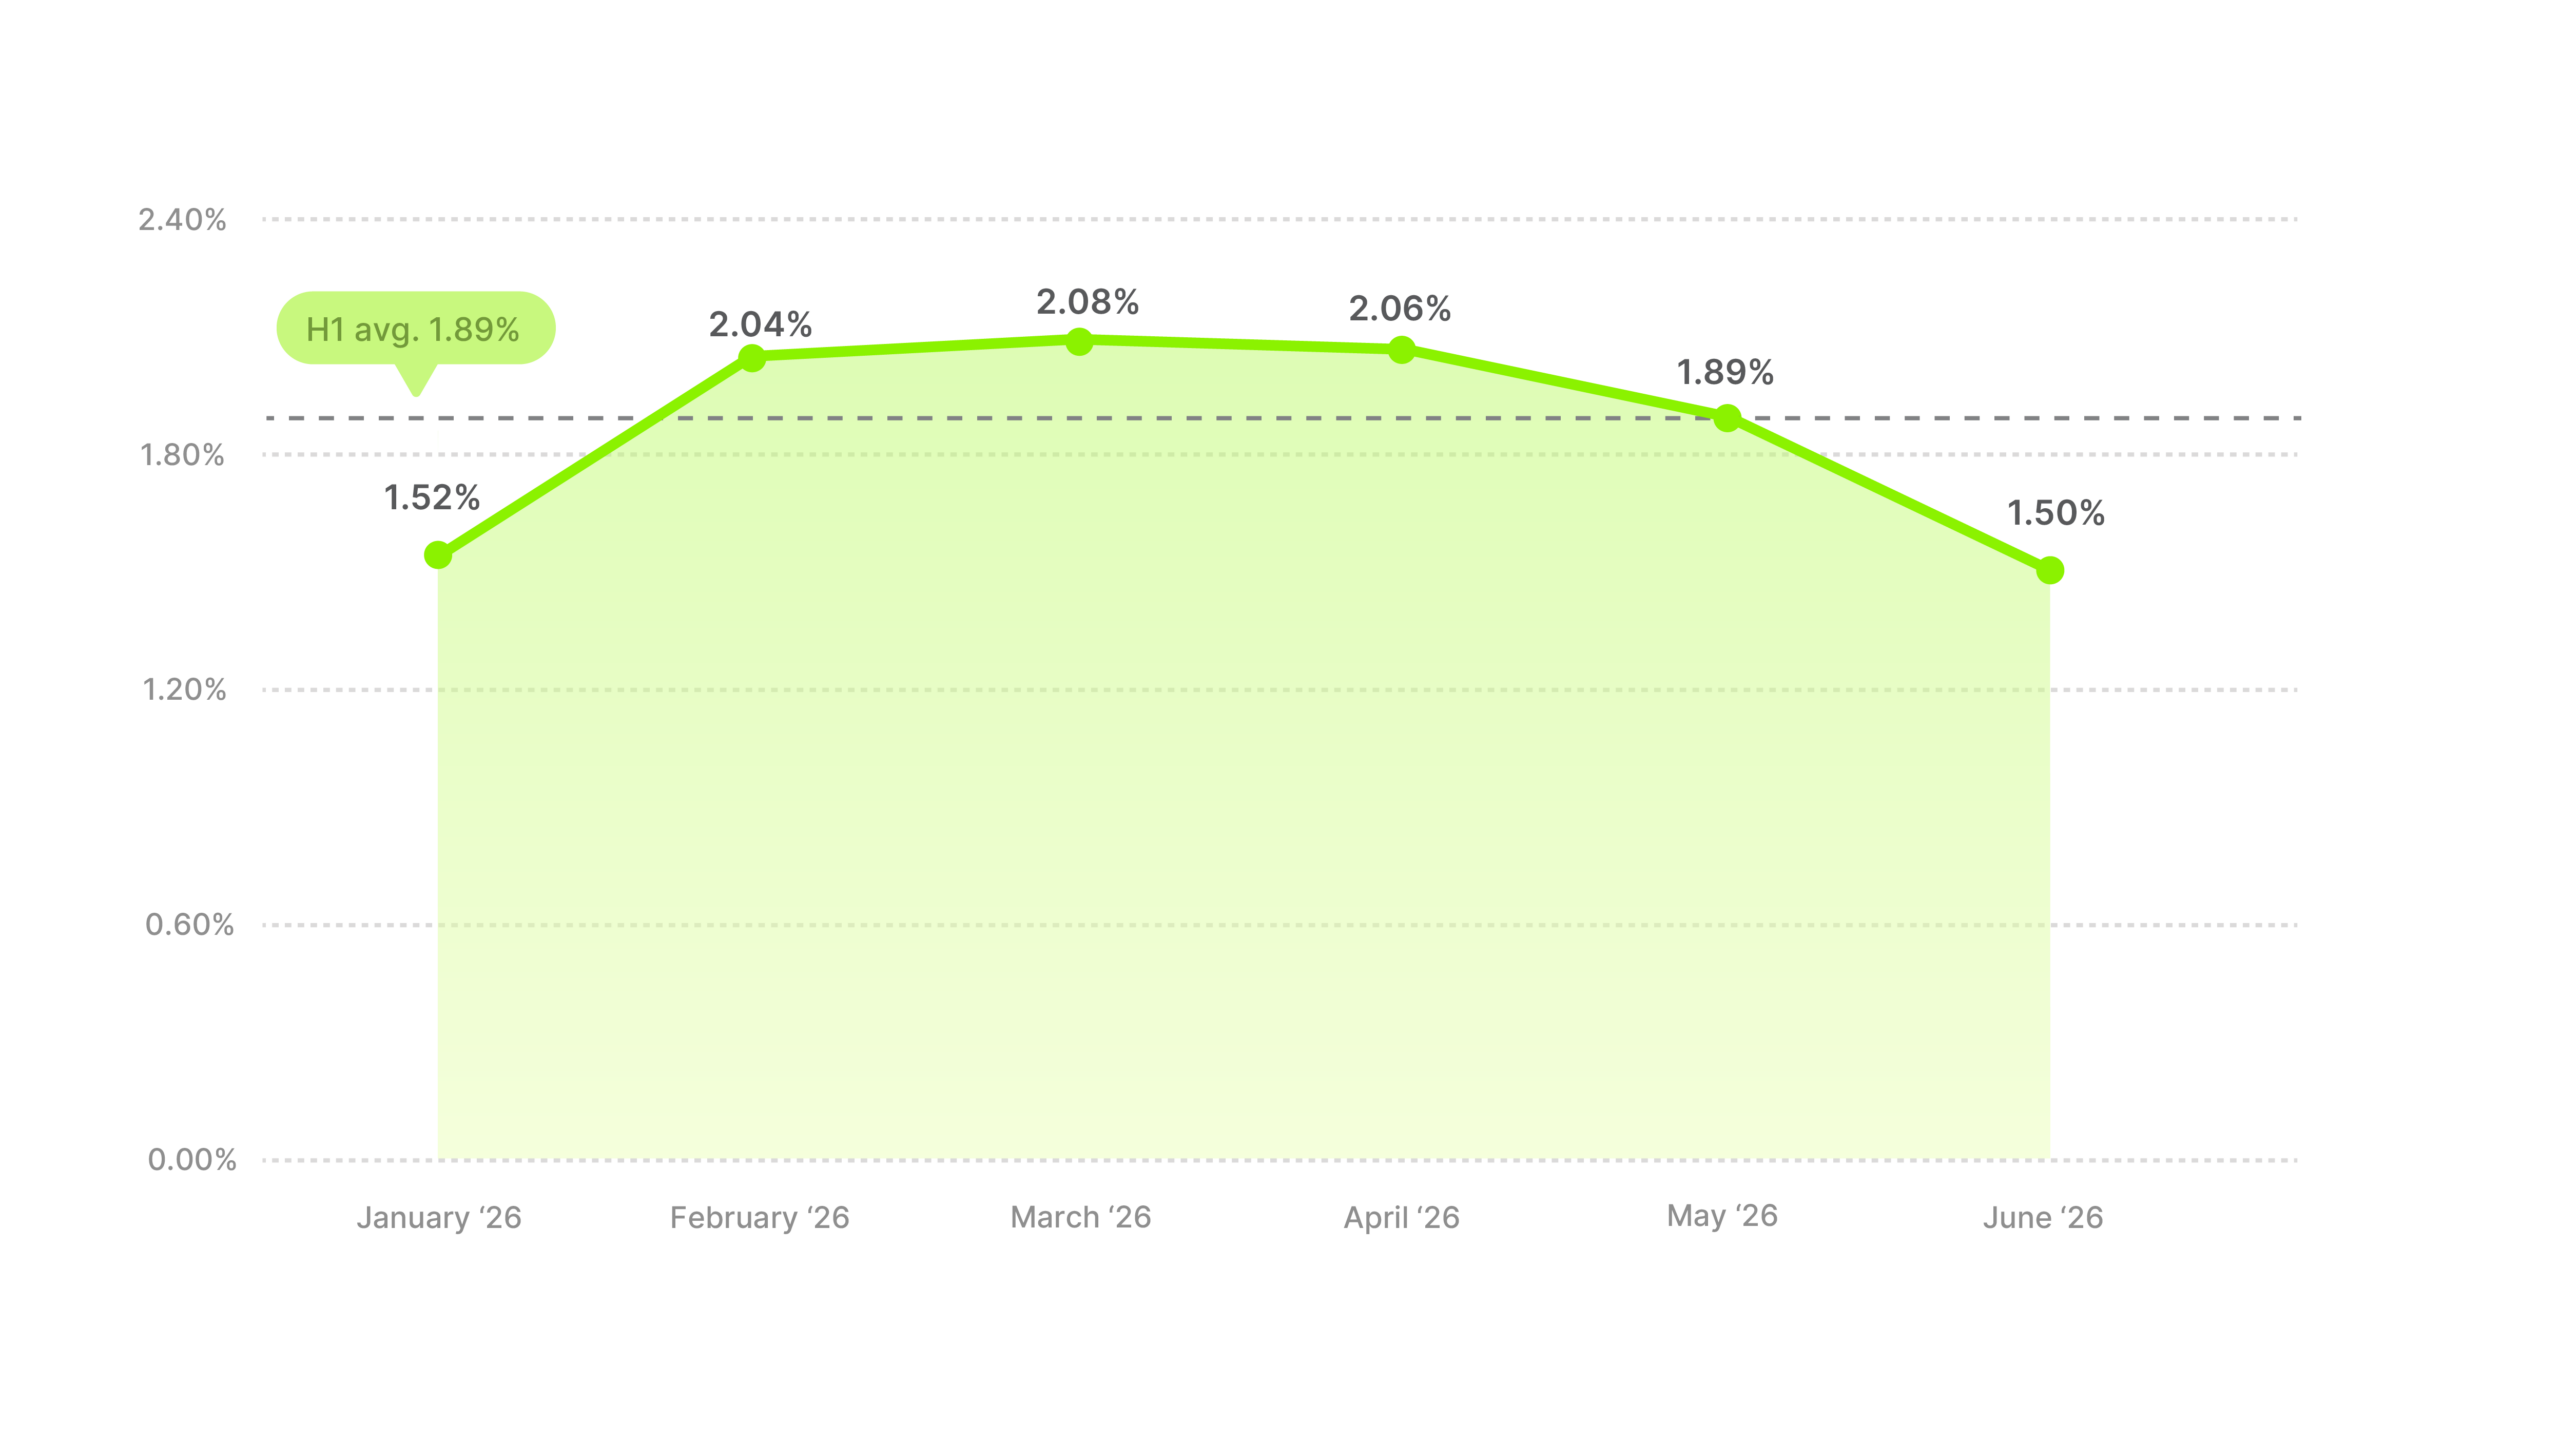
Toys & Games gained more click-through than any category in this report, 1.30% last half to 1.89% this half. That’s a 0.59 pp jump, and it moved the category from second-lowest to fourth-highest.
Industry CTR average
Toys & Games has always been good at getting attention. Last half only Health & Beauty had a better hook rate, and almost every other category had a better CTR. That made it the clearest case in the data of a category that could win attention and do nothing with it. This half its hook rate went up again, to the highest of the fourteen, and the CTR finally came with it.
The strong months were in the middle. January opened at 1.52%, February through April ran between 2.04% and 2.08%, then May eased to 1.89% and June finished at 1.50%. Toys sell hardest in Q4, so all of that happened in the off-season.
Benchmark to 1.89%. The gain most likely came from the back half of the ad, so that’s where to keep working. Give people a clearer reason to click, show what the toy actually does, and point the call to action at the parent who’s actually buying.
Other is where the smallest industries get pooled together, which makes it useful for reference and not much else. Its 1.58% ranks eleventh of the fourteen and falls below the 1.93% cross-industry average. Last half the identical 1.58% was above that half’s average. The number didn’t move, the market moved past it.
Industry CTR average
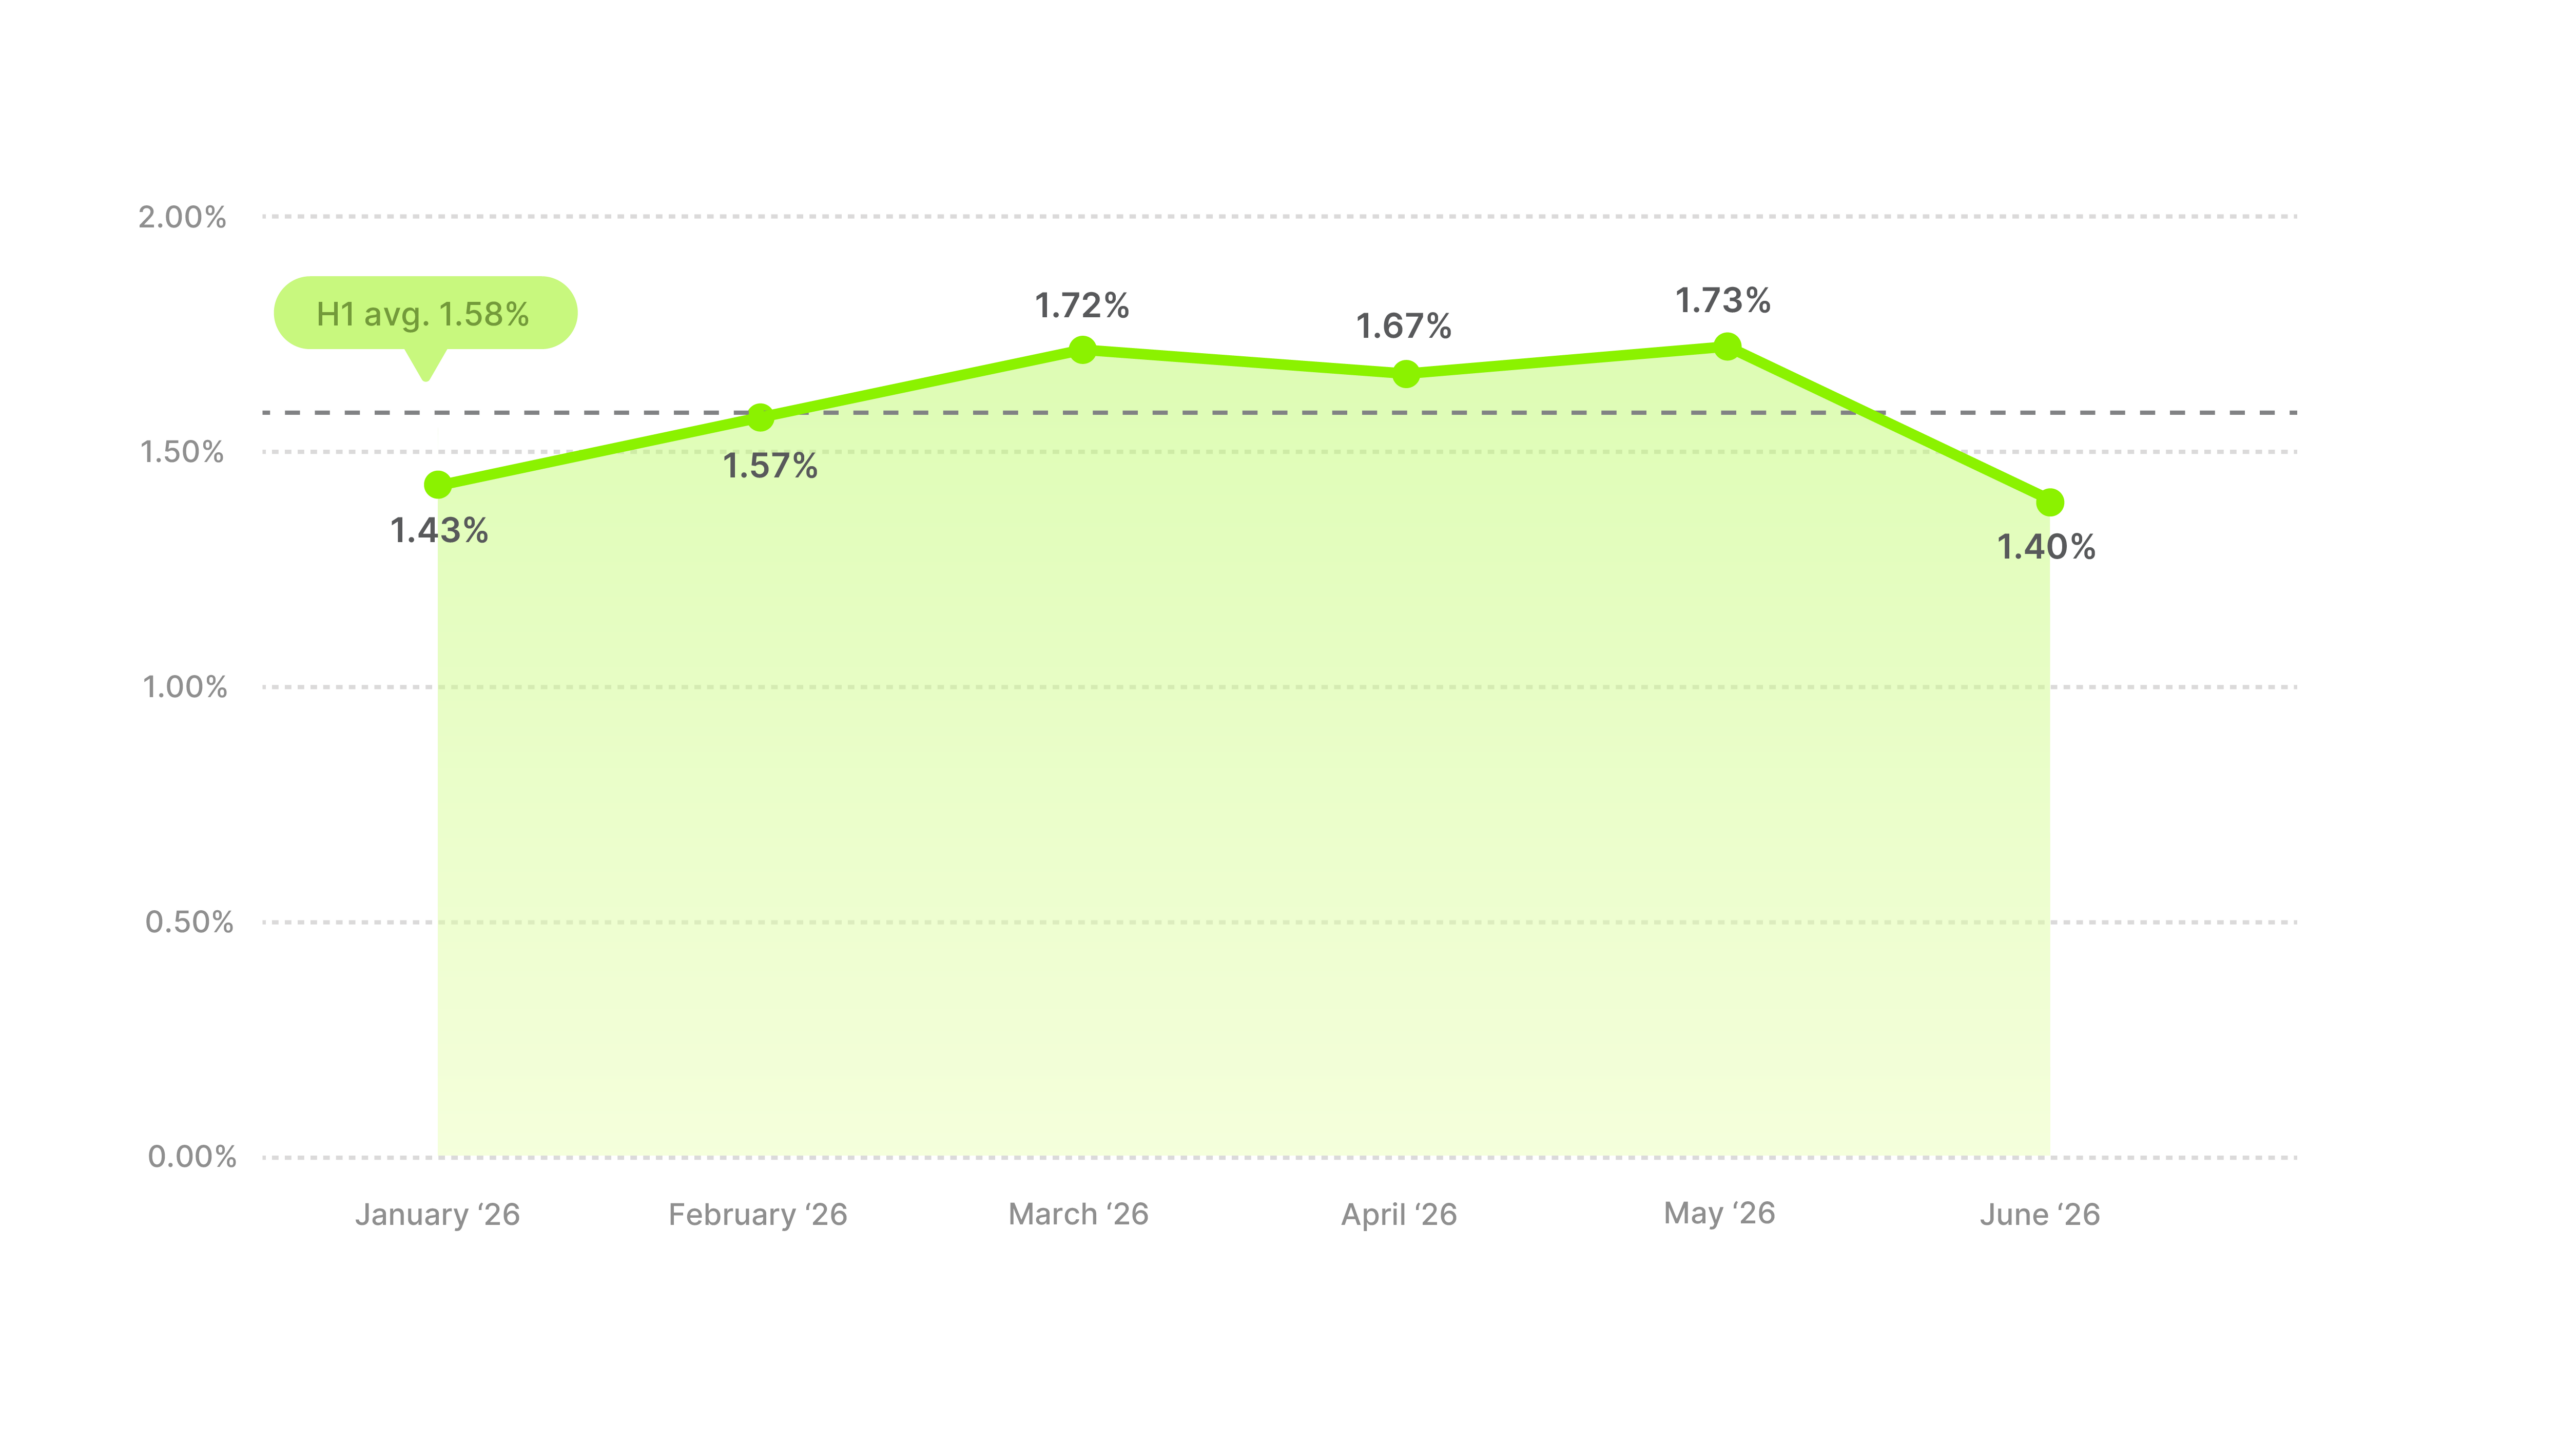
The monthly line opened at 1.43%, held between 1.67% and 1.73% from March through May, and finished at 1.40% in June. That’s a flatter version of what the whole market did, which is what you get when a lot of unrelated industries are averaged into one number.
If your industry lands in here, measure against your own previous half, or against whichever named category is closest to what you sell.
Since Other isn’t really a category, there’s no playbook of its own to follow. Borrow from the three that finished above 2%. Health & Beauty, Arts & Entertainment and Home & Garden all put the payoff on screen early. A visible result, a finished space, something people would watch anyway.
Methodology
Data source: 88,329 Meta video ads that ran between January 1 and June 30, 2026.
Inclusion criteria: Sales-objective video ads with reliable metrics and more than 1,000 impressions.
CTR definition: Link clicks divided by impressions. It’s the share of people who saw your ad and went on to click, and it measures whether the ad earned the next step and not just the attention.
Industry classification: Fourteen categories assigned by advertiser product type. “Other” holds the industries too small to report on their own.
A note on interpretation: These figures describe what happened in H1 2026. They aren’t a forecast or a guarantee. Smaller-sample categories are more sensitive to the behavior of individual advertisers.