What stood out
1. Your category mattered far more than your timing. The top and bottom of the table were 3.95 apart, Baby & Toddler at 4.99 and Software at 1.04. The cross-industry average moved only 0.29 across the whole half, from 2.34 in February down to 2.05 in March. So the gap between industries was nearly fourteen times the gap between months.
2. The categories that got the most attention mostly made the least money. Toys & Games had the highest hook rate of the fourteen at 28.79% and finished twelfth on ROAS. Baby & Toddler had the lowest click-through rate at 1.37% and finished first. Creative that almost anyone will watch likely pulls in a wide audience that was never going to buy.
3. Two categories barely made back what they spent on ads. Software averaged 1.04 and Animals & Pet Supplies averaged 1.05, near enough a dollar back for a dollar in. That’s before the cost of making and shipping anything, so the average ad in both categories lost money.
Overall ROAS trend, H1 2026
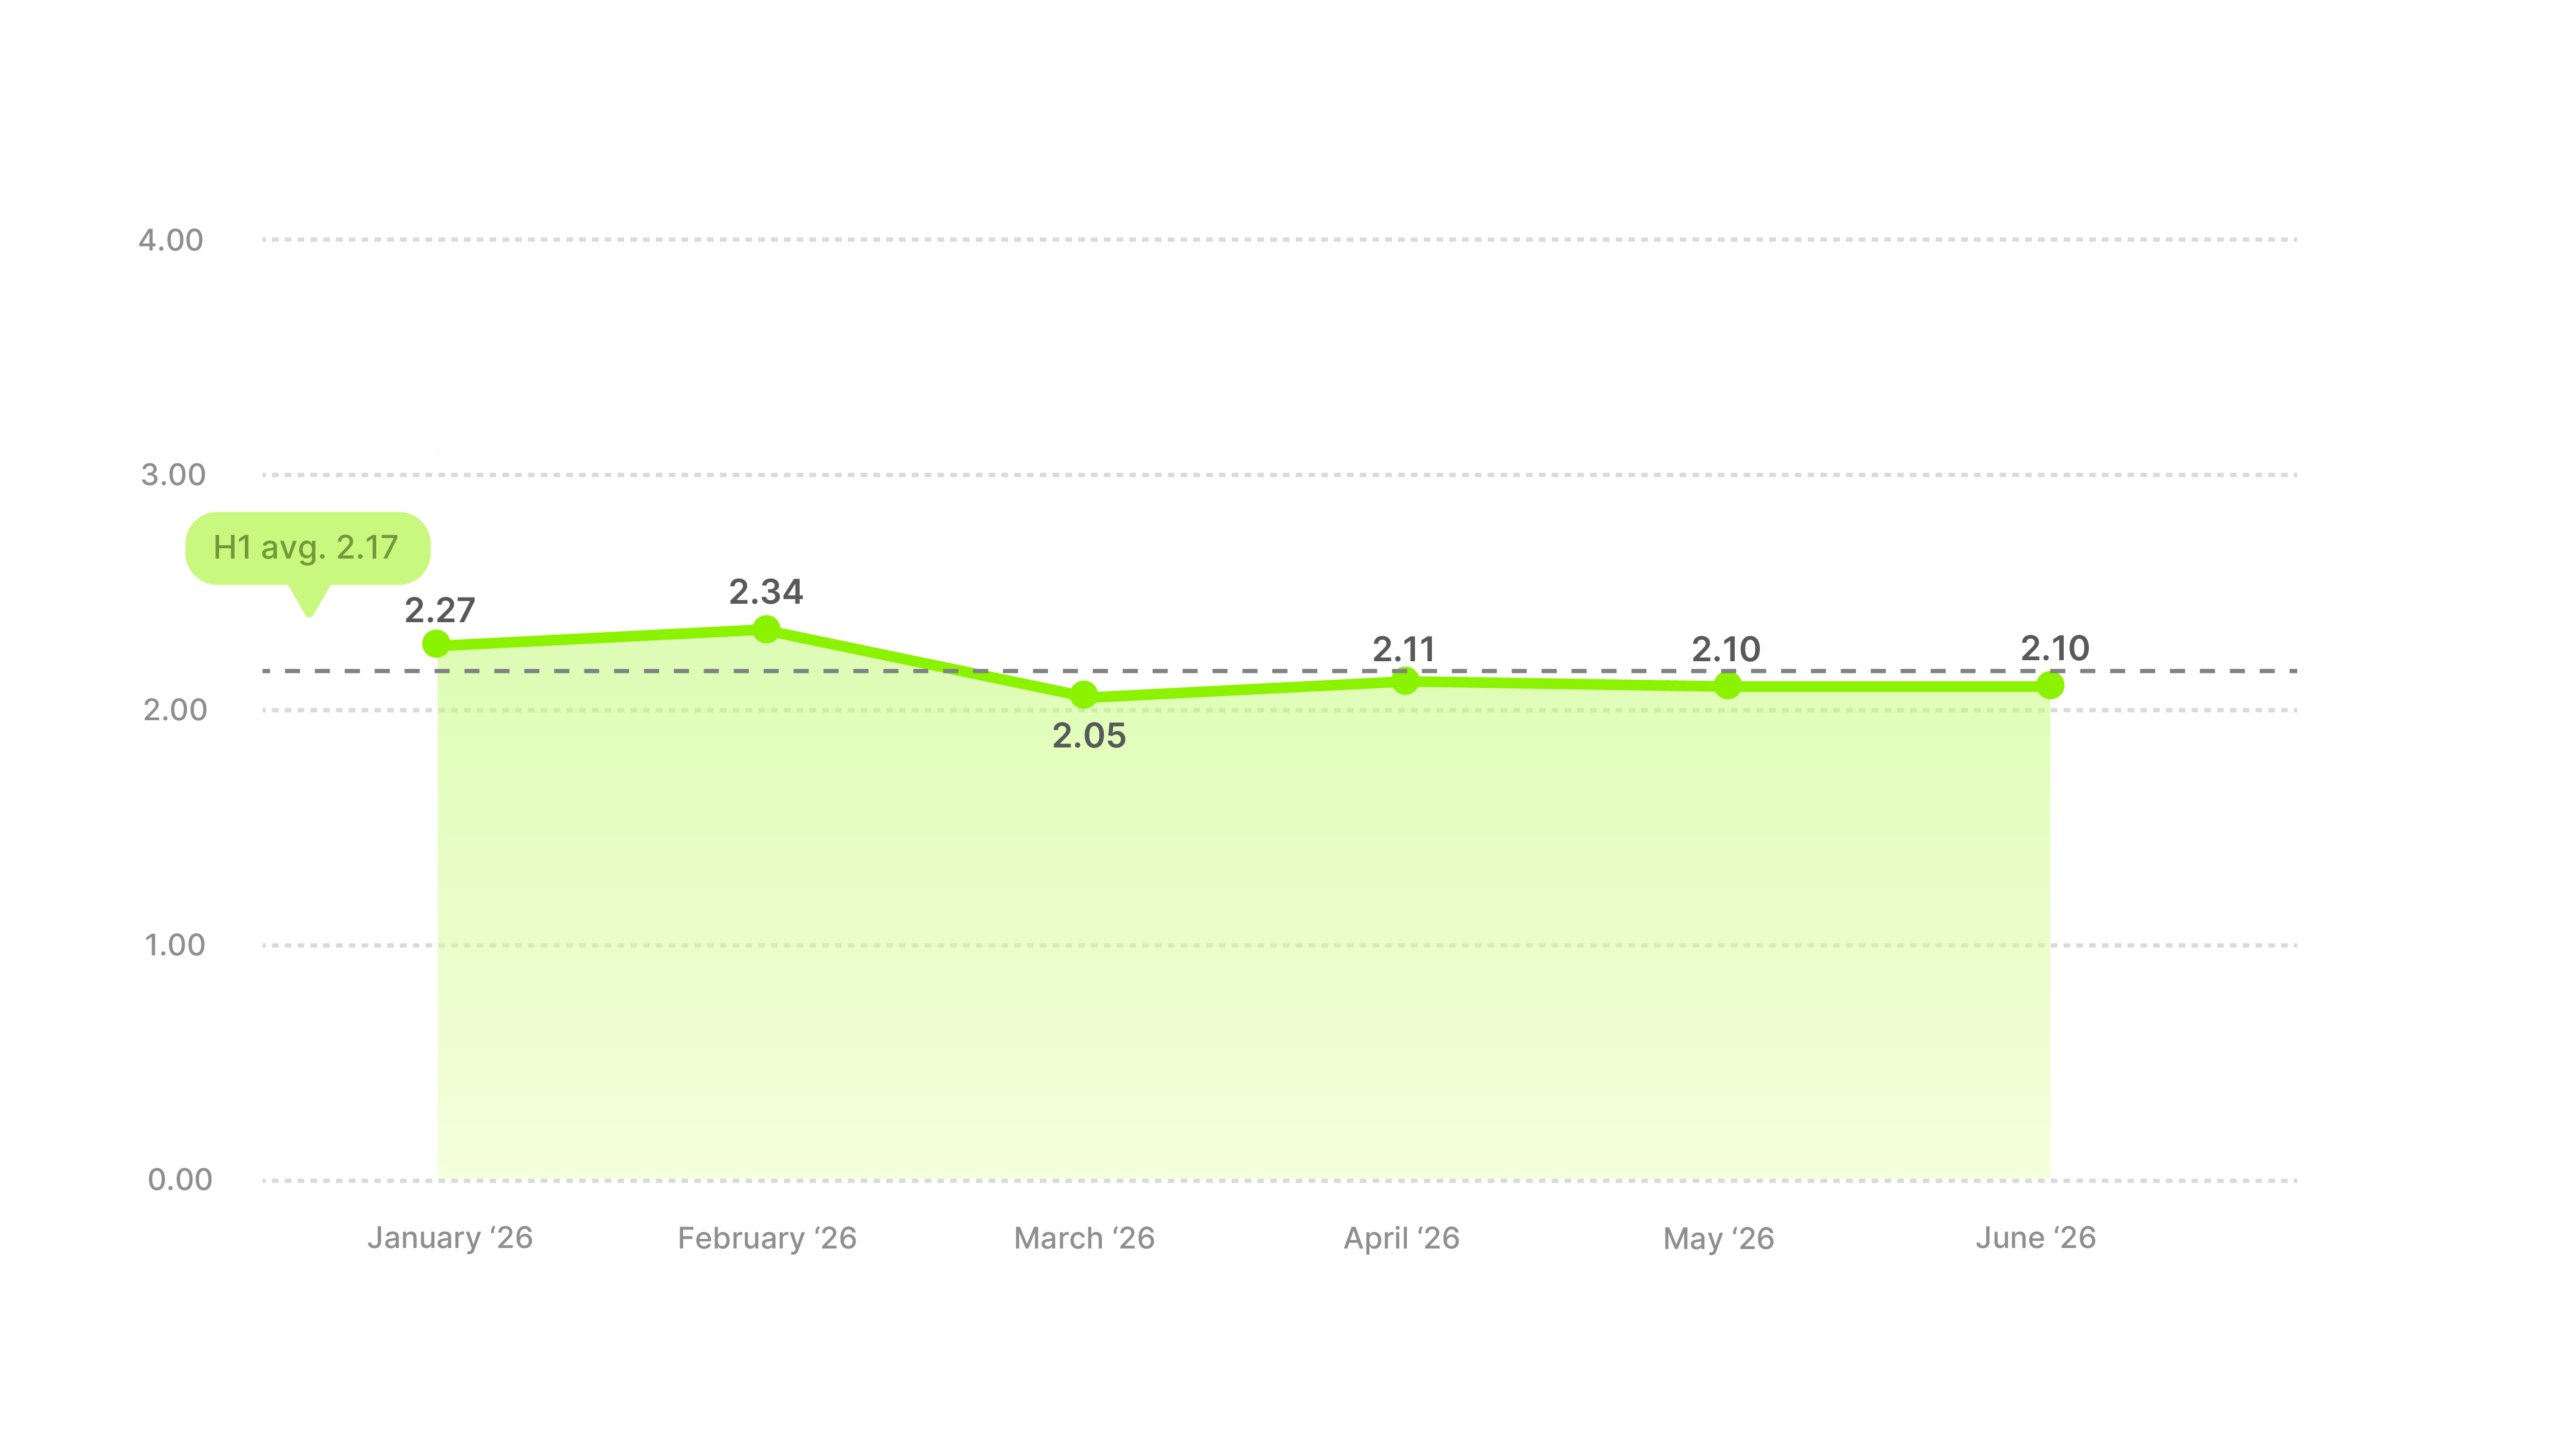
ROAS opened at 2.27 in January and reached 2.34 in February, the strongest month of the half. Then it fell to 2.05 in March and barely moved again, 2.11 in April and 2.10 in both May and June. The strongest month and the weakest were 0.29 apart.
The last four months were all within 0.06 of each other, the flattest stretch of ROAS in either half we’ve measured. February to March was the only real change all half.

That flatness belongs to the average and not to the categories inside it. Thirteen of the fourteen had a wider month-to-month range than the cross-industry line did, and Arts & Entertainment’s range was fifteen times wider. So the steadiness at the top of this report doesn’t describe how any single category actually looked.
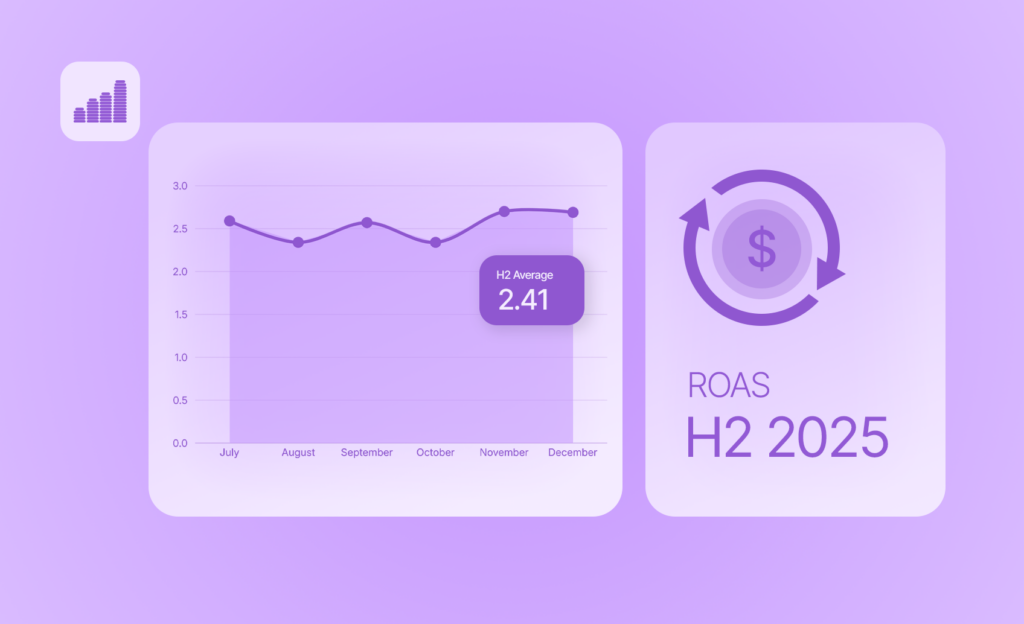
Last half the cross-industry average was 2.41. This half it was 2.17, about 10% lower, and eleven of the fourteen categories came in under their own last-half figure. Nothing in this data says why, and six months isn’t enough to separate a market-wide move from a change in who was advertising.
2.17 also hides how far apart the categories underneath it ended up. The gap between the top of the table and the bottom is wider than it was in the last ROAS report, and eleven of the fourteen finished June lower than they started January.

Use 2.17 to check the market, and your own category to set the target. Hitting 2.17 as a Baby & Toddler brand would have put you two full points under your worst month of the half. Hitting it as a Software brand would have beaten both halves we’ve measured.
ROAS benchmarks by industry
The fourteen categories went from Baby & Toddler at 4.99 down to Software at 1.04. Last half the same range was 2.45, so the gap between the top and the bottom of this table grew by more than half. Over the same period the month-to-month range of the cross-industry average shrank, from 0.36 to 0.29.
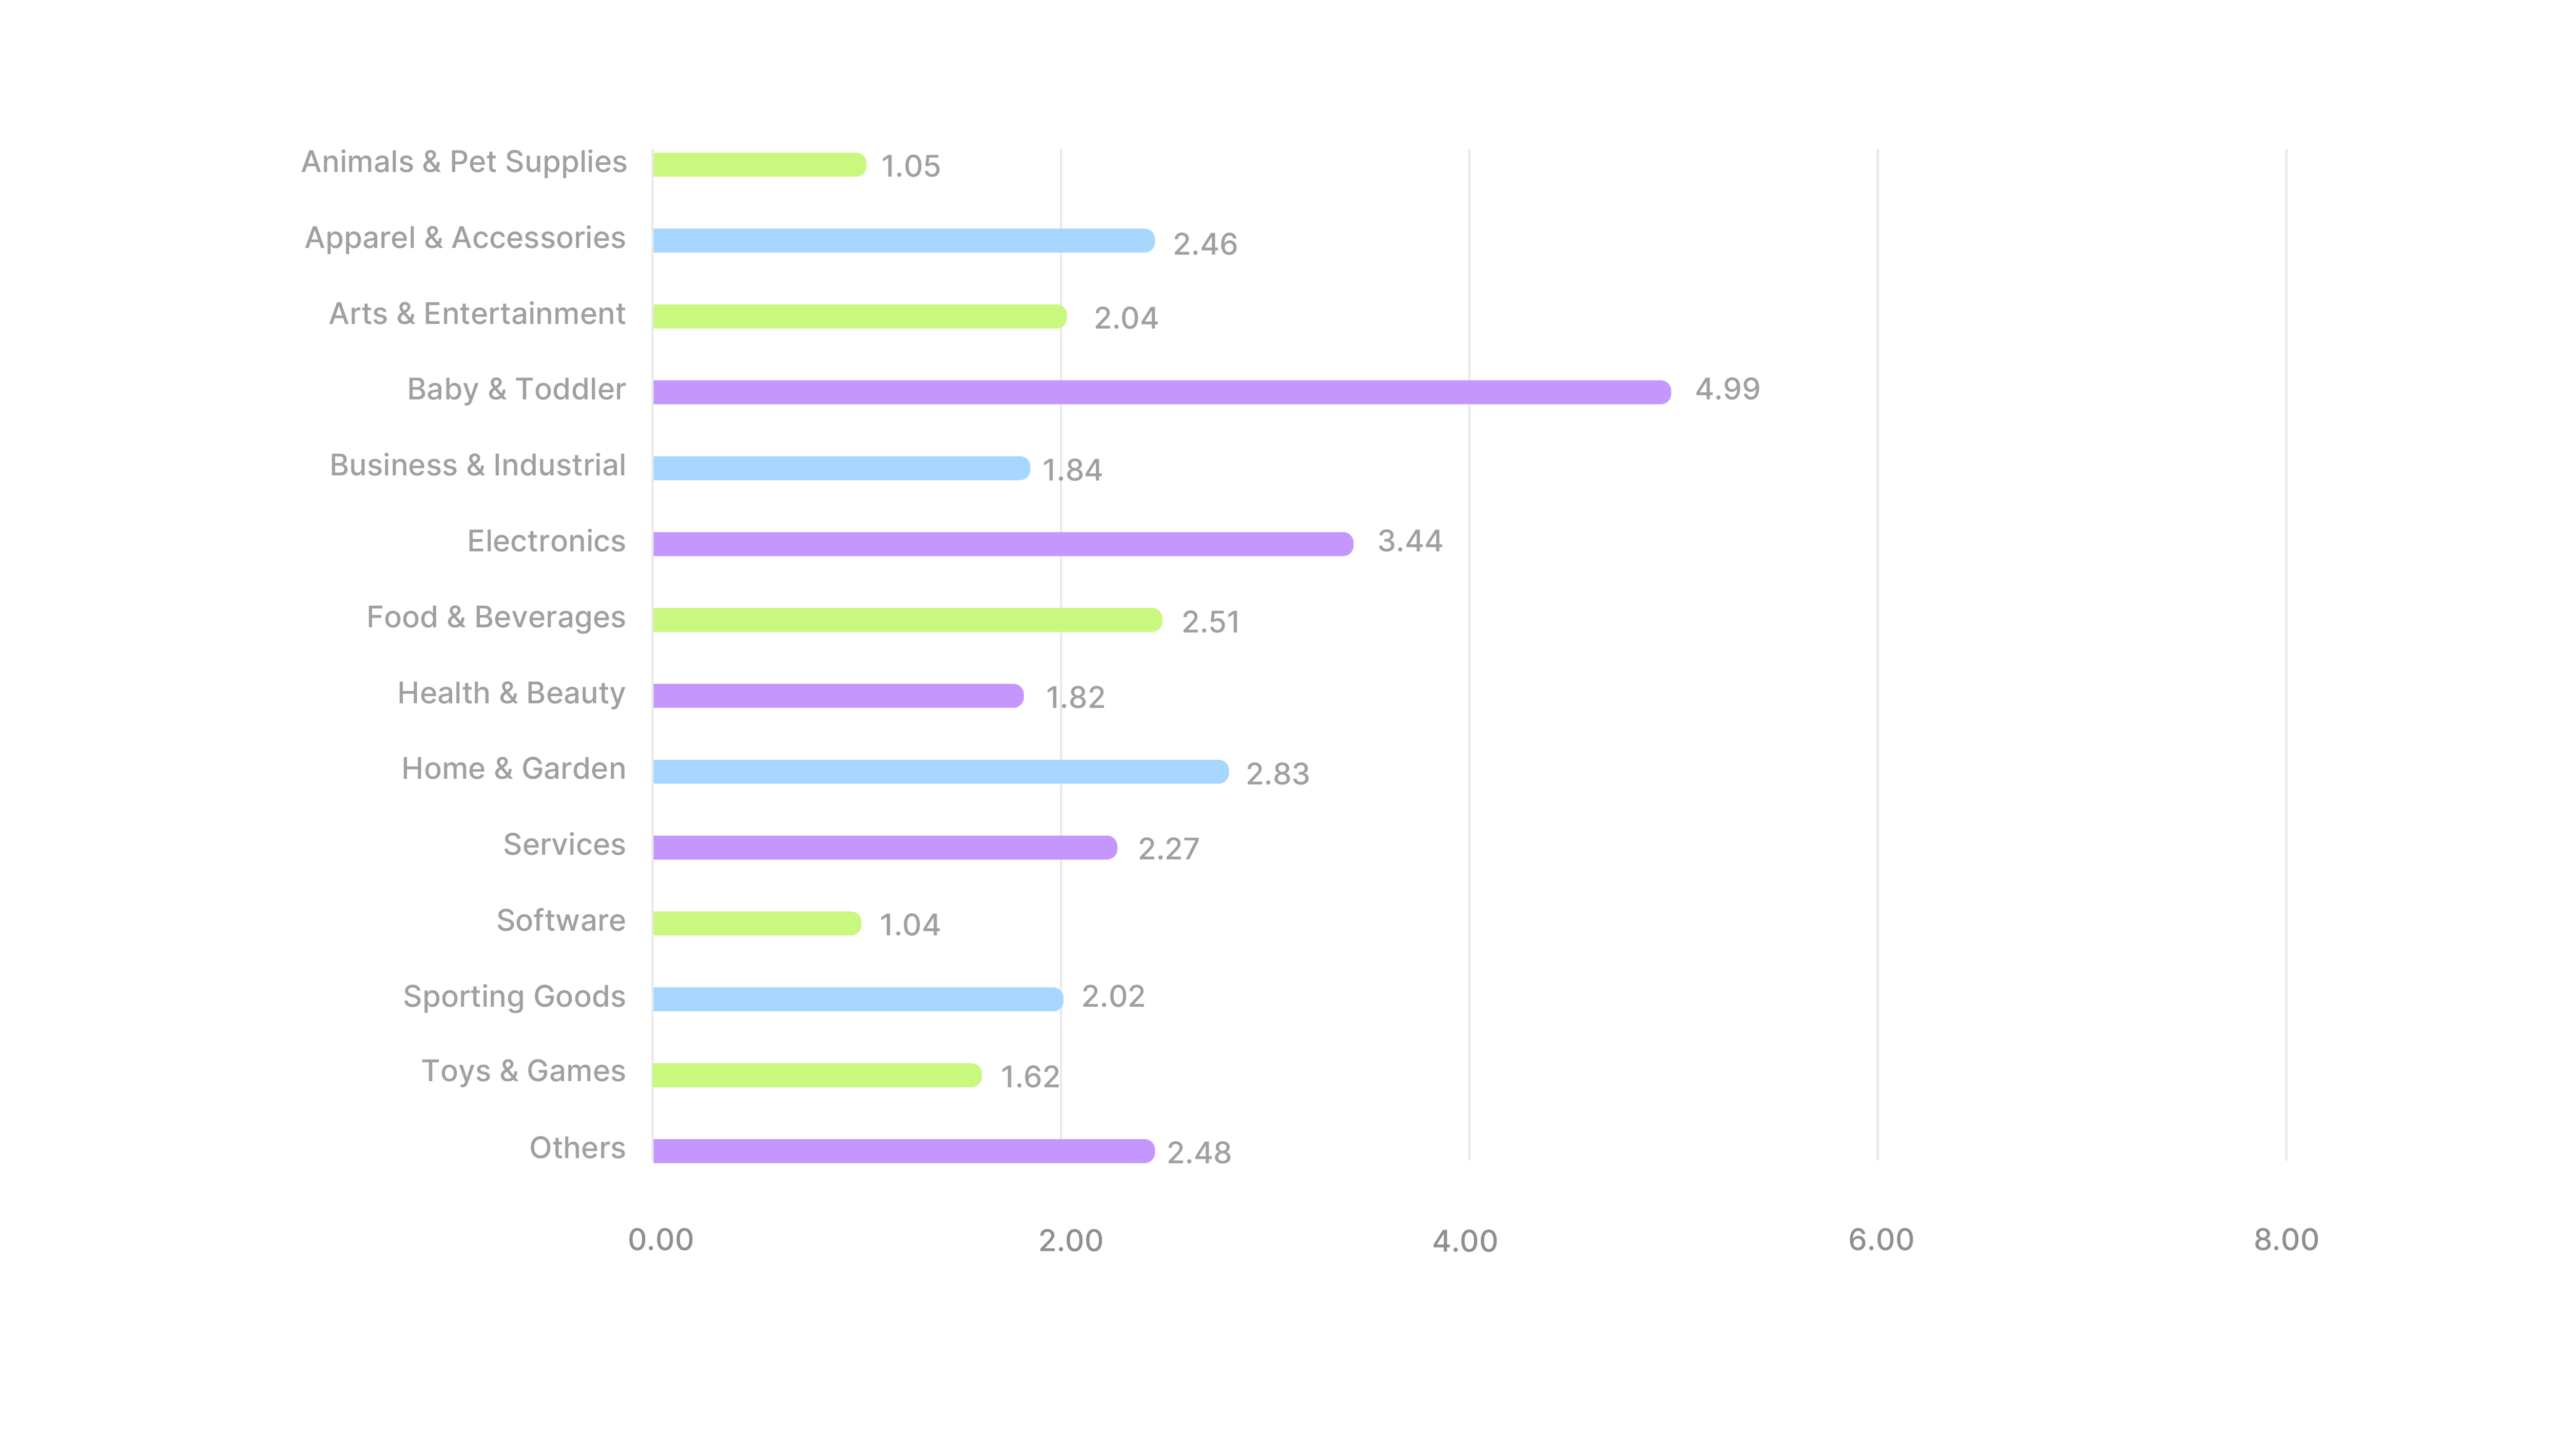
The table breaks into five groups. Baby & Toddler is alone above 4, and Electronics is alone above 3 at 3.44. Seven categories are packed between 2.02 and 2.83. Business & Industrial at 1.84, Health & Beauty at 1.82 and Toys & Games at 1.62 come next, then Software and Animals & Pet Supplies at about 1.0.
That group of seven spans just 0.81 from top to bottom, so where a category comes in the middle of this table doesn’t tell you much. Seventh place and ninth place are 0.25 apart.
Baby & Toddler is the exception. Even in April, its weakest month, it averaged 4.18, and no other category averaged that much across the whole half. It was twelfth of fourteen on hook rate.
At the other end of the table, two categories spent part of the half losing money. Animals & Pet Supplies and Software both dropped under 1.00 through the spring, and no other category had a single month below 1.29.
Two of the fourteen rose against last half and twelve fell. Find your category below and plan against its number. The figure at the top of this page describes the market as a whole, and it isn’t a target for anyone.
Industry deep dives
Fourteen categories, measured over the first six months of 2026. Each section below takes one industry and covers where its number came in, what the months did, and what to do about it.
For three months of this half the average Animals & Pet Supplies ads lost money. Across all six the category came out at 1.05, thirteenth of fourteen and less than half the 2.17 cross-industry average.
Industry ROAS average
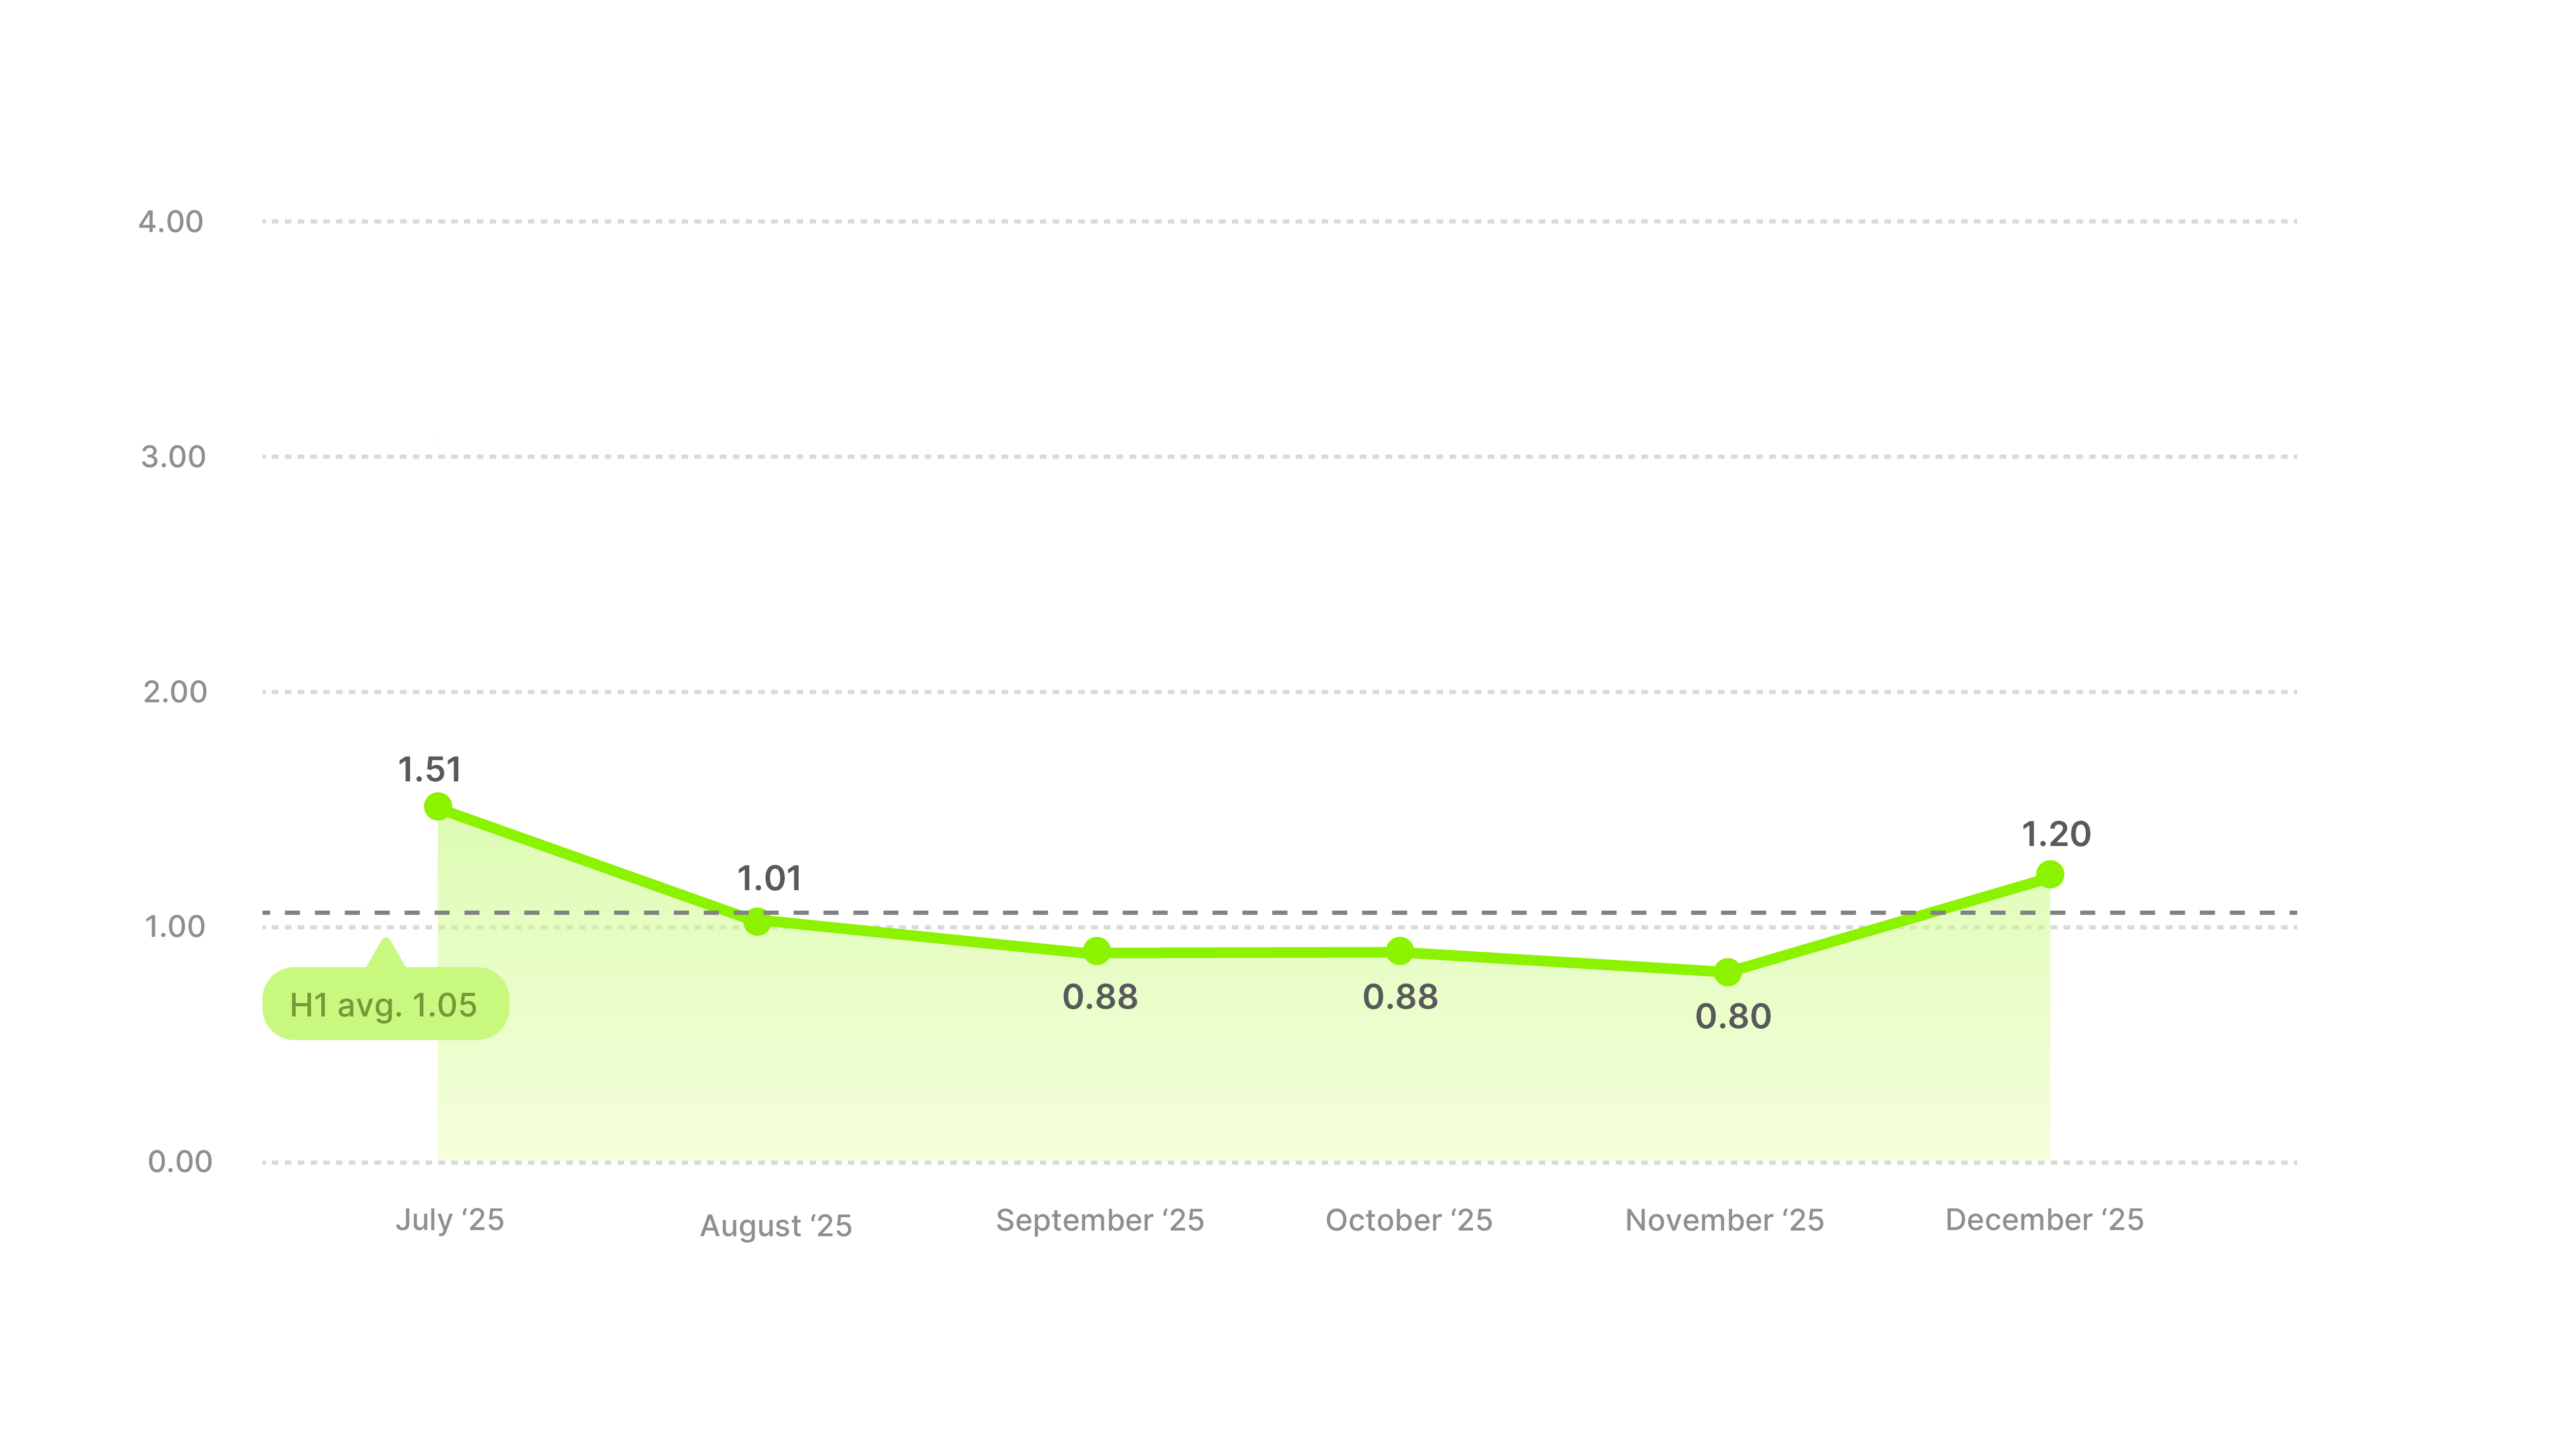
January was the best month at 1.51 and February came in at 1.01. Then March and April both came in at 0.88 and May bottomed at 0.80, before June recovered to 1.20. The 1.05 half-average is really just a strong January and a June recovery propping up four weak months in between.
Against 1.66 last half, Animals & Pet Supplies gave up 37%.
Animals & Pet Supplies had the lowest hook rate of the fourteen at 21.32%, finished eleventh on click-through rate, and finished thirteenth here. No other category is that low on all three, so the problem starts long before anyone reaches a checkout.
People buy pet food again every few weeks, so a customer is worth far more here than a first order. Auto-ship and subscription offers, a price framed per day, and reminders timed to when the last bag runs out will all do more than chasing new buyers. January was the best month of the half, probably because anyone who got a pet at Christmas is buying for it by January, so that’s where the acquisition spend may offer the most return.
Apparel & Accessories averaged 2.46, sixth of fourteen and a little above the 2.17 cross-industry average. It opened the year at 2.88 and closed it at 1.84, so that half-average is a level the category passed through on the way down.
Industry ROAS average
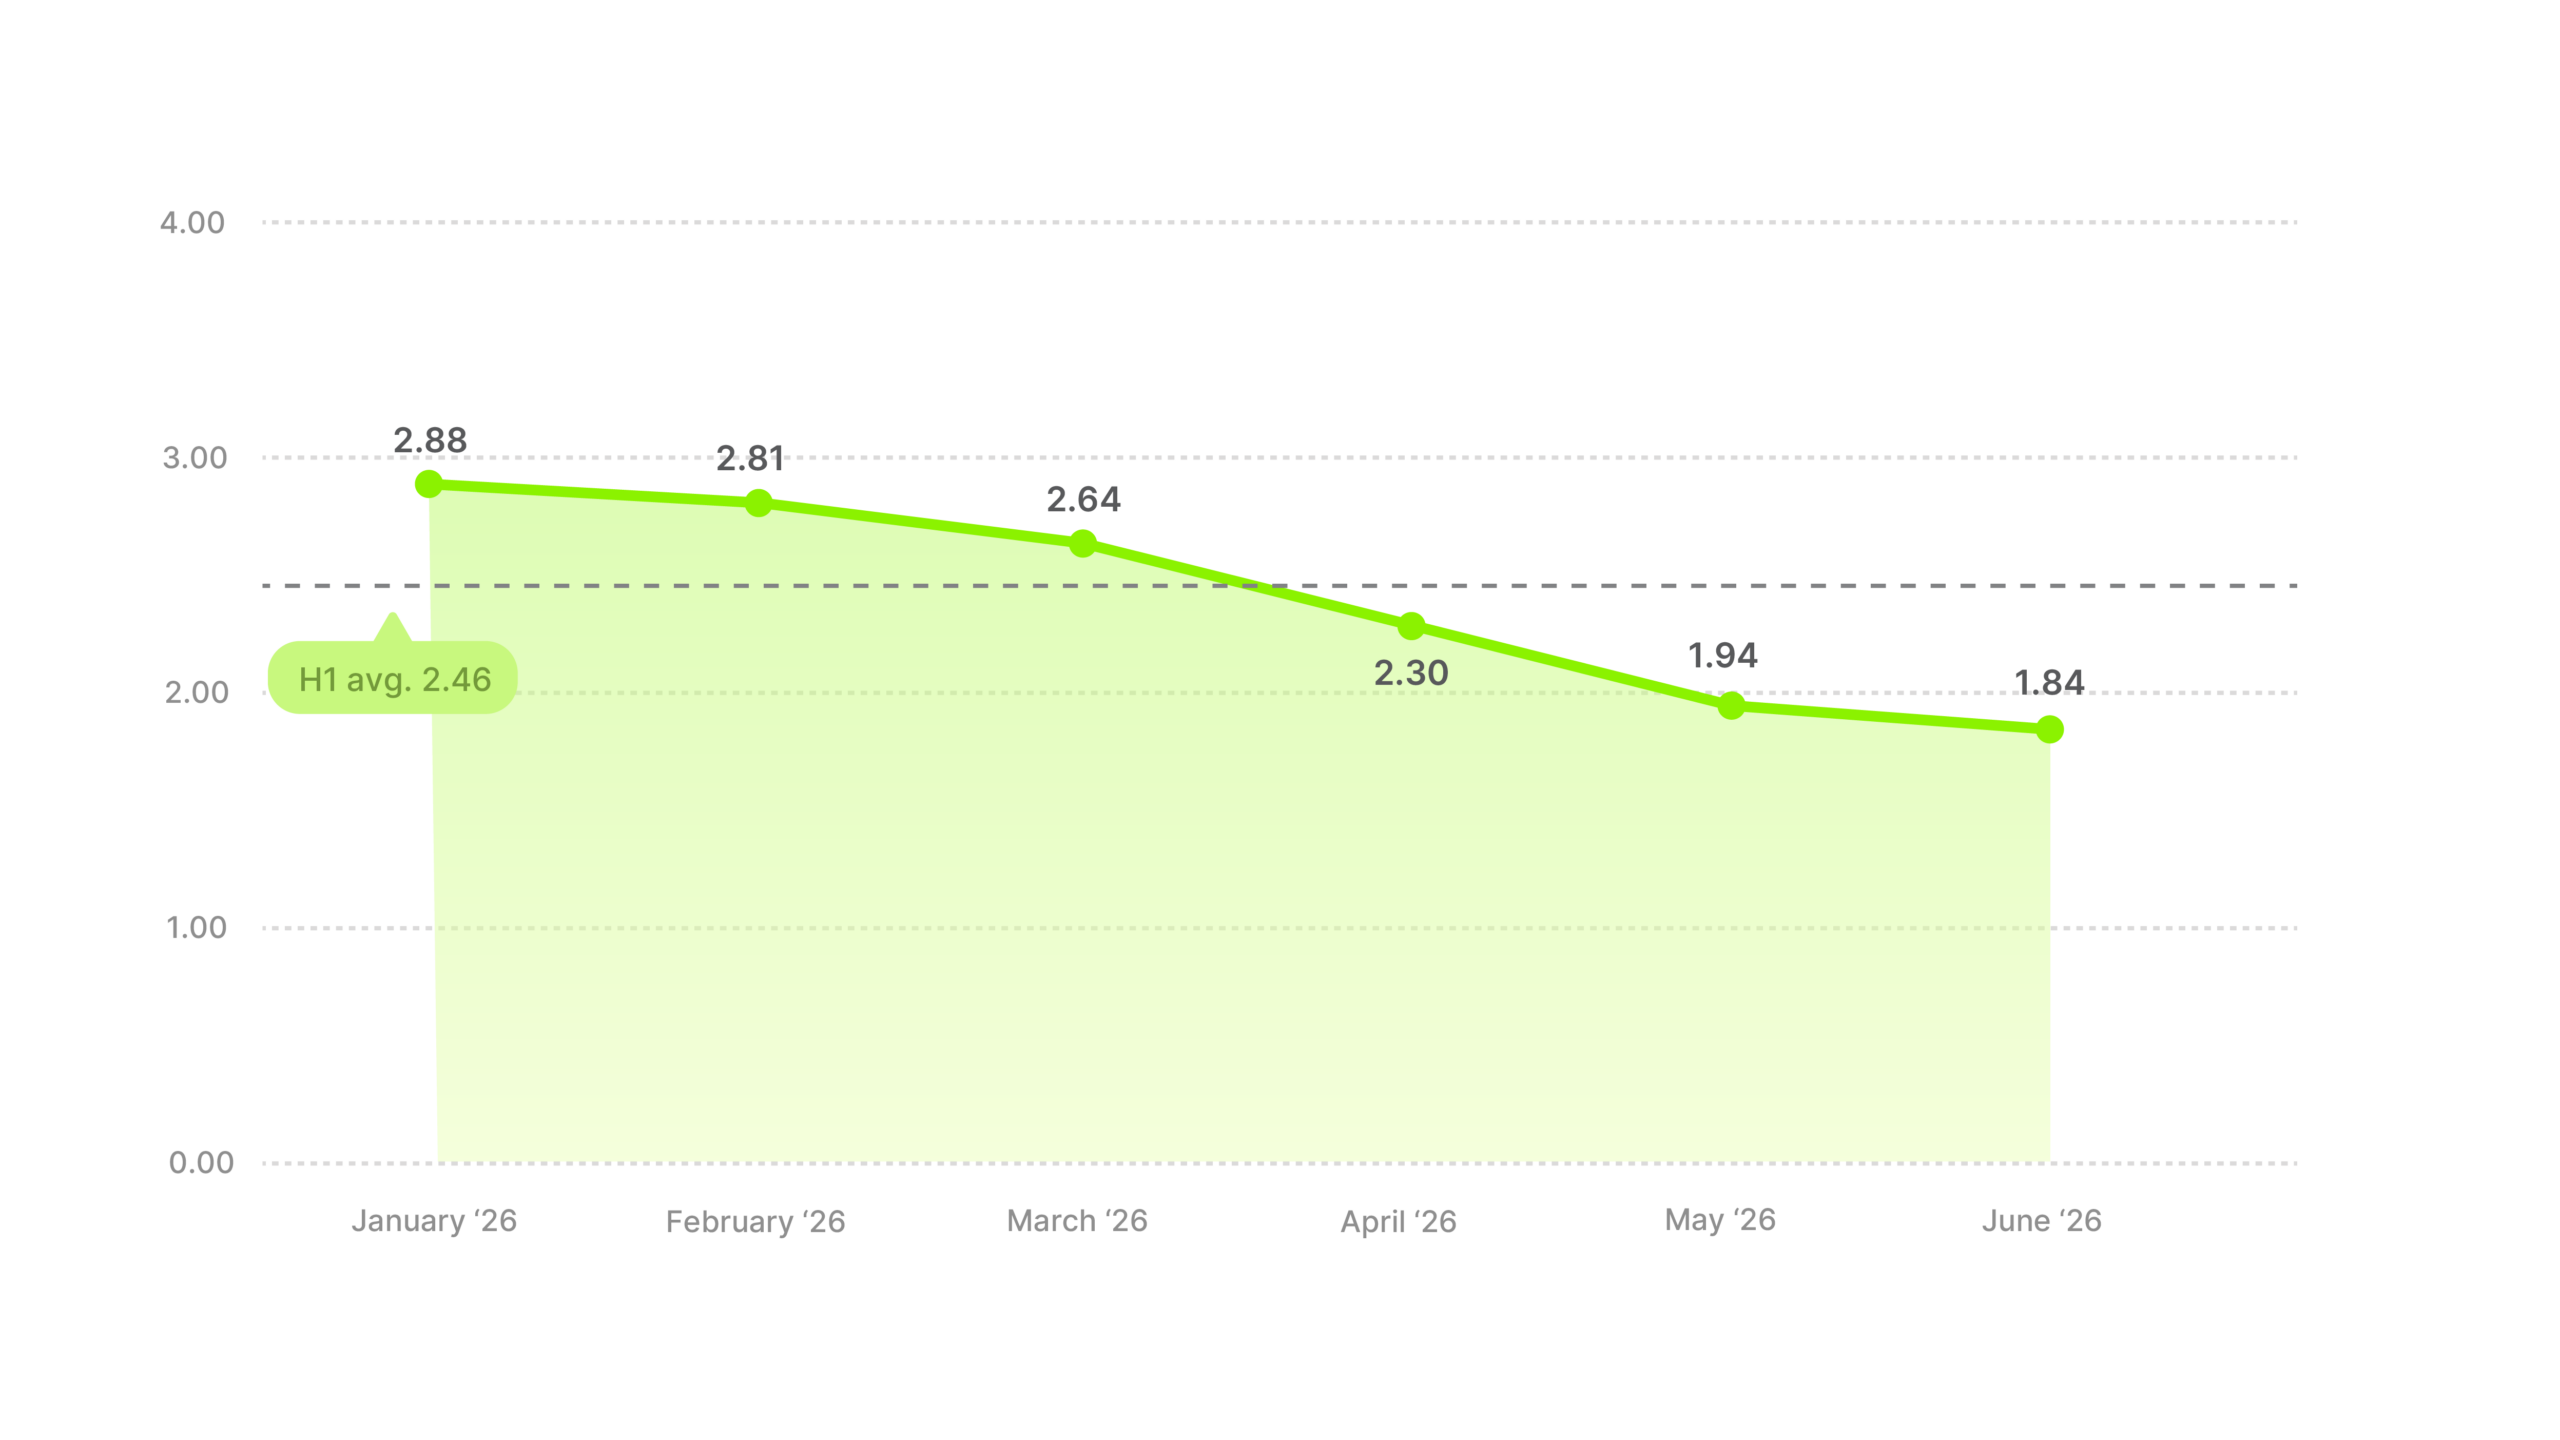
Apparel & Accessories fell every single month. 2.88 in January, 2.81 in February, 2.64 in March, 2.30 in April, 1.94 in May, 1.84 in June. It’s the only category in the report that declined at every step. It started well above its own average, dropped below it in April, and was under the cross-industry 2.17 by May. January to June it fell 36%.
Last half Apparel & Accessories averaged 4.11 and led the report outright. This half it’s 2.46, a 40% fall, just ahead of Software for the second-steepest of the fourteen. The decline didn’t start in January either. Across the twelve months we’ve now measured, Apparel & Accessories has not had a single month higher than the one before it.
Attention wasn’t the reason. Apparel & Accessories finished tenth on hook rate and seventh on click-through rate, and neither one collapsed, so people kept stopping and clicking at a steady rate while fewer of them bought.
The half-average is a moving target here in a way it isn’t for most of the table. Because the category fell every month, checking a June result against 2.46 measures it against a level Apparel & Accessories dropped below in April. Compare each month against the category’s same month instead.
Arts & Entertainment averaged 2.04, eighth of fourteen and just under the 2.17 cross-industry average. One month is the only reason it isn’t much lower.
Industry ROAS average
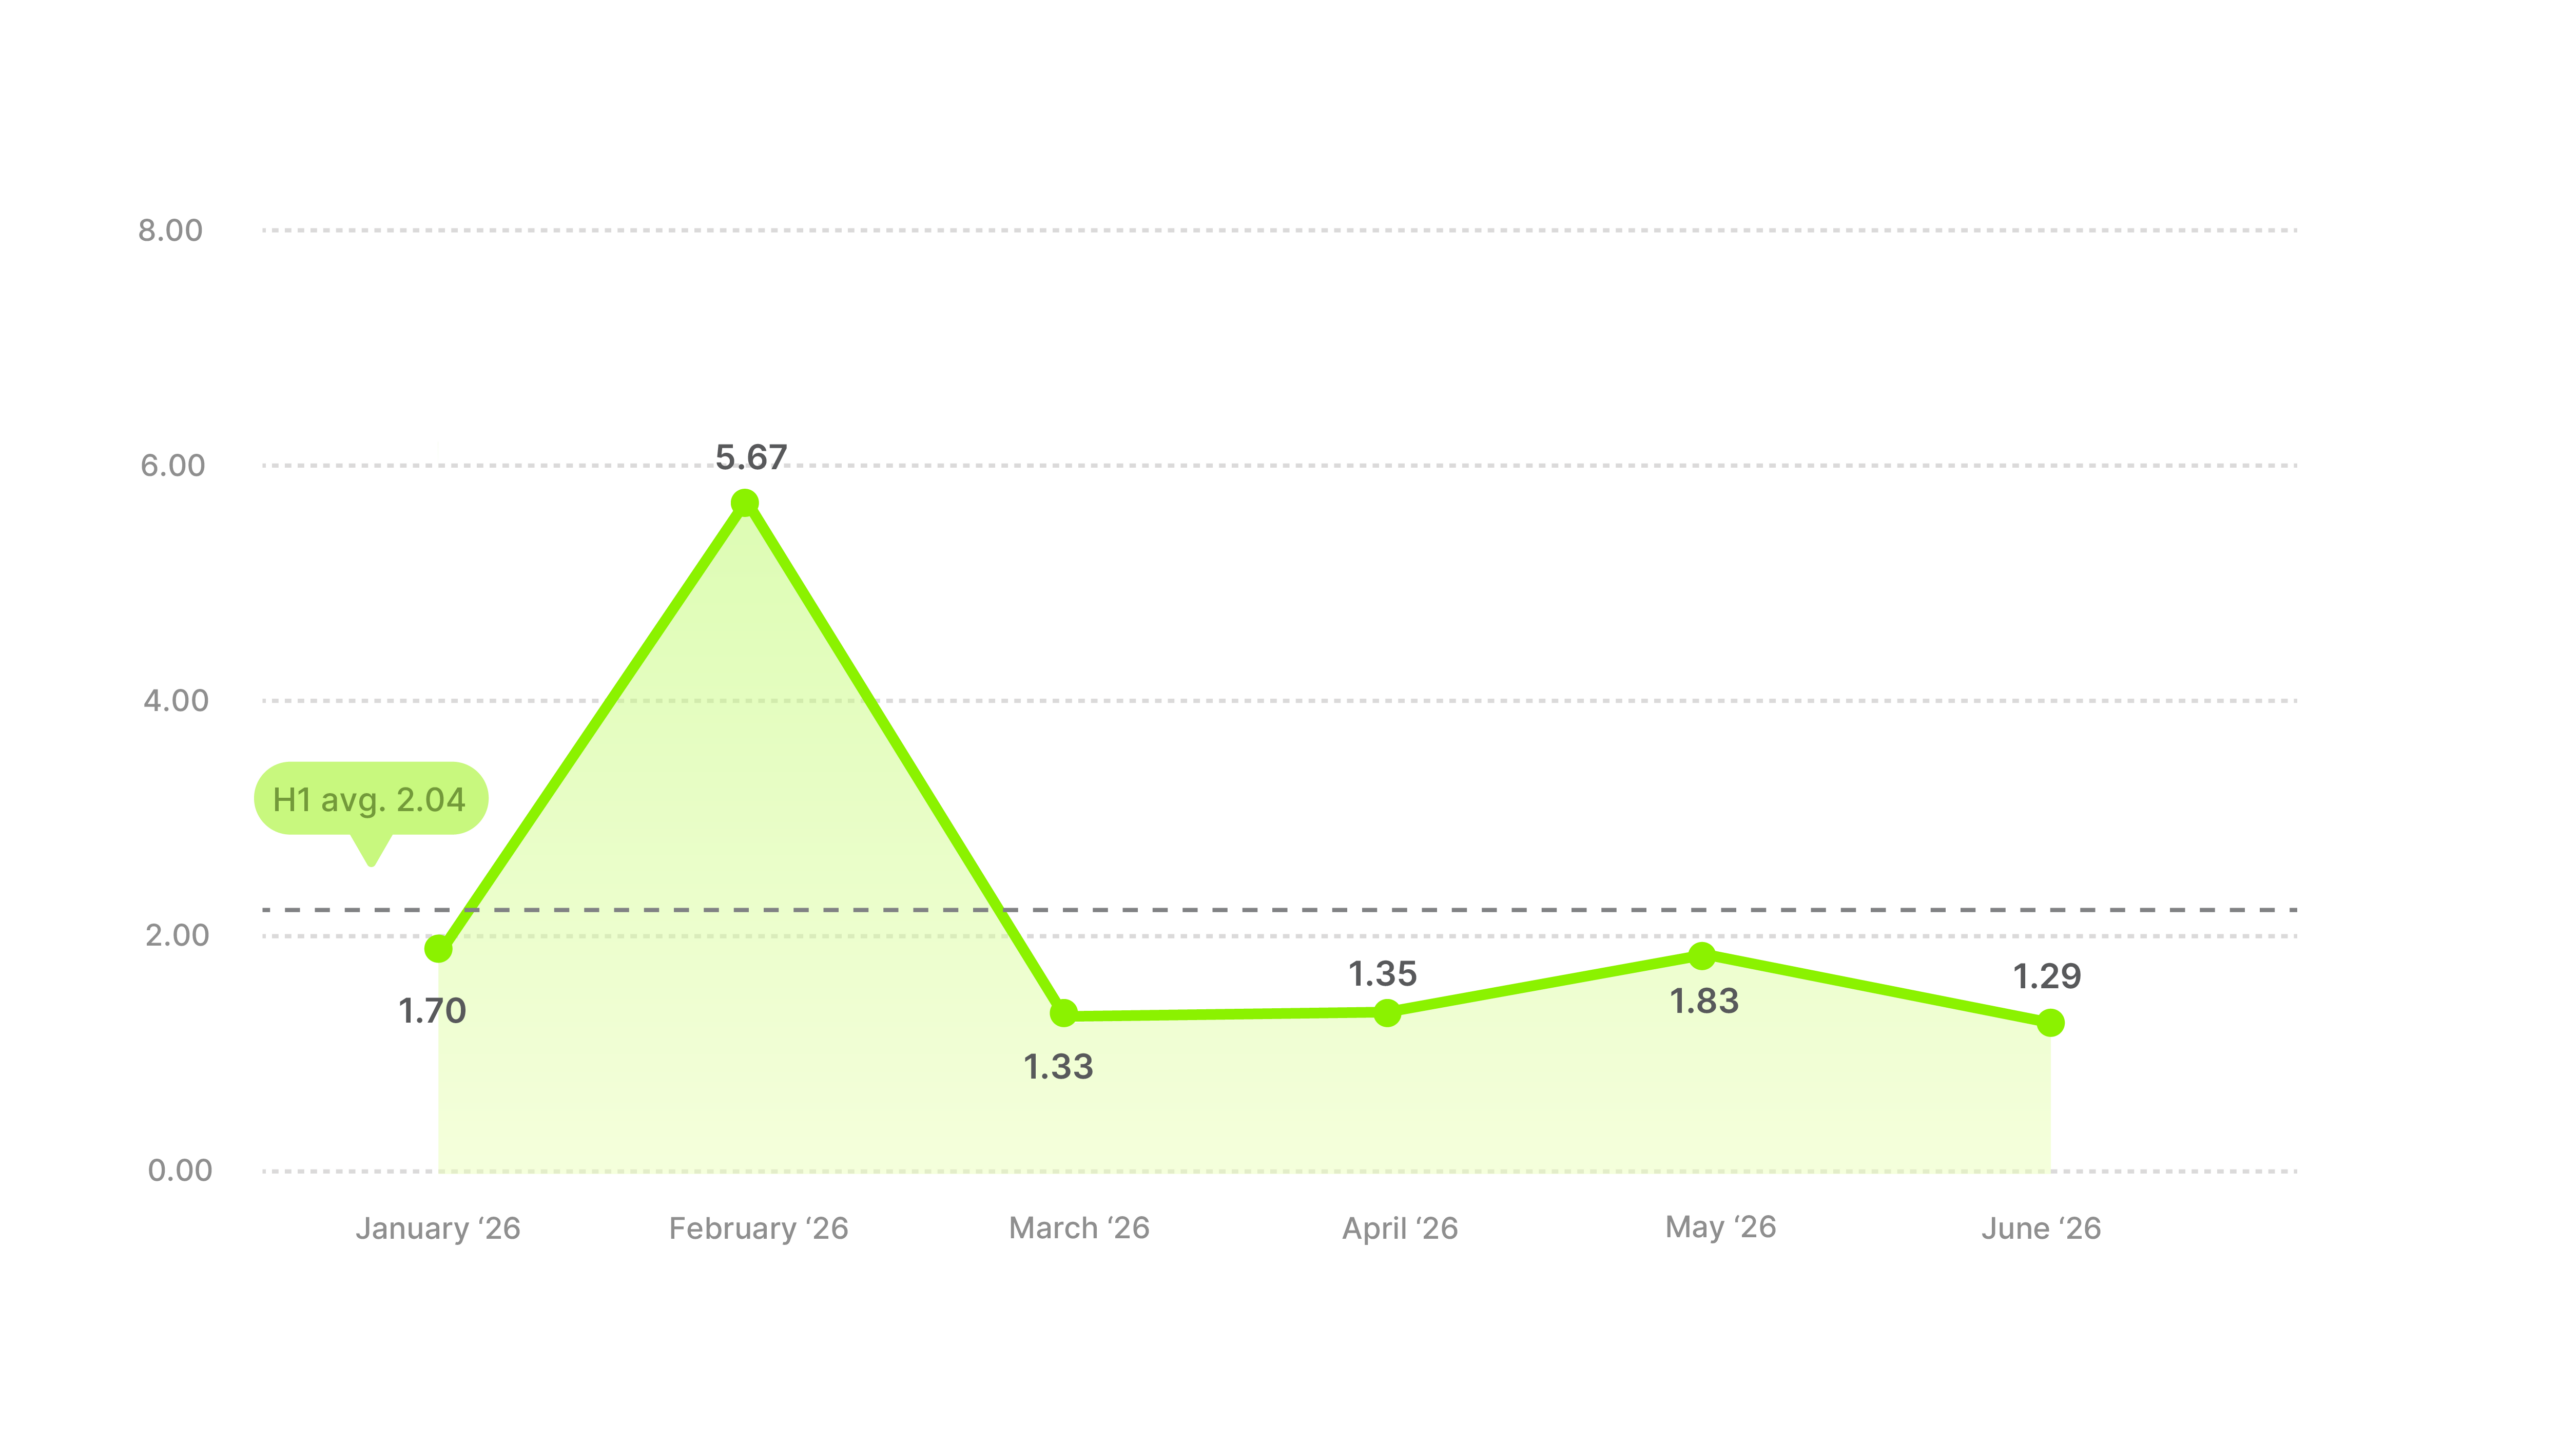
February reached 5.67, more than triple any other month in the category. The other five came in between 1.29 and 1.83, and taking February out drops the half-average to about 1.50.
Last half Arts & Entertainment averaged 2.23, so the category is down about 9%, and the gap between its best month and its worst was still the widest in the report.
This category works to the events calendar, and the returns go the other way. June was Arts & Entertainment’s best month for clicks and its worst for return at 1.29. February was its worst month for clicks and its best for return at 5.67.
No other category in the report flipped on both ends like that. Festivals, tours and live dates cluster from late spring onward, so the clicking climbs as the calendar fills up, and a lot of it is probably someone checking a lineup or a date rather than buying a ticket.
Across the half the category had the second-highest click-through rate of the fourteen at 2.15% and was mid-table on hook rate. People stopped and clicked at some of the best rates anywhere, and then didn’t buy.
Benchmark against 1.5 and treat February as something that happened rather than something to plan for. With clicks already among the best in the report, the work is on everything after them: an offer and a reason to book now will do more here than a better opening.
Baby & Toddler averaged 4.99, first of fourteen and more than double the 2.17 cross-industry average. Nothing else is close. Electronics is second at 3.44, a full 1.55 behind.
Industry ROAS average
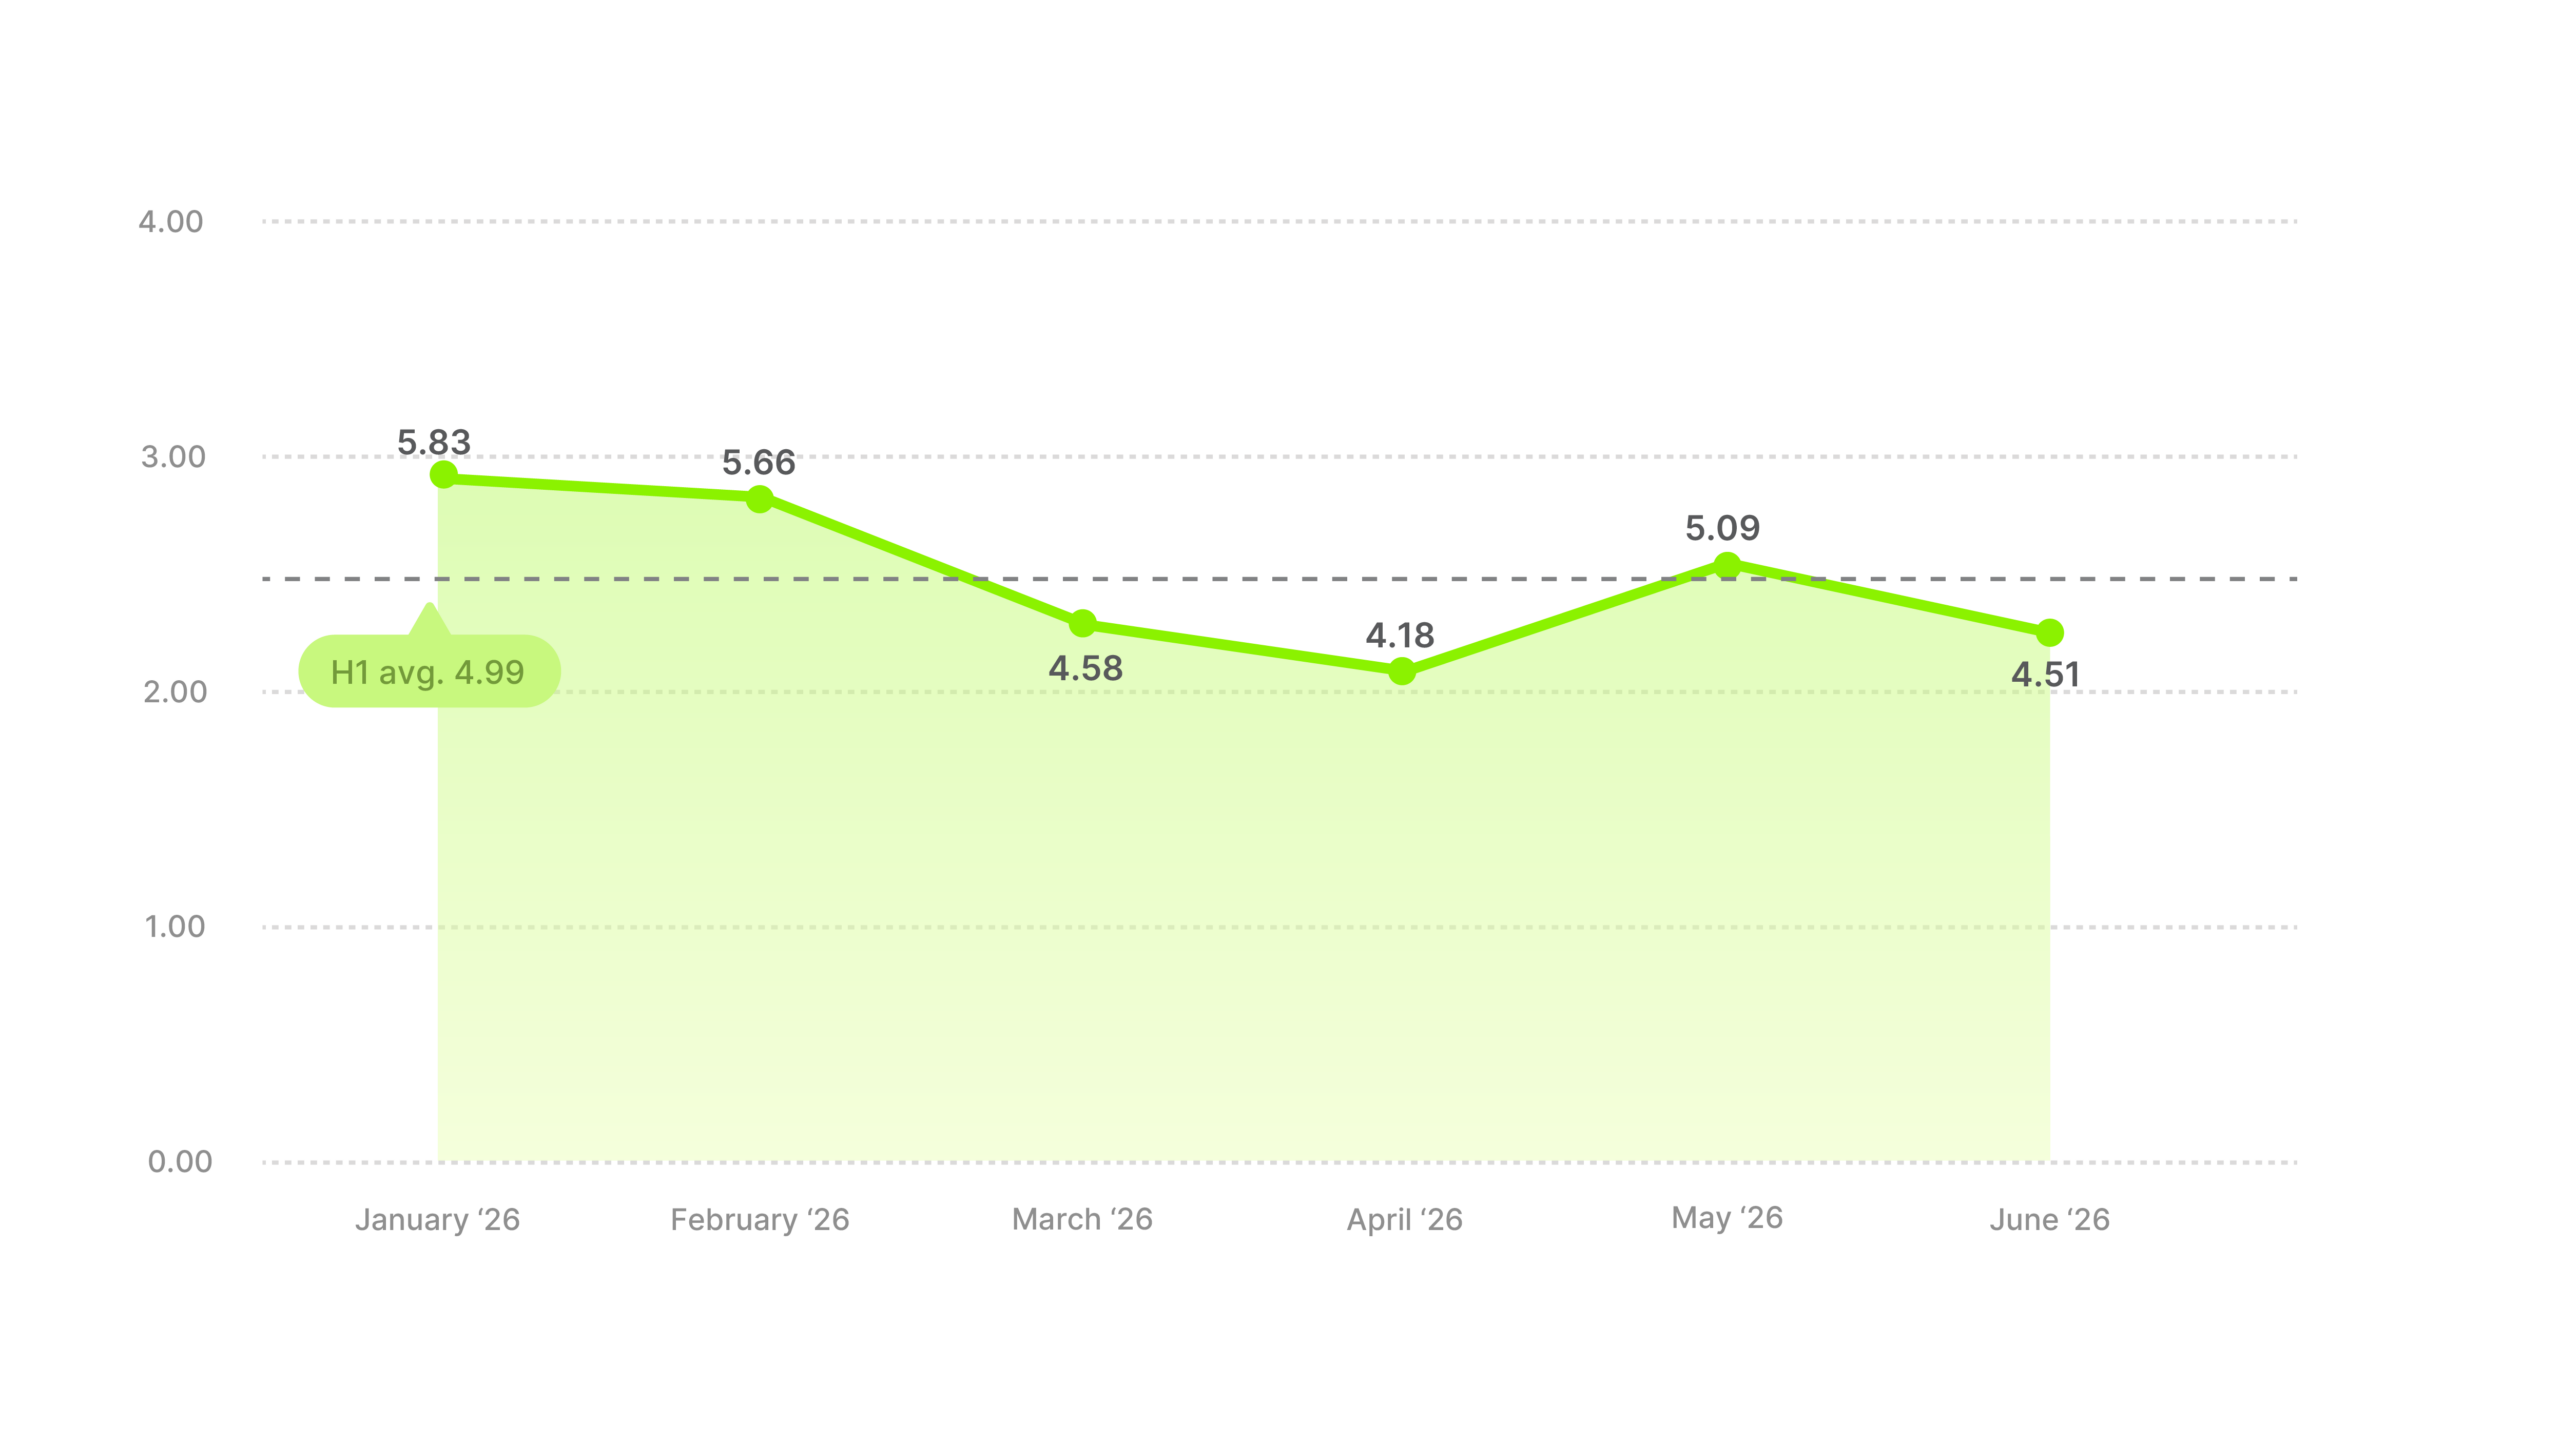
The months barely matter here. 5.83 in January, 5.66 in February, 4.58 in March, a low of 4.18 in April, 5.09 in May and 4.51 in June. There’s a shallow dip through the spring, and it doesn’t matter. Baby & Toddler’s weakest month of the half was higher than every other category’s half-average in the report.
Last half Baby & Toddler averaged 2.48, a little above the market. This half it doubled, the biggest rise of the fourteen.
Baby & Toddler had the lowest click-through rate of the fourteen at 1.37% and finished twelfth on hook rate, which is the opposite of what its ROAS would suggest. A baby-gear ad probably only reaches people who actually have a baby, which would mean fewer stops and fewer clicks, and a much higher share of those clicks turning into purchases.
To keep a number this far ahead of the market, judge Baby & Toddler creative on purchases and stop judging it on hook rate. Chasing a higher hook rate here probably means chasing people who aren’t buyers. The ads that work here are clear about safety and quality. Answer the question a parent is going to ask anyway, in the ad, before they go looking for the answer somewhere else.
Business & Industrial averaged 1.84, tenth of fourteen and below the 2.17 cross-industry average. It held near 2.0 for four months and then dropped.
Industry ROAS average
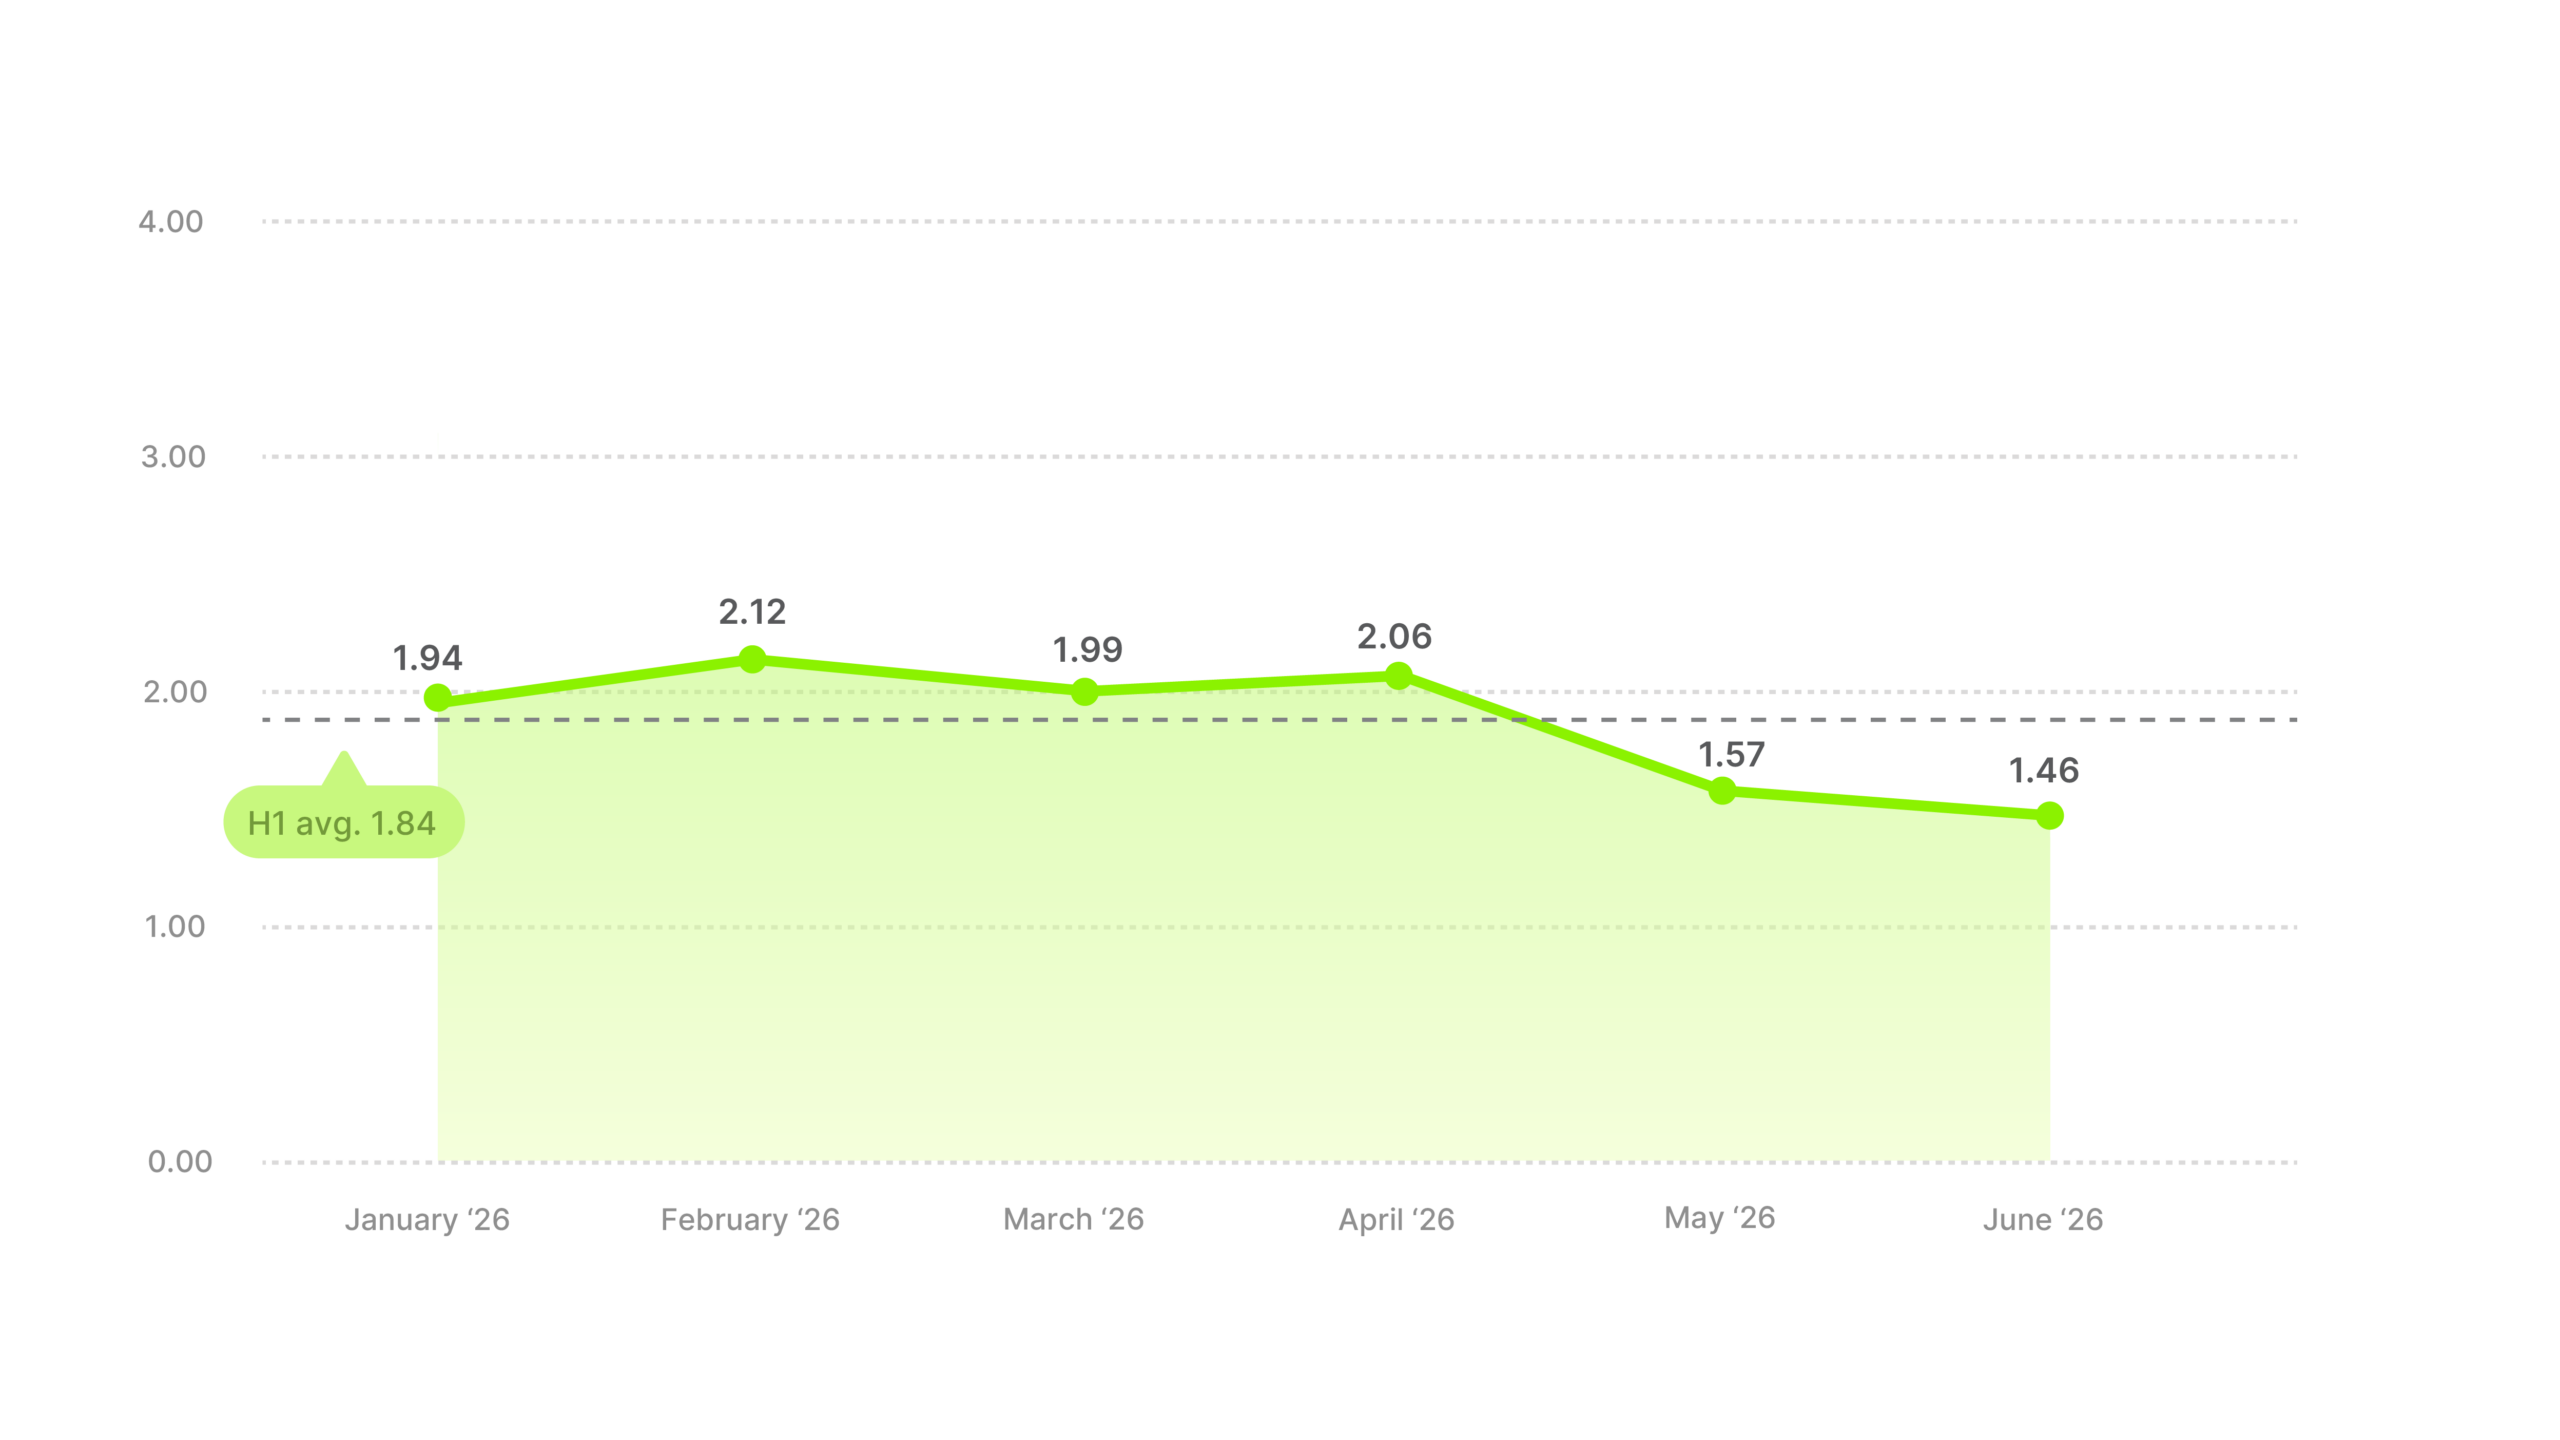
January opened at 1.94, February reached 2.12, and March and April came in at 1.99 and 2.06. Then May fell to 1.57 and June to 1.46, the weakest month of the half.
Last half Business & Industrial averaged 1.98 and finished December at 2.48, its best month. This half it finished June at its worst. Two halves ending in opposite places is a reason not to read either one as a calendar. This category sells to companies, and a company buys when a budget clears, which can happen in any month.
Business & Industrial is the only category in the report with a top-three hook rate and a bottom-three click-through rate. It was second of fourteen on hook rate at 28.74%, twelfth on click-through and tenth here. A general opening is stopping a very large audience, and business buyers are a small part of it, so the clicks and the purchases never come.
Narrowing who the opening reaches is the change worth making. Name the role, the industry and the use case in the ad so the people who will never buy keep scrolling, and accept a lower hook rate for a better-matched audience. Benchmark to about 1.8, and stay live across the half instead of picking months, because nothing in the two halves we’ve measured says which ones will pay.
Electronics was the second-best category in the report at 3.44, well clear of the 2.17 cross-industry average, and it earned most of that after March.
Industry ROAS average
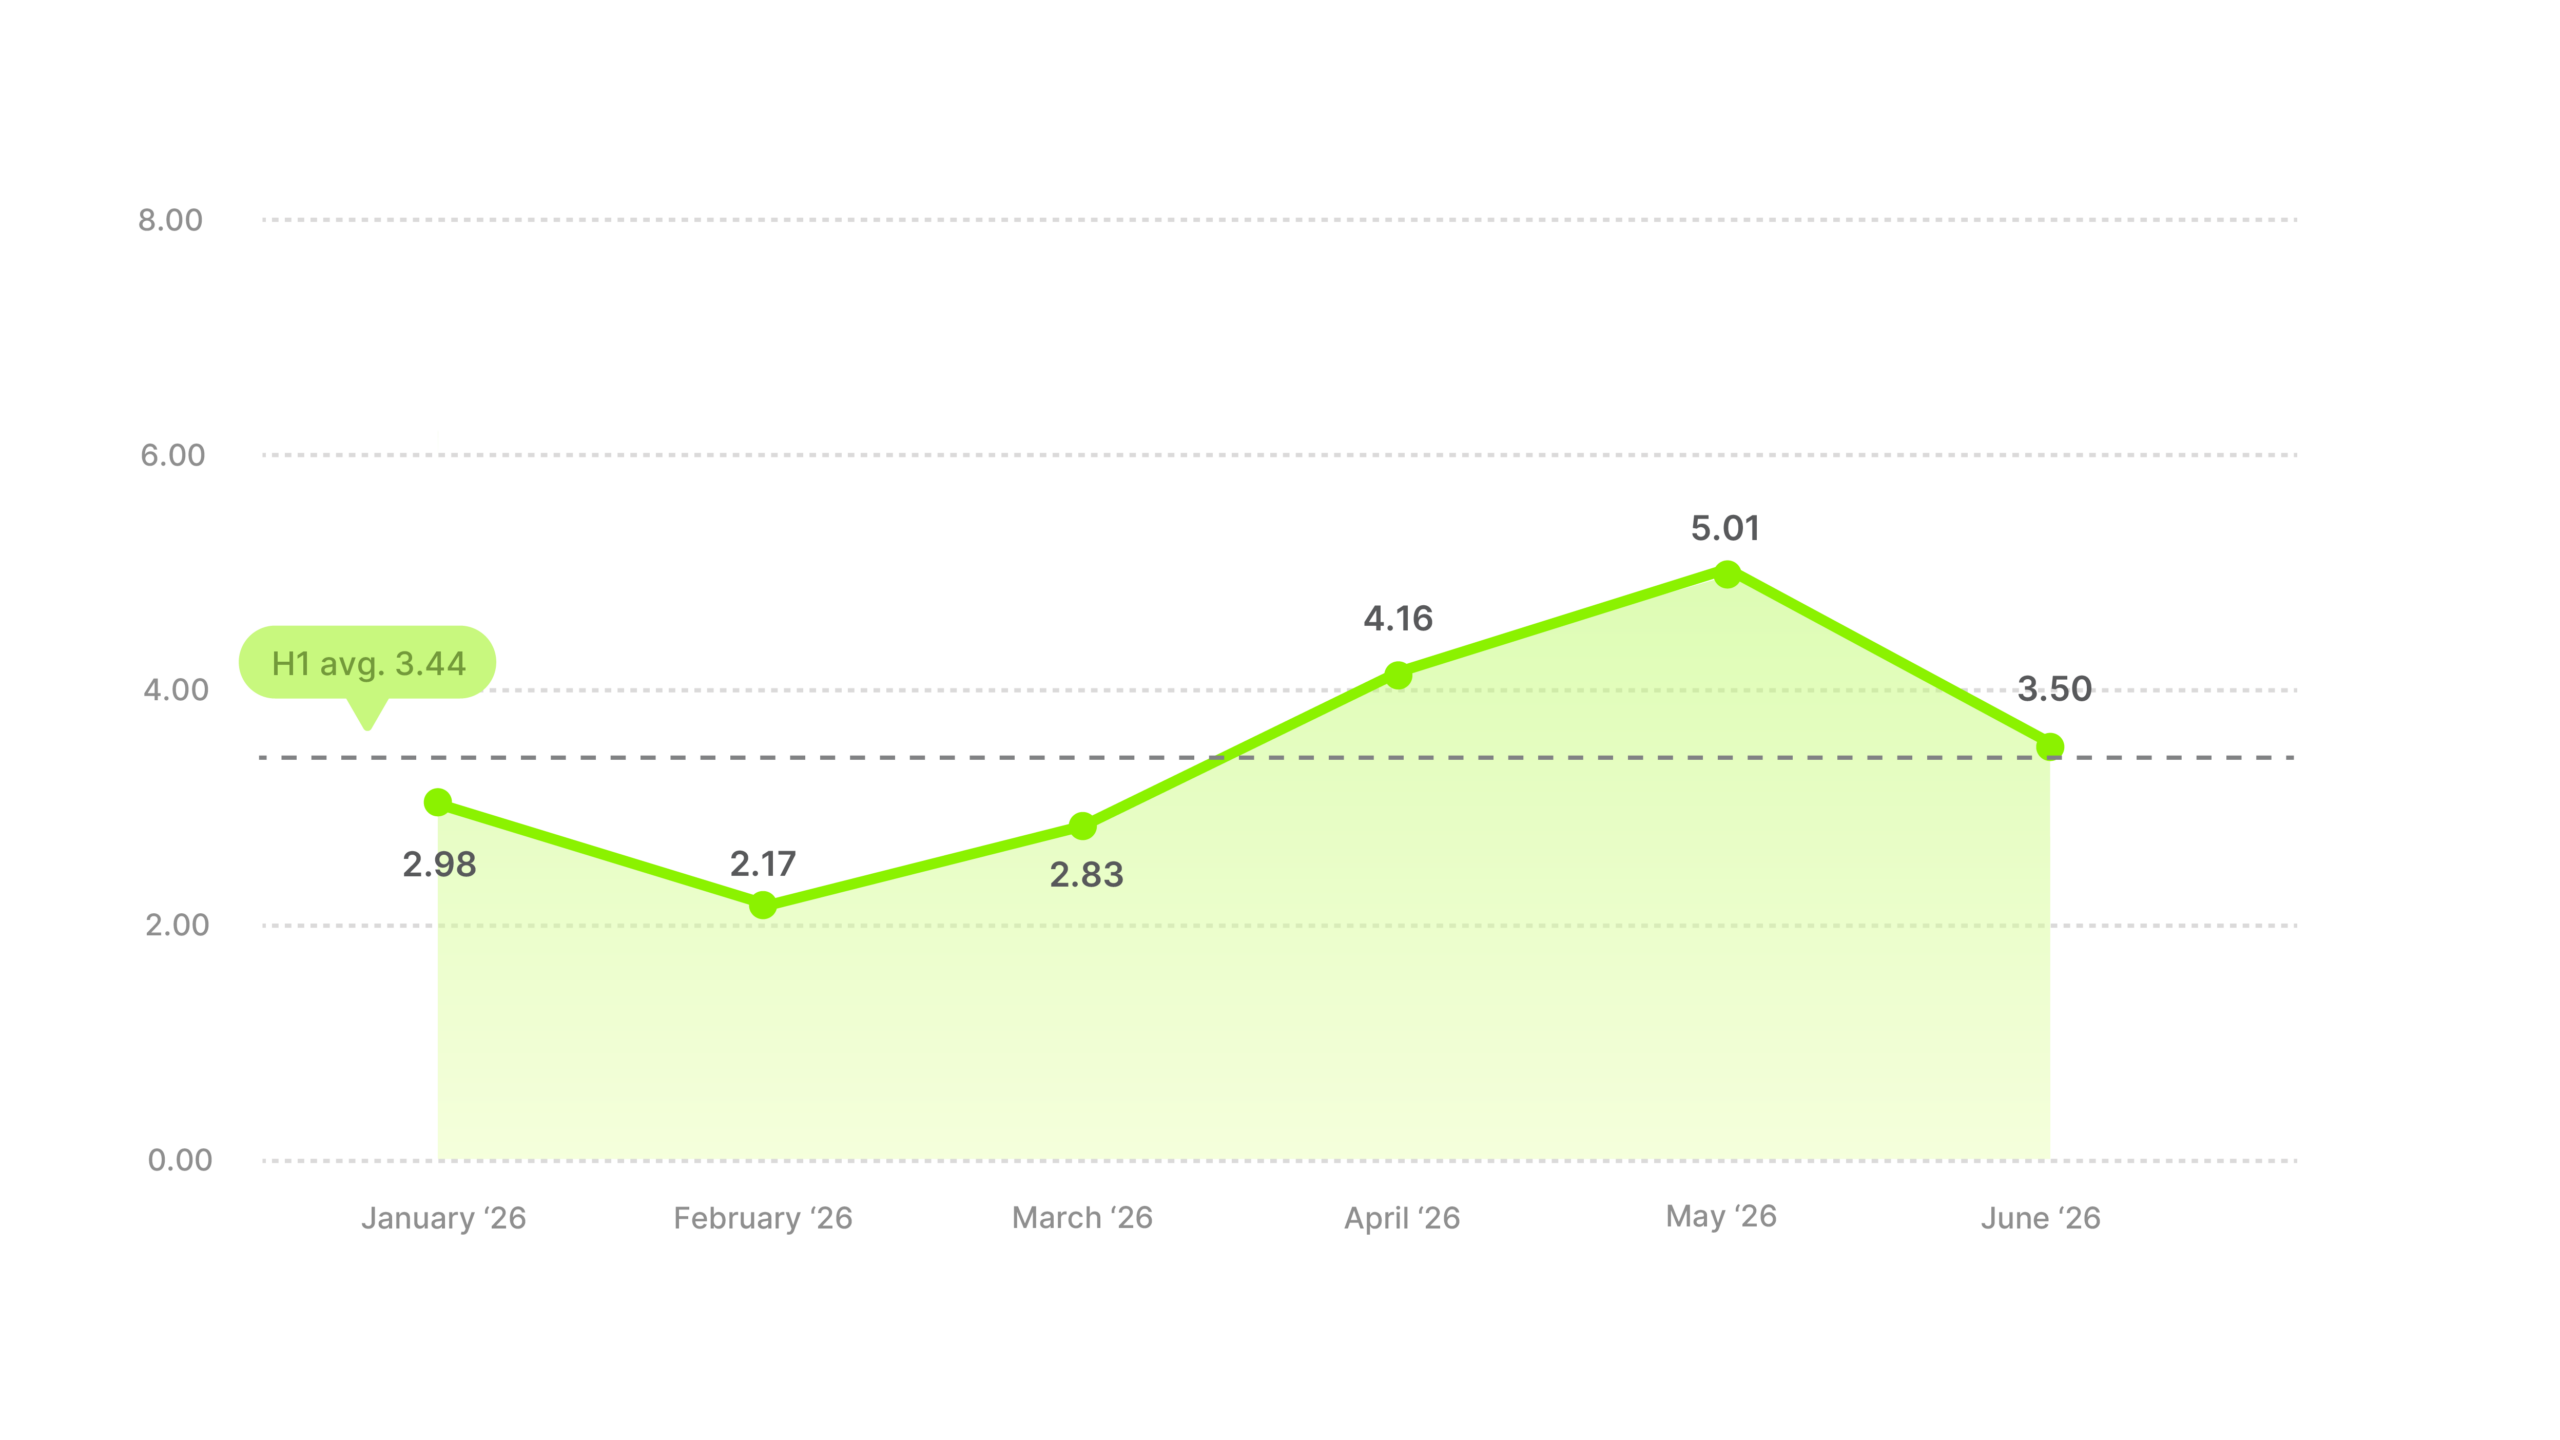
January to March and April to June look like different categories. January started at 2.98, February dropped to a low of 2.17, then March recovered to 2.83 before April reached 4.16 and May peaked at 5.01, with June easing to 3.50. The first three months averaged 2.66. The last three averaged 4.22.
Against 2.51 last half, that’s a 37% rise for Electronics, the second-biggest in the report.
Electronics does all of this with the second-lowest hook rate of the fourteen at 22.21% and a mid-table click-through rate. So the opening seconds aren’t the reason this category makes money, which is worth knowing before anyone spends a quarter trying to fix them.
To keep the spring level going, put what a researcher actually wants inside the ad. Specs, the real price and reviews from people who already bought, or even a strong offer do more here than a bold opening. April and May are where Electronics has the most room to scale.
Food & Beverages averaged 2.51, fourth of fourteen and above the 2.17 cross-industry average. Four of the six months were above the market and the last two were below it.
January opened at 2.44 and February peaked at 3.02. March and April held at 2.72 and 2.74, then May fell to 2.08 and June to 1.75, the weakest month of the half.
Against 2.57 last half, that’s flat, down about 2%.
Industry ROAS average
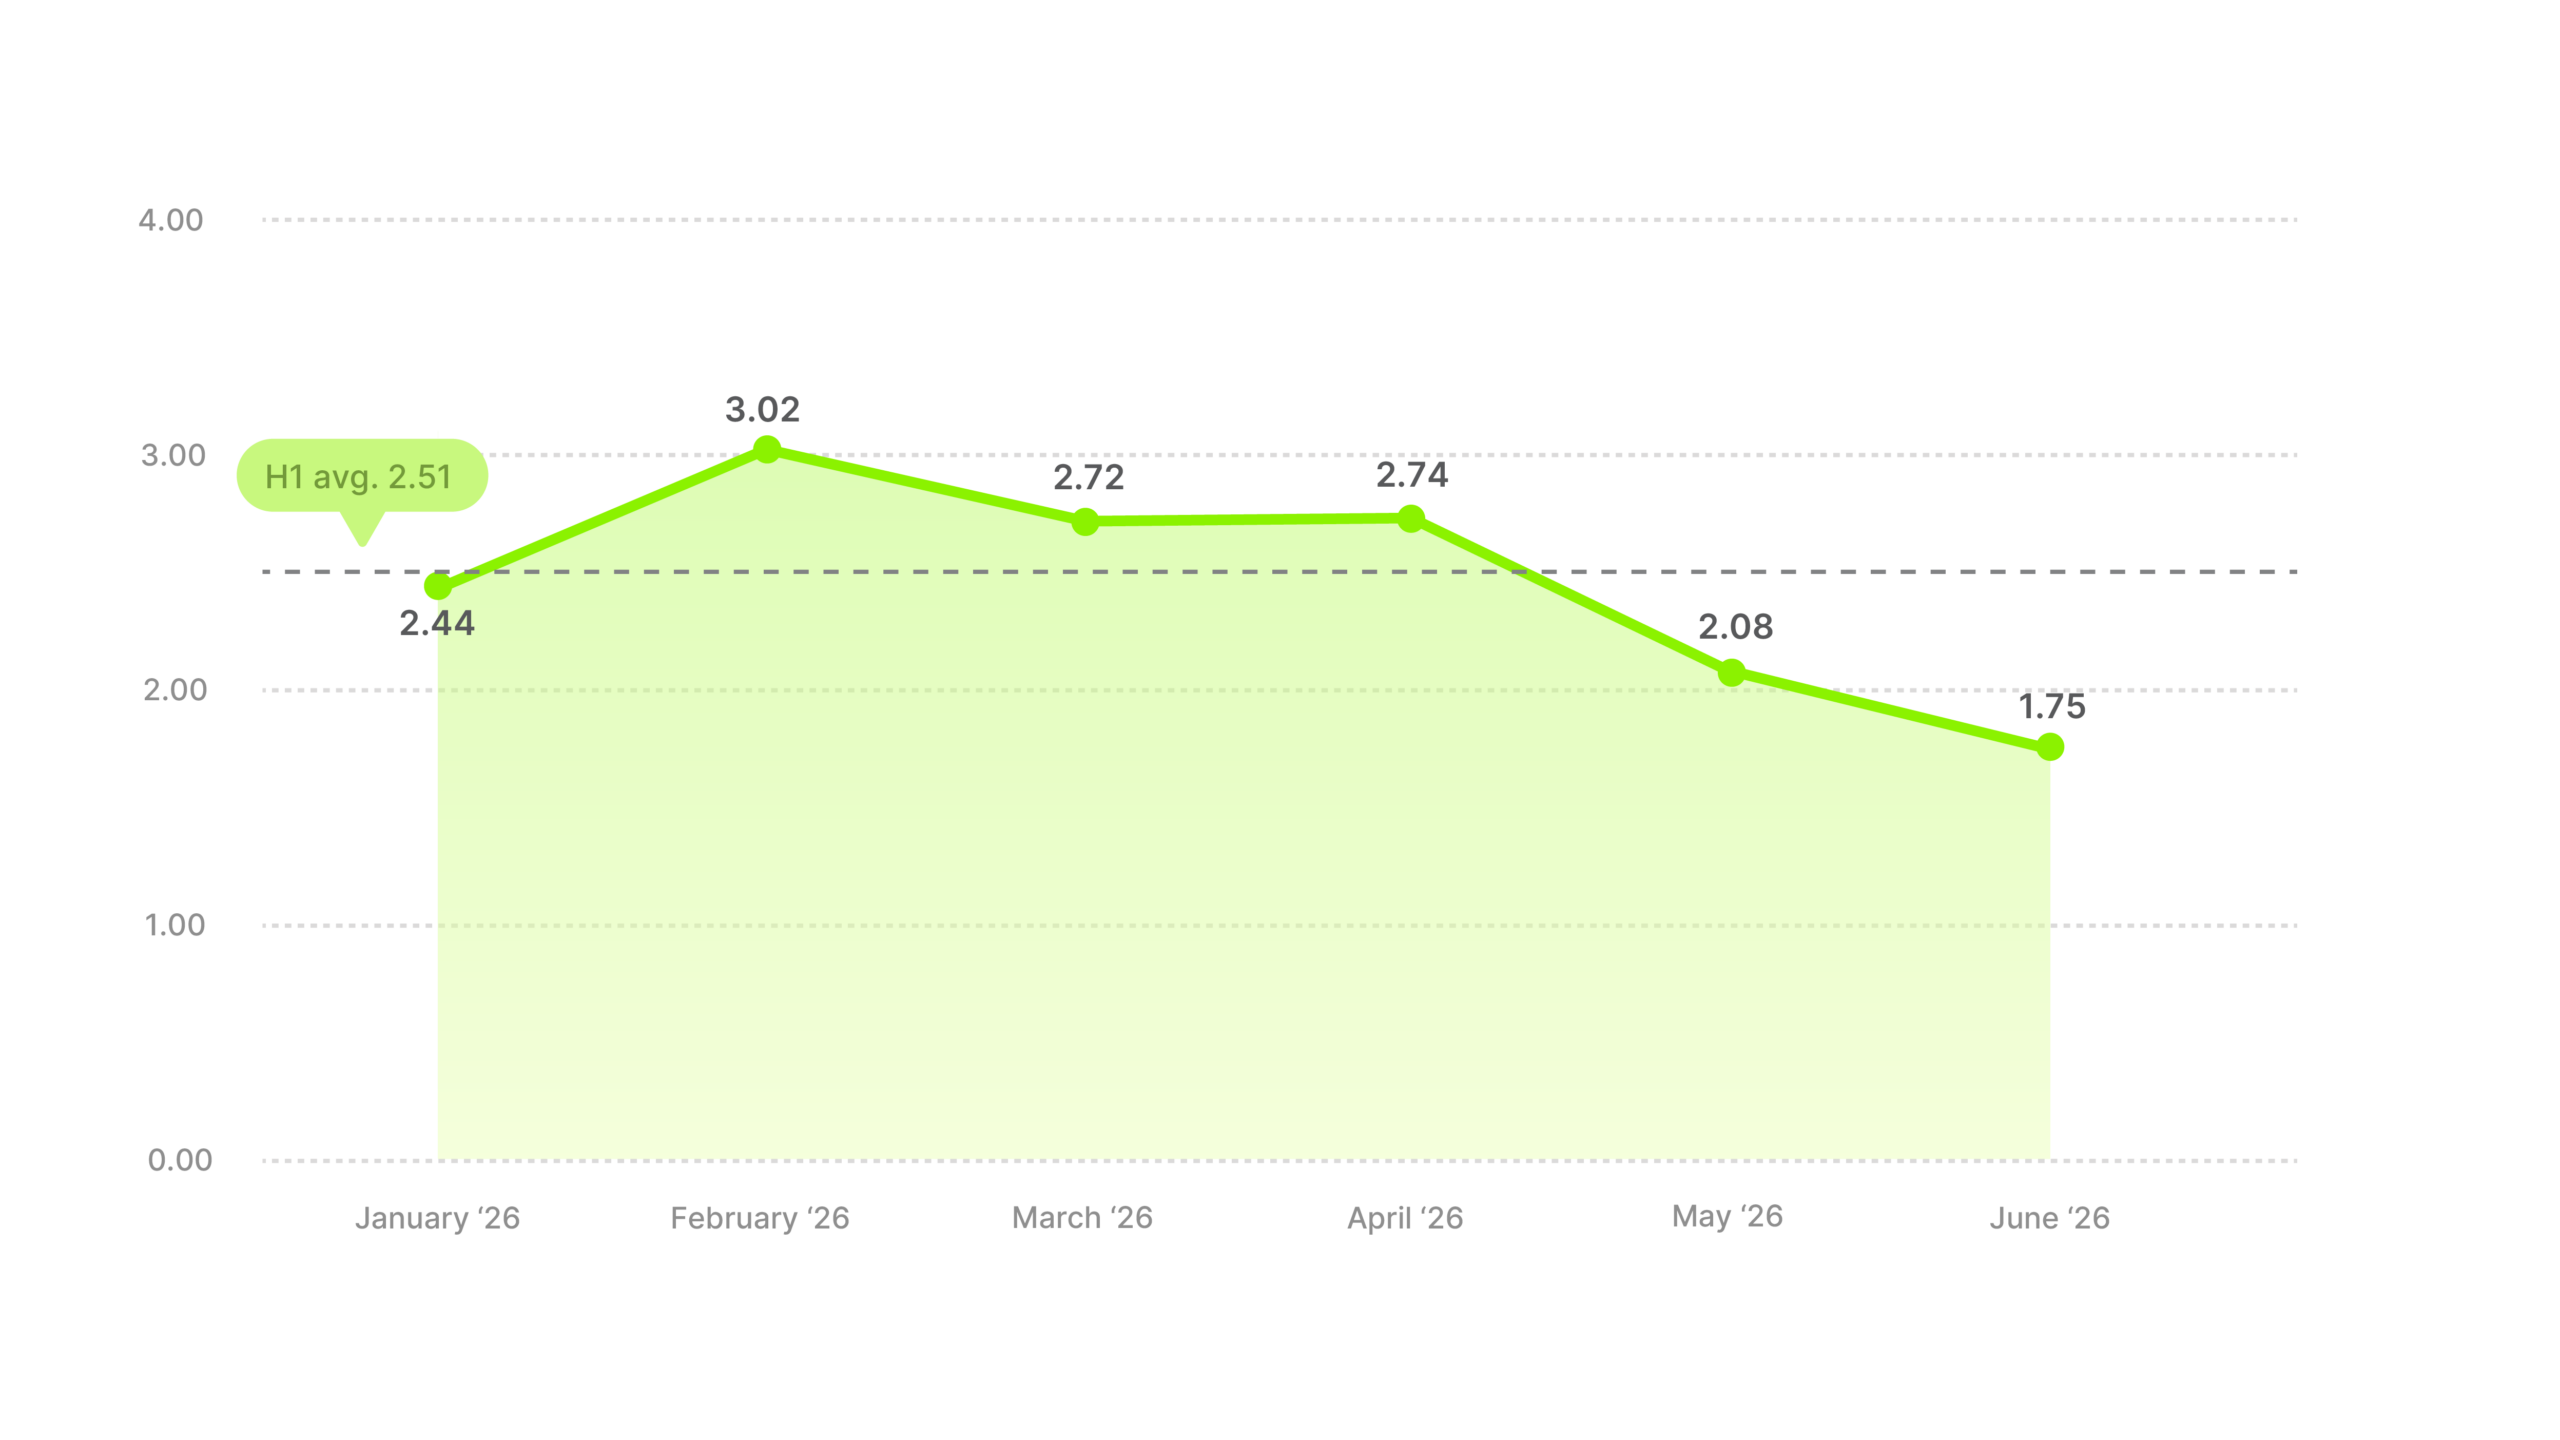
Food and drink look good on camera and there are countless angles you can try out, which is why this category holds a high hook rate all half without needing an occasion to sell into. Buying is a different matter. February was 42% above June, so the category keeps earning attention right through the half and only converts it early.
Food & Beverages ranked fifth on hook rate, fifth on click-through rate and fourth here, so no single stage of the funnel is holding it back.
January and February are when the money is there, so run the health and diet message then, while people are still acting on their new-year plans.
The 2.51 half-average is weighted by that strong start. May came in at 2.08 and June at 1.75, so compare a summer result to those months. Held against 2.51, a normal June looks like a failure.
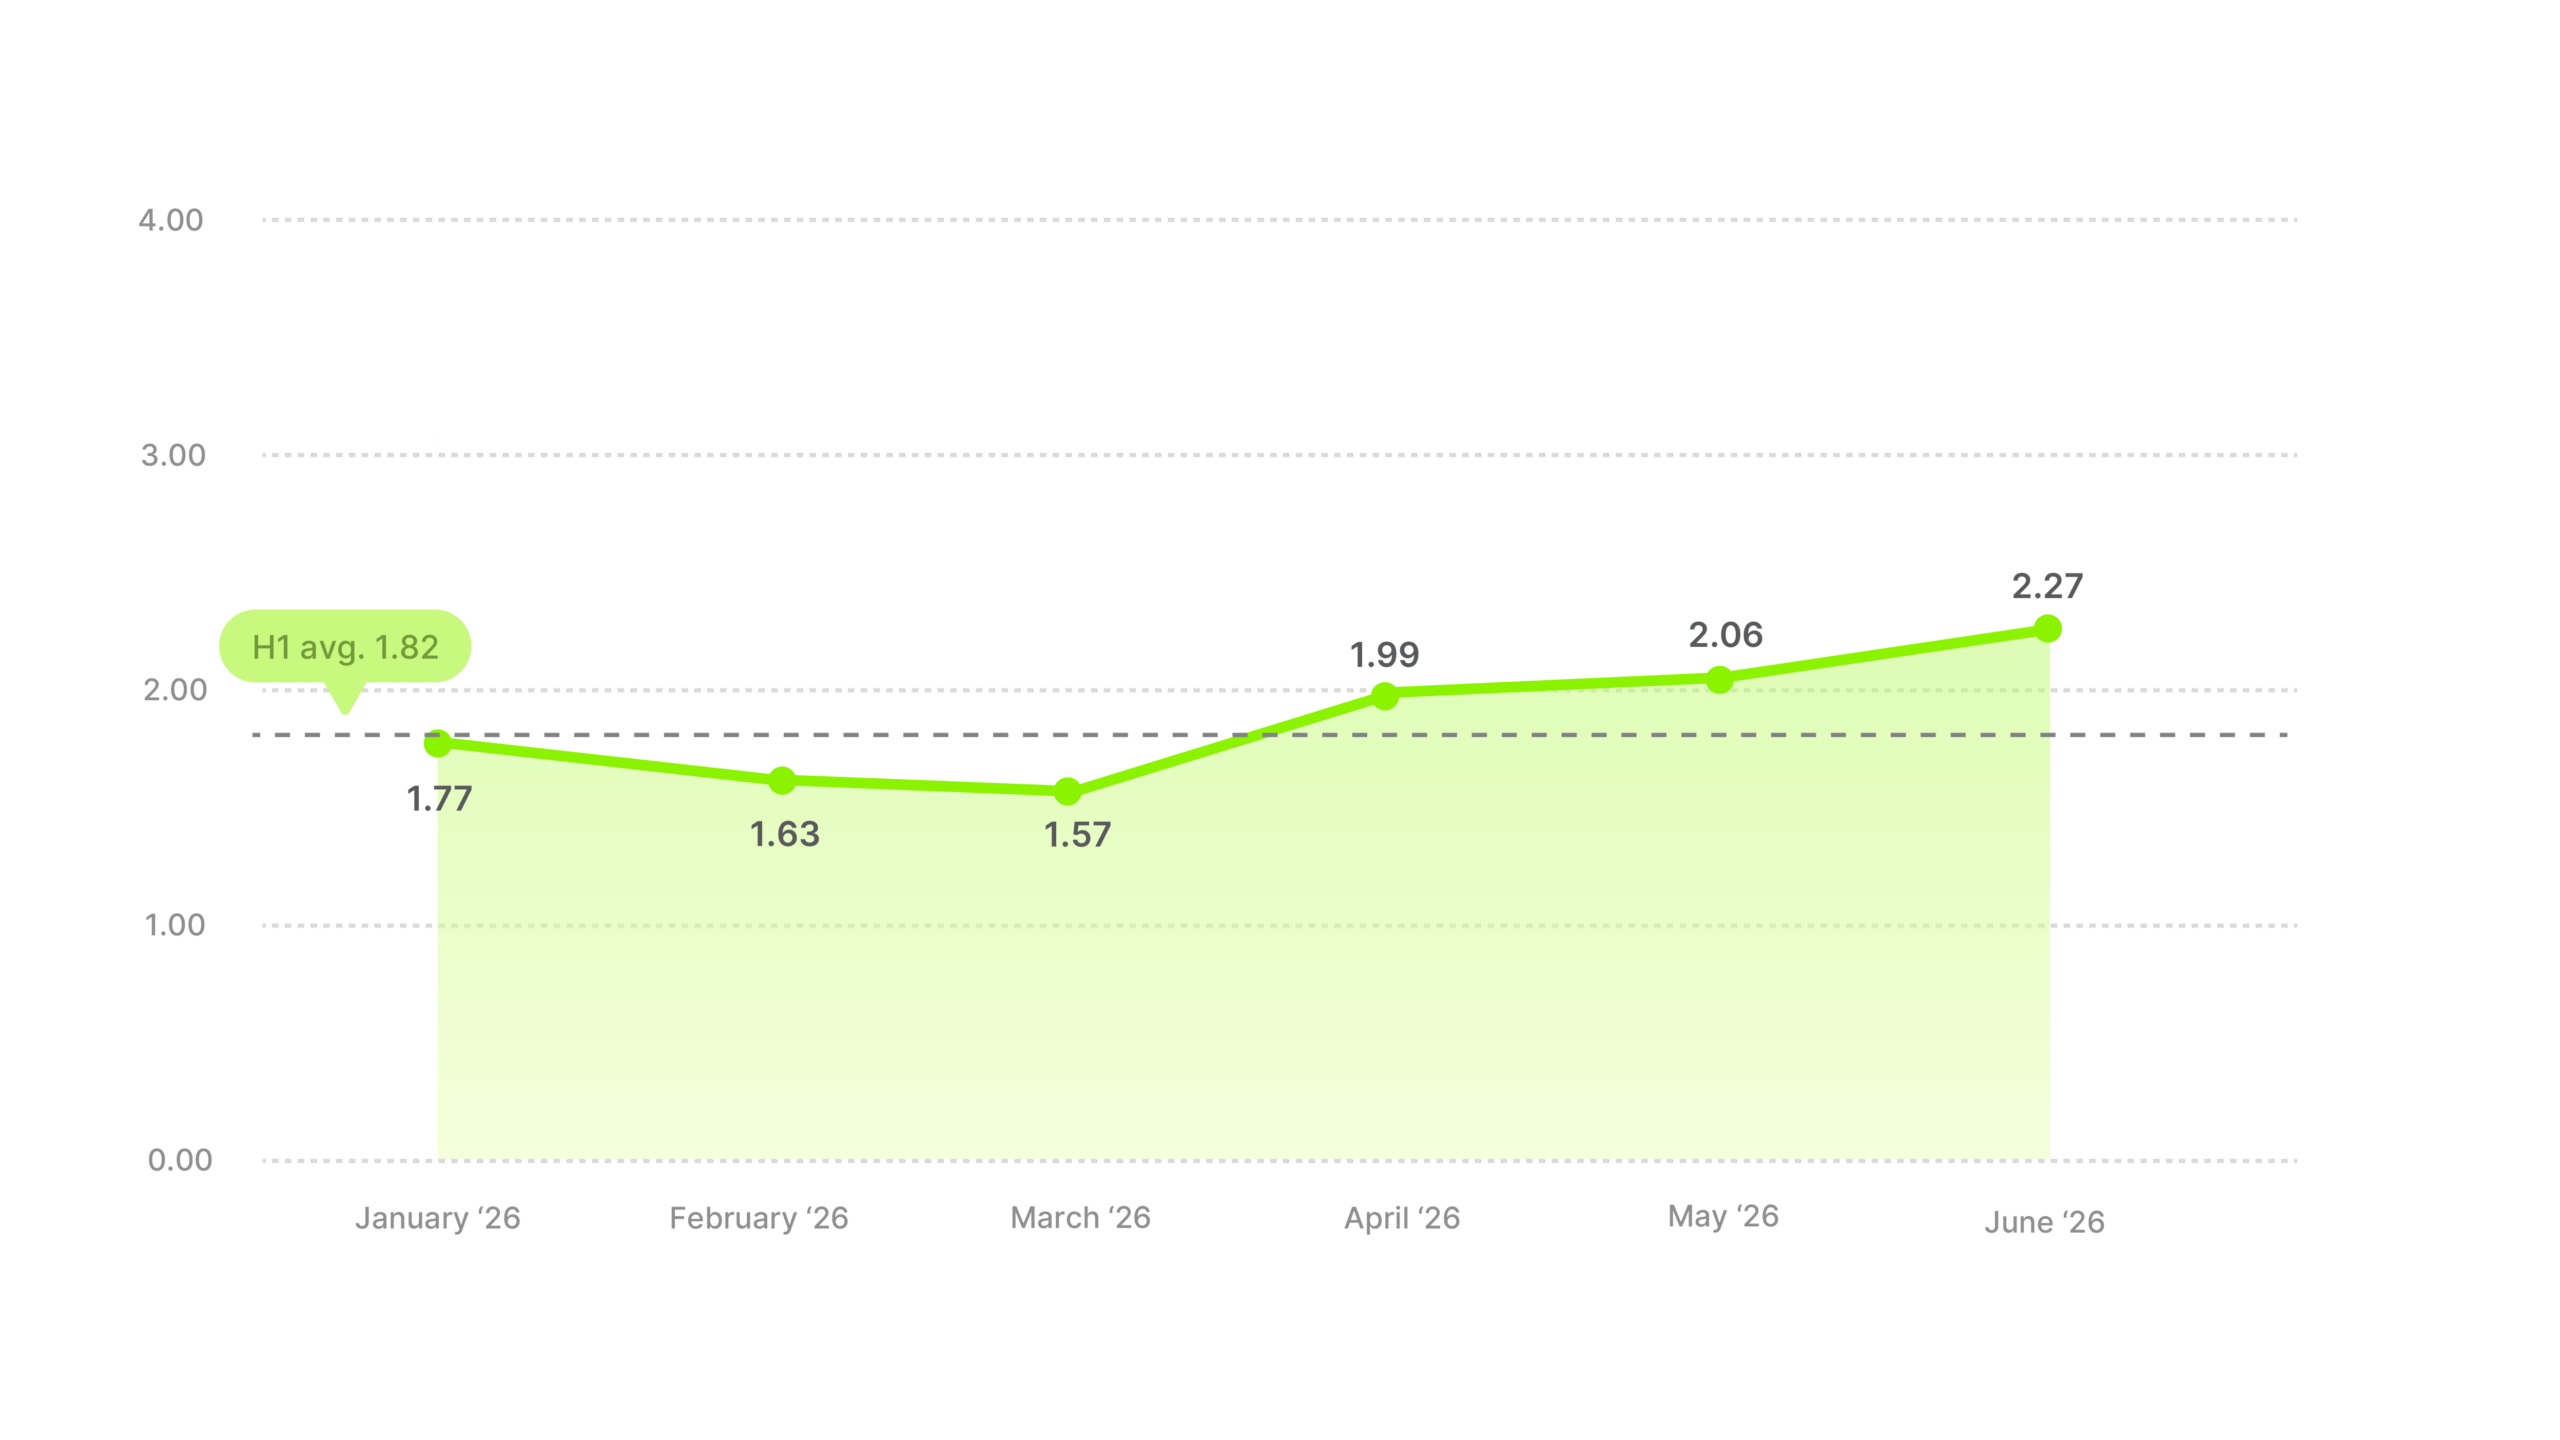
Health & Beauty finished the half a lot stronger than it started, and still came eleventh of fourteen at 1.82 against the 2.17 cross-industry average.
Health & Beauty fell for three months before it climbed. 1.77 in January, 1.63 in February, a low of 1.57 in March, then 1.99 in April, 2.06 in May and 2.27 in June. It finished on its strongest month, and even that one only just cleared the cross-industry line.
Against 2.12 last half, Health & Beauty is down 14%.
Industry ROAS average
Health & Beauty had the best click-through rate of the fourteen at 2.36% and the third-best hook rate at 28.11%, and it finished eleventh on ROAS. No category worked harder for the click, and ten of them did more with the ones they got. Between the halves Health & Beauty got better at the click and worse at the sale.
The click is already won here, so there’s work to do on both sides of it. After it, reviews, credible before-and-afters, a reason the price is what it is and a bundle that makes the basket bigger all work on the part that’s losing people.
Before it, the test worth running is a narrower ad. A broad beauty message pulls clicks from everyone, while one built around a single specific problem pulls fewer people who are more likely to have it. Expect the hook rate to fall.
Home & Garden averaged 2.83, third of fourteen and comfortably above the 2.17 cross-industry average. It finished third last half too.
Industry ROAS average
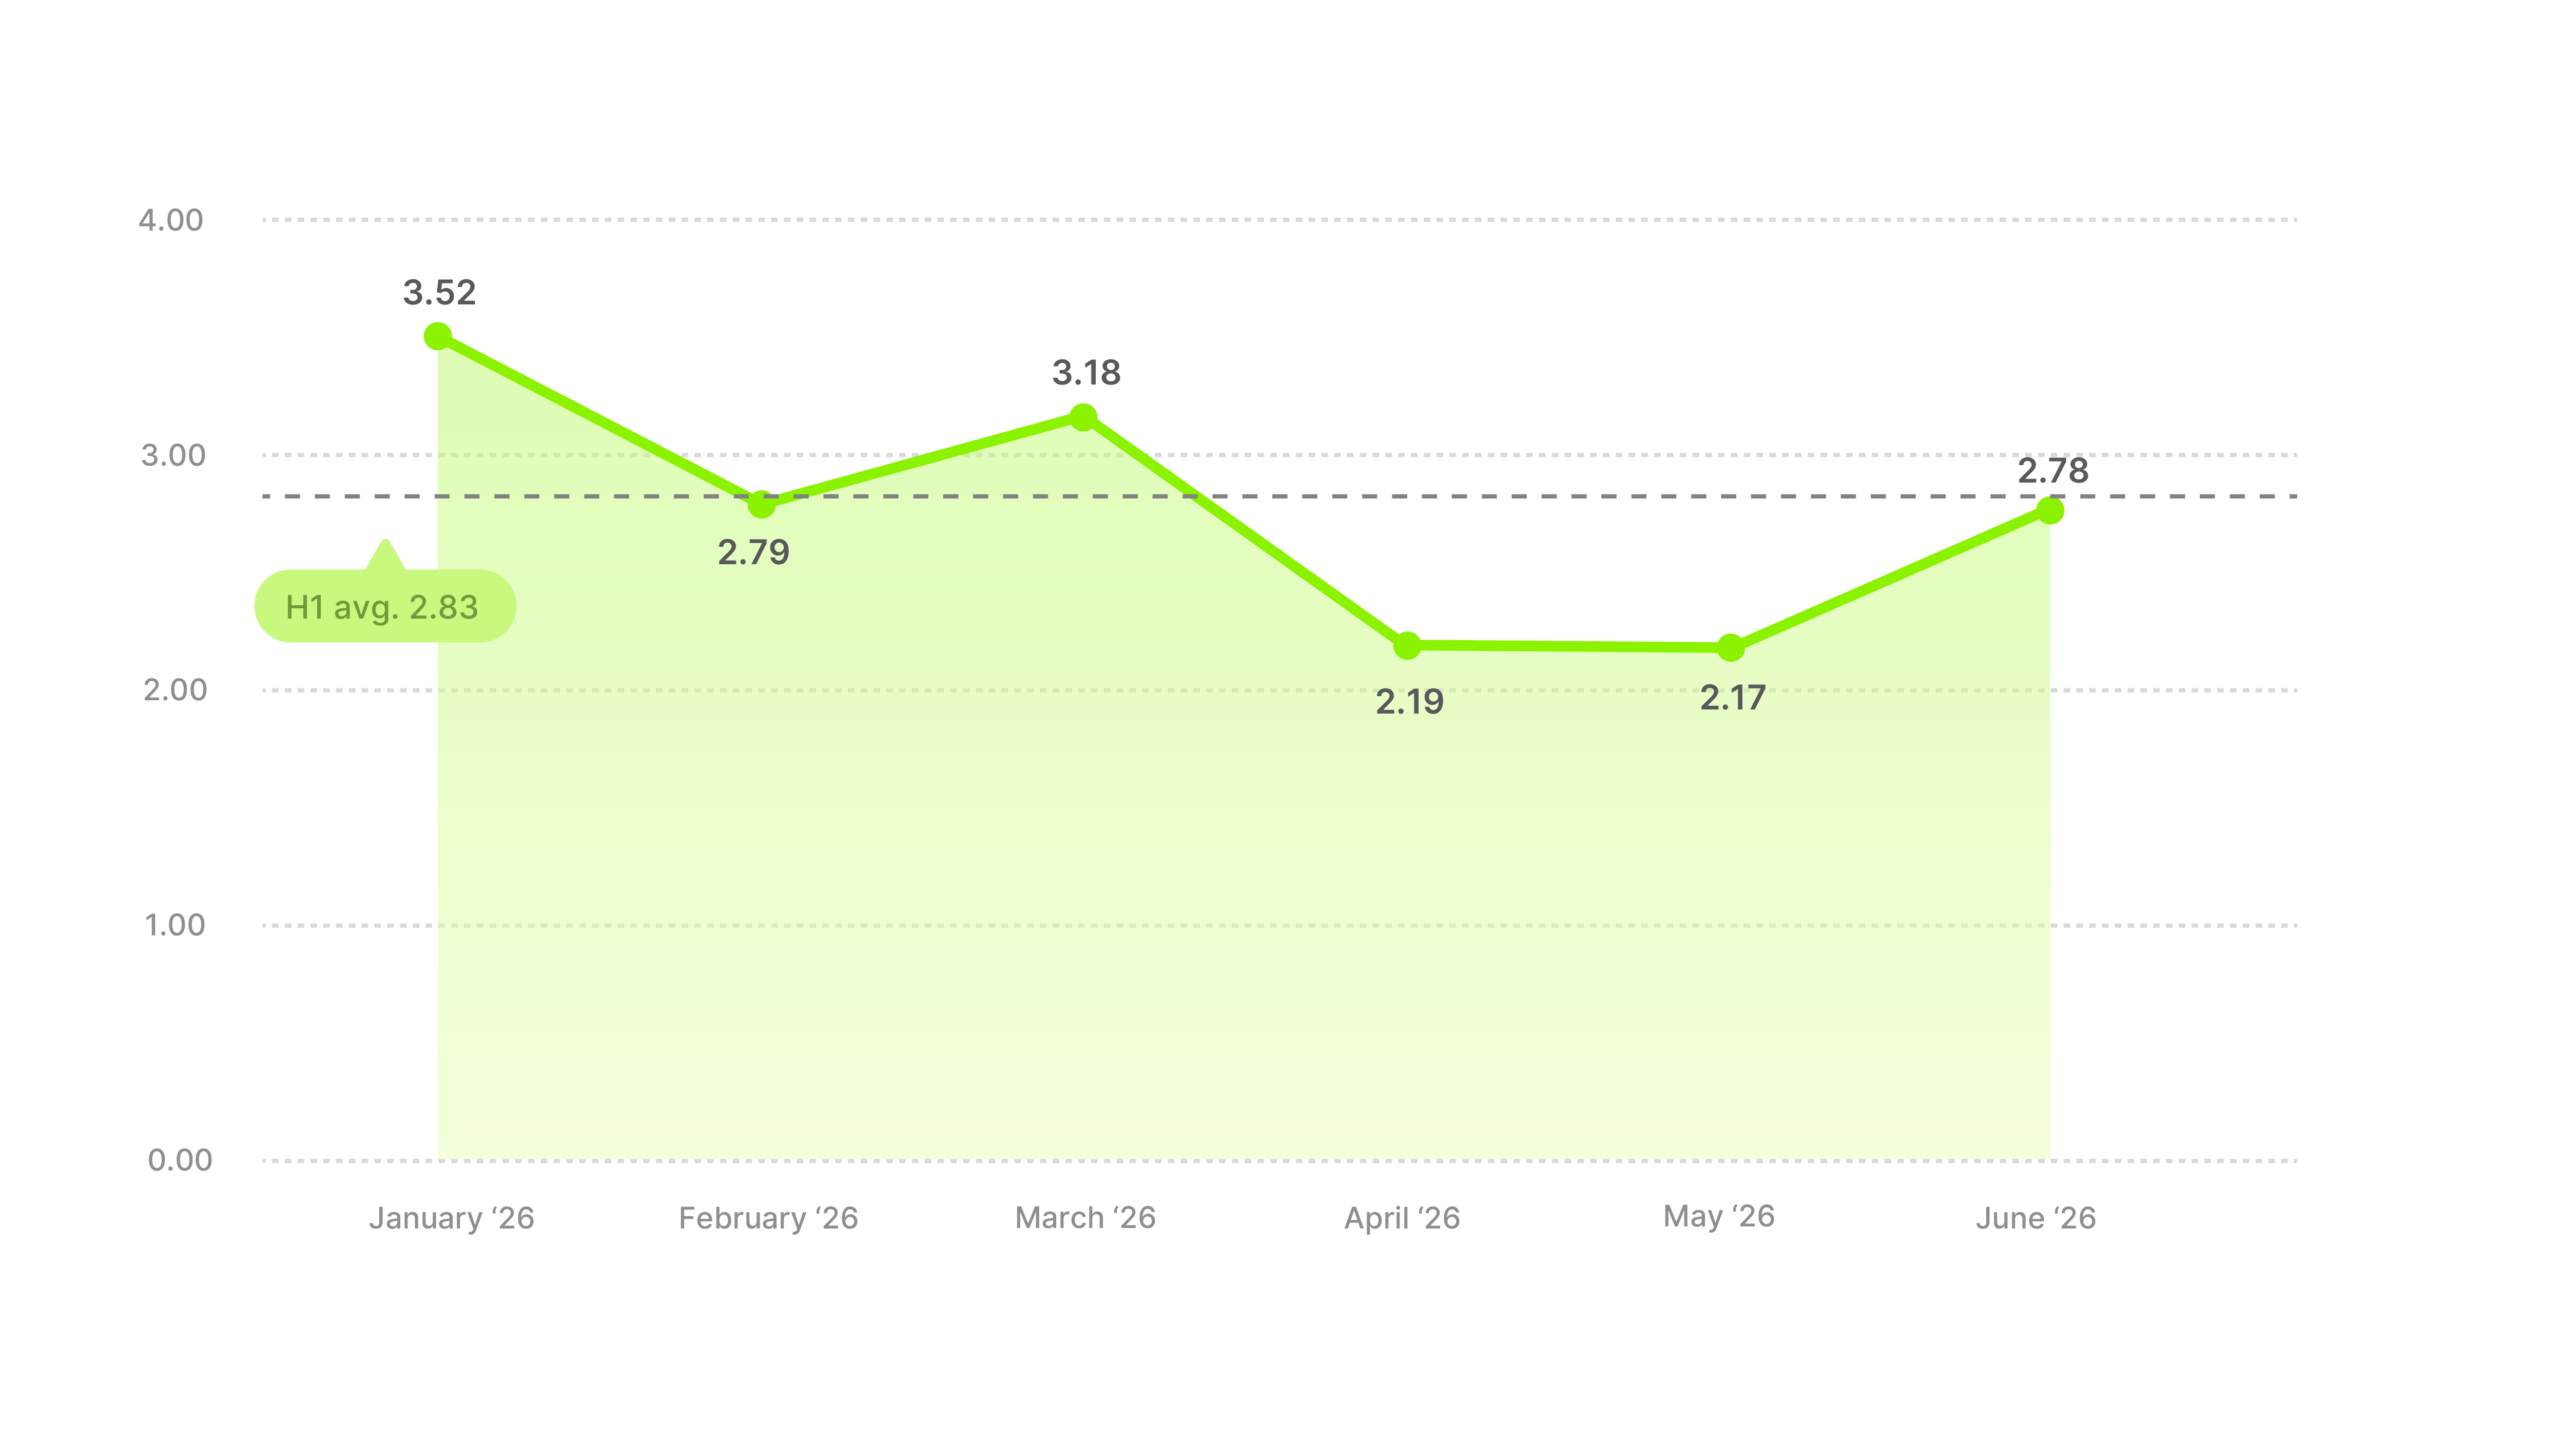
January opened strongest at 3.52 and March reached 3.18. April and May were the weakest pair at 2.19 and 2.17, and February and June came in close to the half-average. At 2.83 that average is well under the strong months and well over the weak ones, so it describes the category better than it describes any month in it.
Last half Home & Garden averaged 3.43, so the category is down 17% while holding the same position in the table.
Breadth is part of why the months move the way they do. Home & Garden covers decor, furniture, tools and gardening, and each of those has its own season, so the months pull against each other instead of adding up to one direction.
Home & Garden is one of only three categories where every stage of the funnel is working. It ranked sixth on hook rate, third on click-through rate and third here, so the strong return has a strong click behind it. People come to this category already wanting the thing, which is why the click arrives even when the opening is only average.
Plan against the level and not the month. Home & Garden has finished third in both halves we’ve measured and its best month moved from July to January between them, so the position is dependable and the timing isn’t.
Benchmark to about 2.8 and treat a weak April as normal. Nothing in this funnel needs repairing, so testing here is about finding upside. The full makeover and the garden reveal are the obvious ones if you haven’t run them, and the new-year, new-home angle if you’re shooting for January.
Services averaged 2.27, seventh of fourteen and barely above the 2.17 cross-industry average. It’s the most ordinary category in the report.
Industry ROAS average
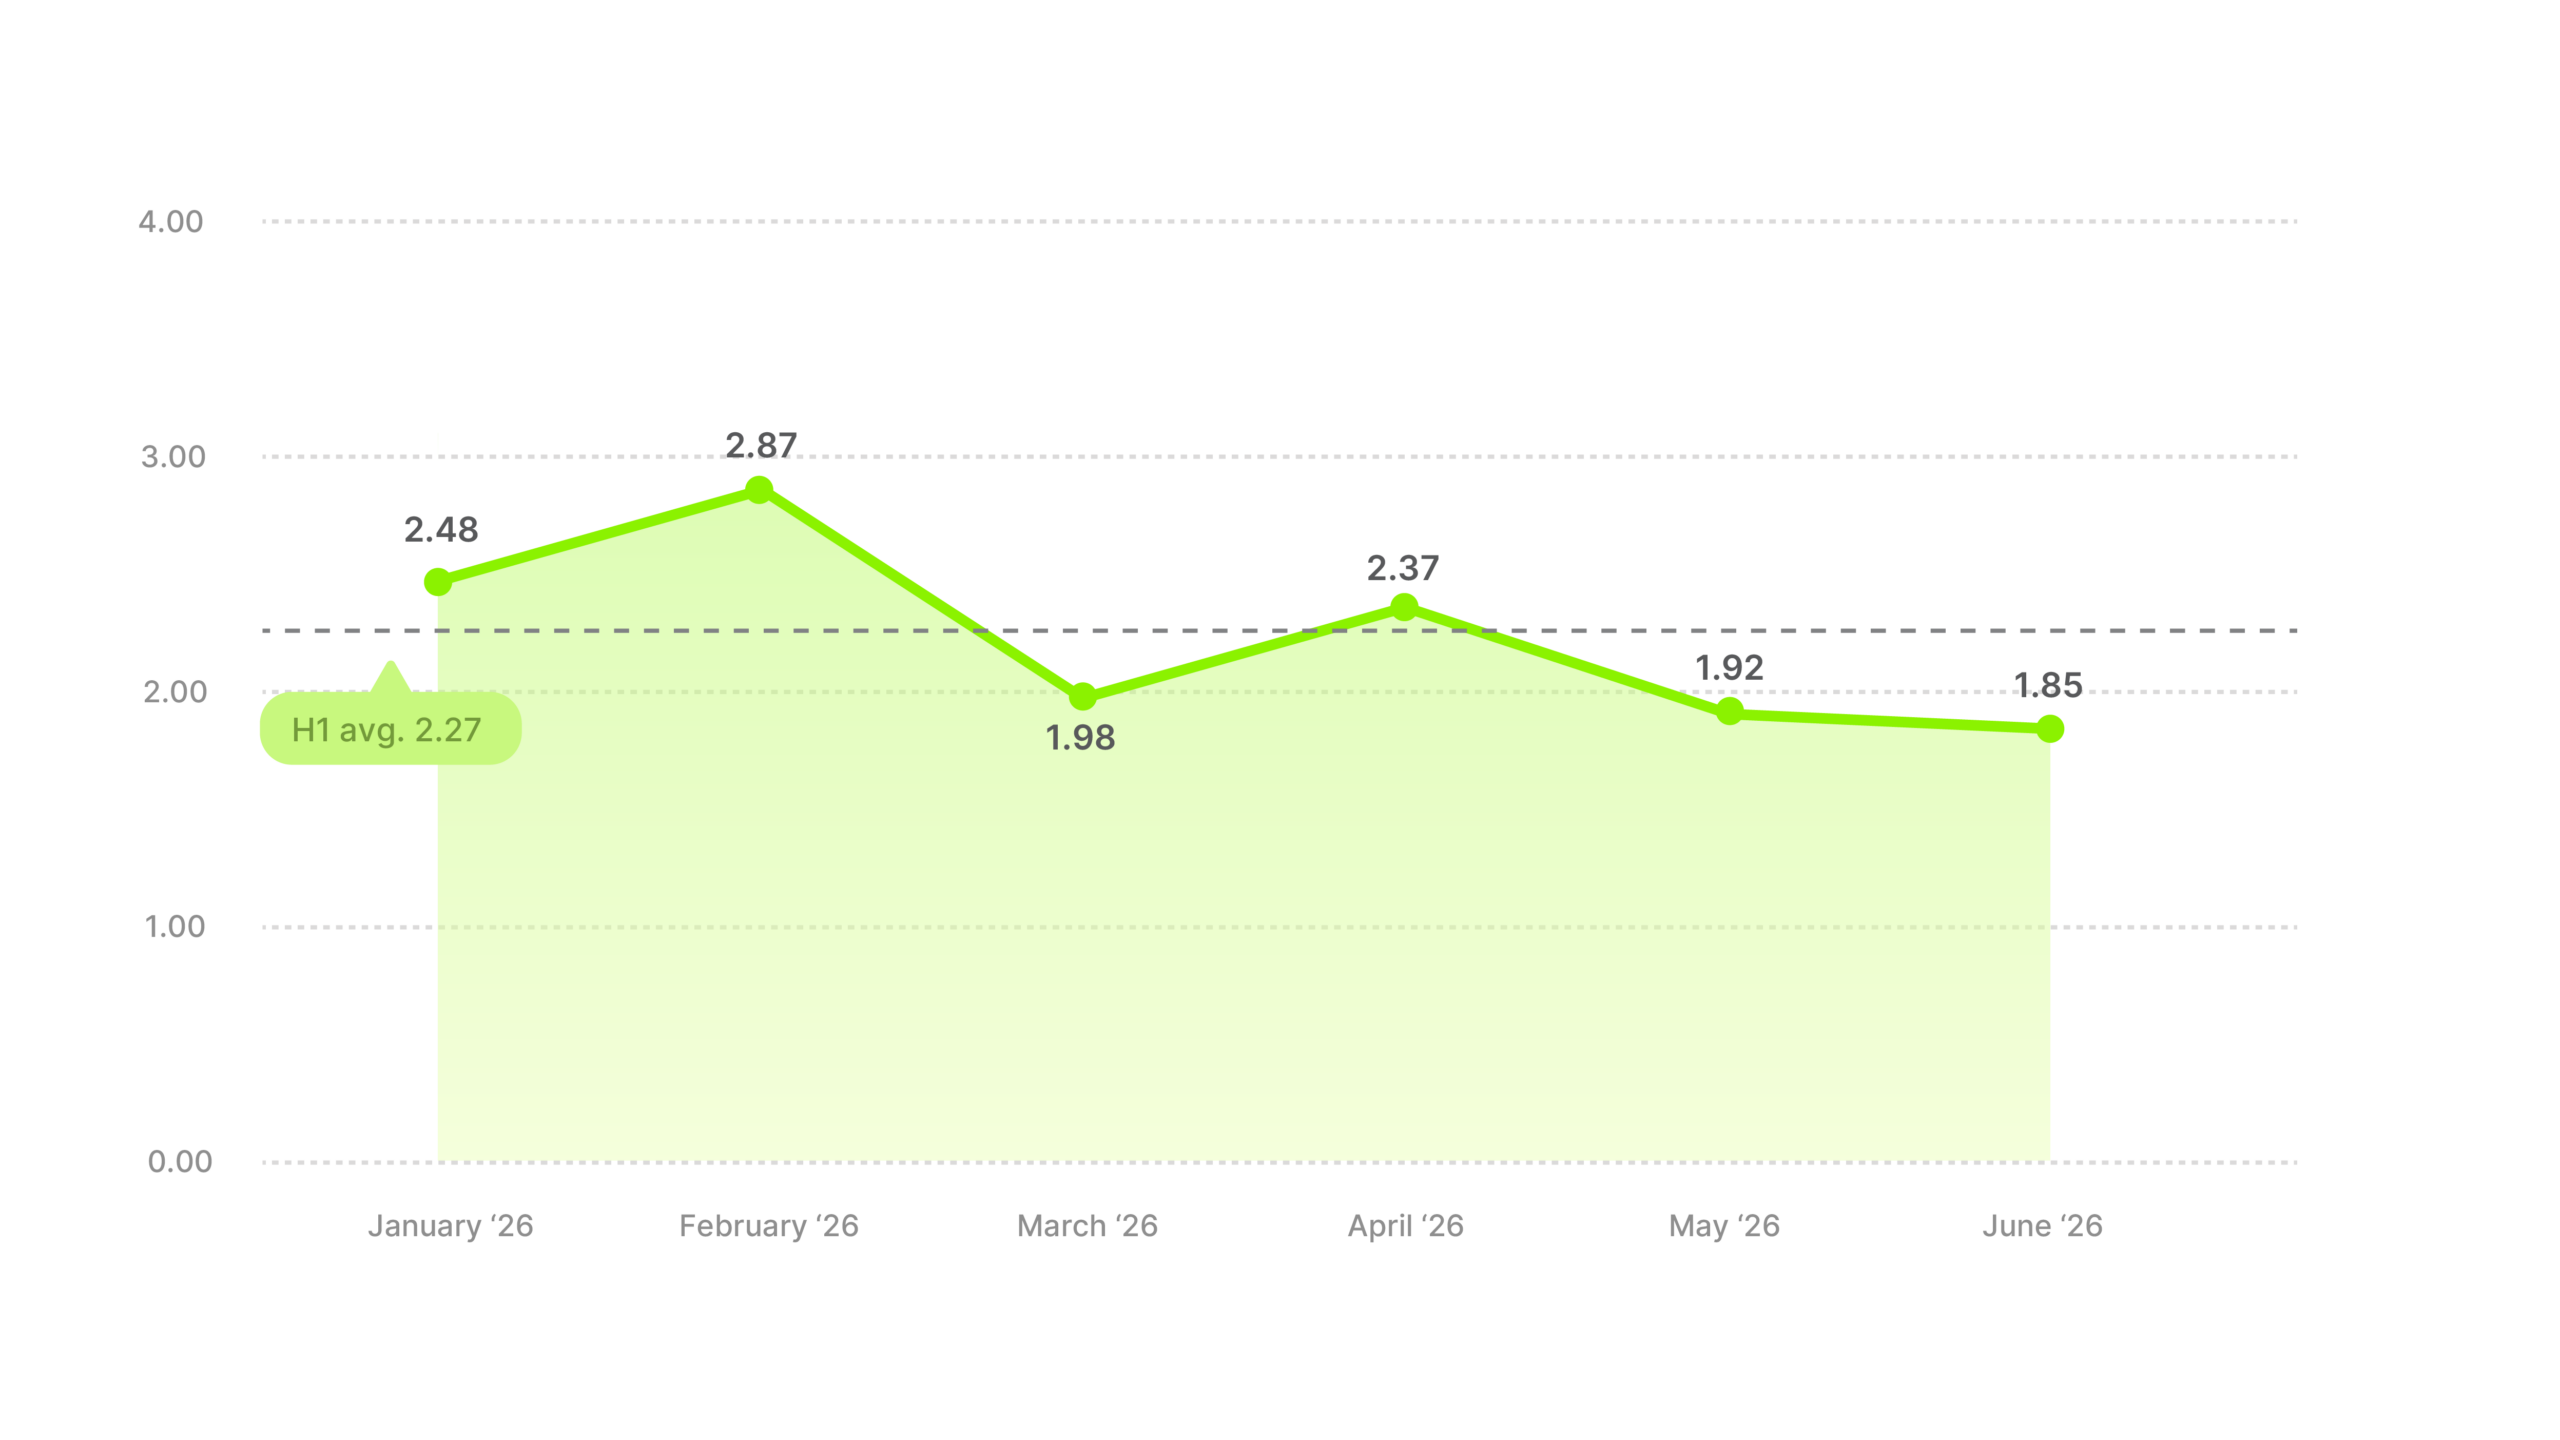
January opened at 2.48 and February peaked at 2.87. March fell to 1.98, April recovered to 2.37, then May and June came in at 1.92 and 1.85, the weakest month of the half. Services finished below the cross-industry average after starting well above it.
Against 2.44 last half, Services is down about 7%. Its best month moved too, from September last half to February this one, so there is no season here to plan around.
Services ranked seventh on hook rate, sixth on click-through rate and seventh here. No other category came in that close to the middle on all three, so nothing in Services is broken and nothing in it is outperforming.
Services holds everything from tax prep to gym memberships, and a number that averages those two together doesn’t describe either of them. People also buy a service when they need it or when the money gets approved, and that can be any month of the year.
So compare against your own last half instead of the category average, and spend steadily rather than trying to pick the good months.
Software fell to 0.56 in March and never got back to where it started. Its 1.04 half-average is last of fourteen, less than half the 2.17 cross-industry average.
Industry ROAS average
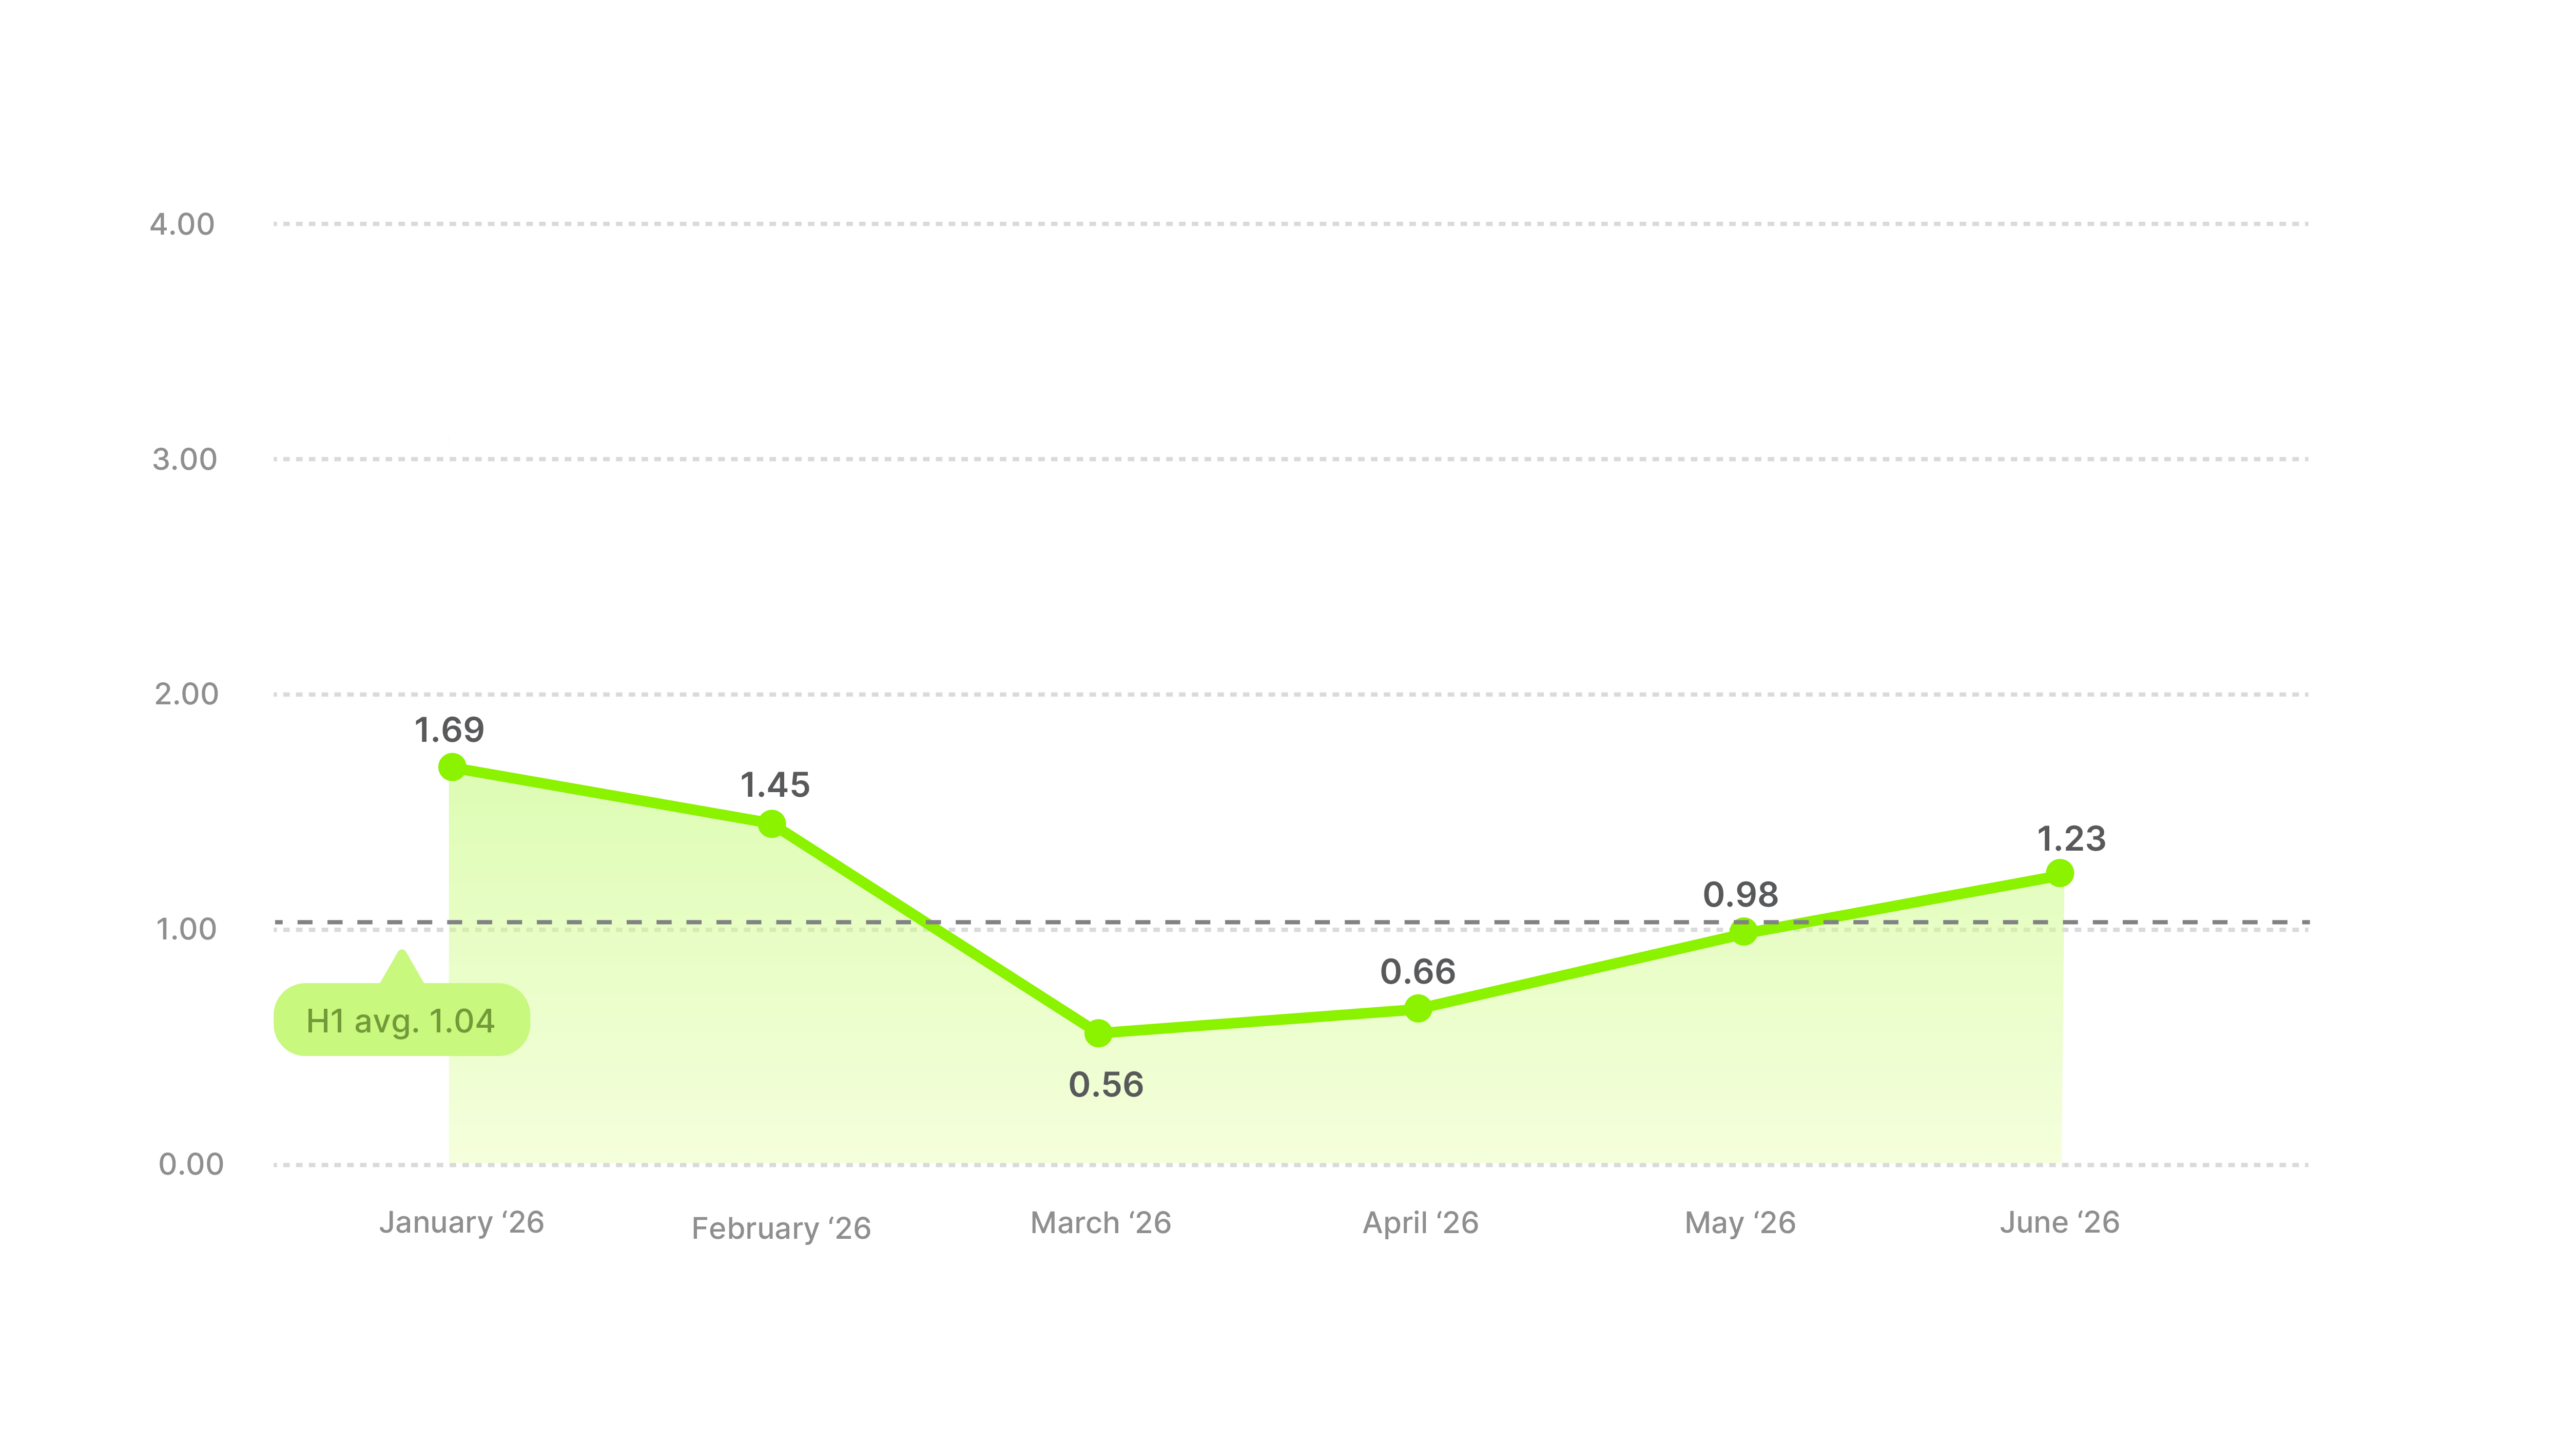
January opened at 1.69 and February fell to 1.45. March dropped to 0.56 and April to 0.66, the two weakest months any category recorded all half. May and June clawed back to 0.98 and 1.23, both still short of where the year began.
Against 1.73 last half, Software is down 40% and now last of the fourteen.
Software ranked eleventh on hook rate, ninth on click-through rate and fourteenth here. Most categories are strong at one part of the job and weak at another. Software is below average at all three.
Nobody buys software straight off a video ad. Someone starts a trial, someone else has to approve it, and the purchase comes weeks later, by which point the ad doesn’t get the credit. A ROAS of 1.04 probably undercounts what these ads actually did.
So measure the sign-up or the trial instead of the sale, and use 1.0 as the bar on this metric.
Sporting Goods moved less across the half than any category in the report and still lost more than any of them. It averaged 2.02, ninth of fourteen and just under the 2.17 cross-industry line.
Industry ROAS average
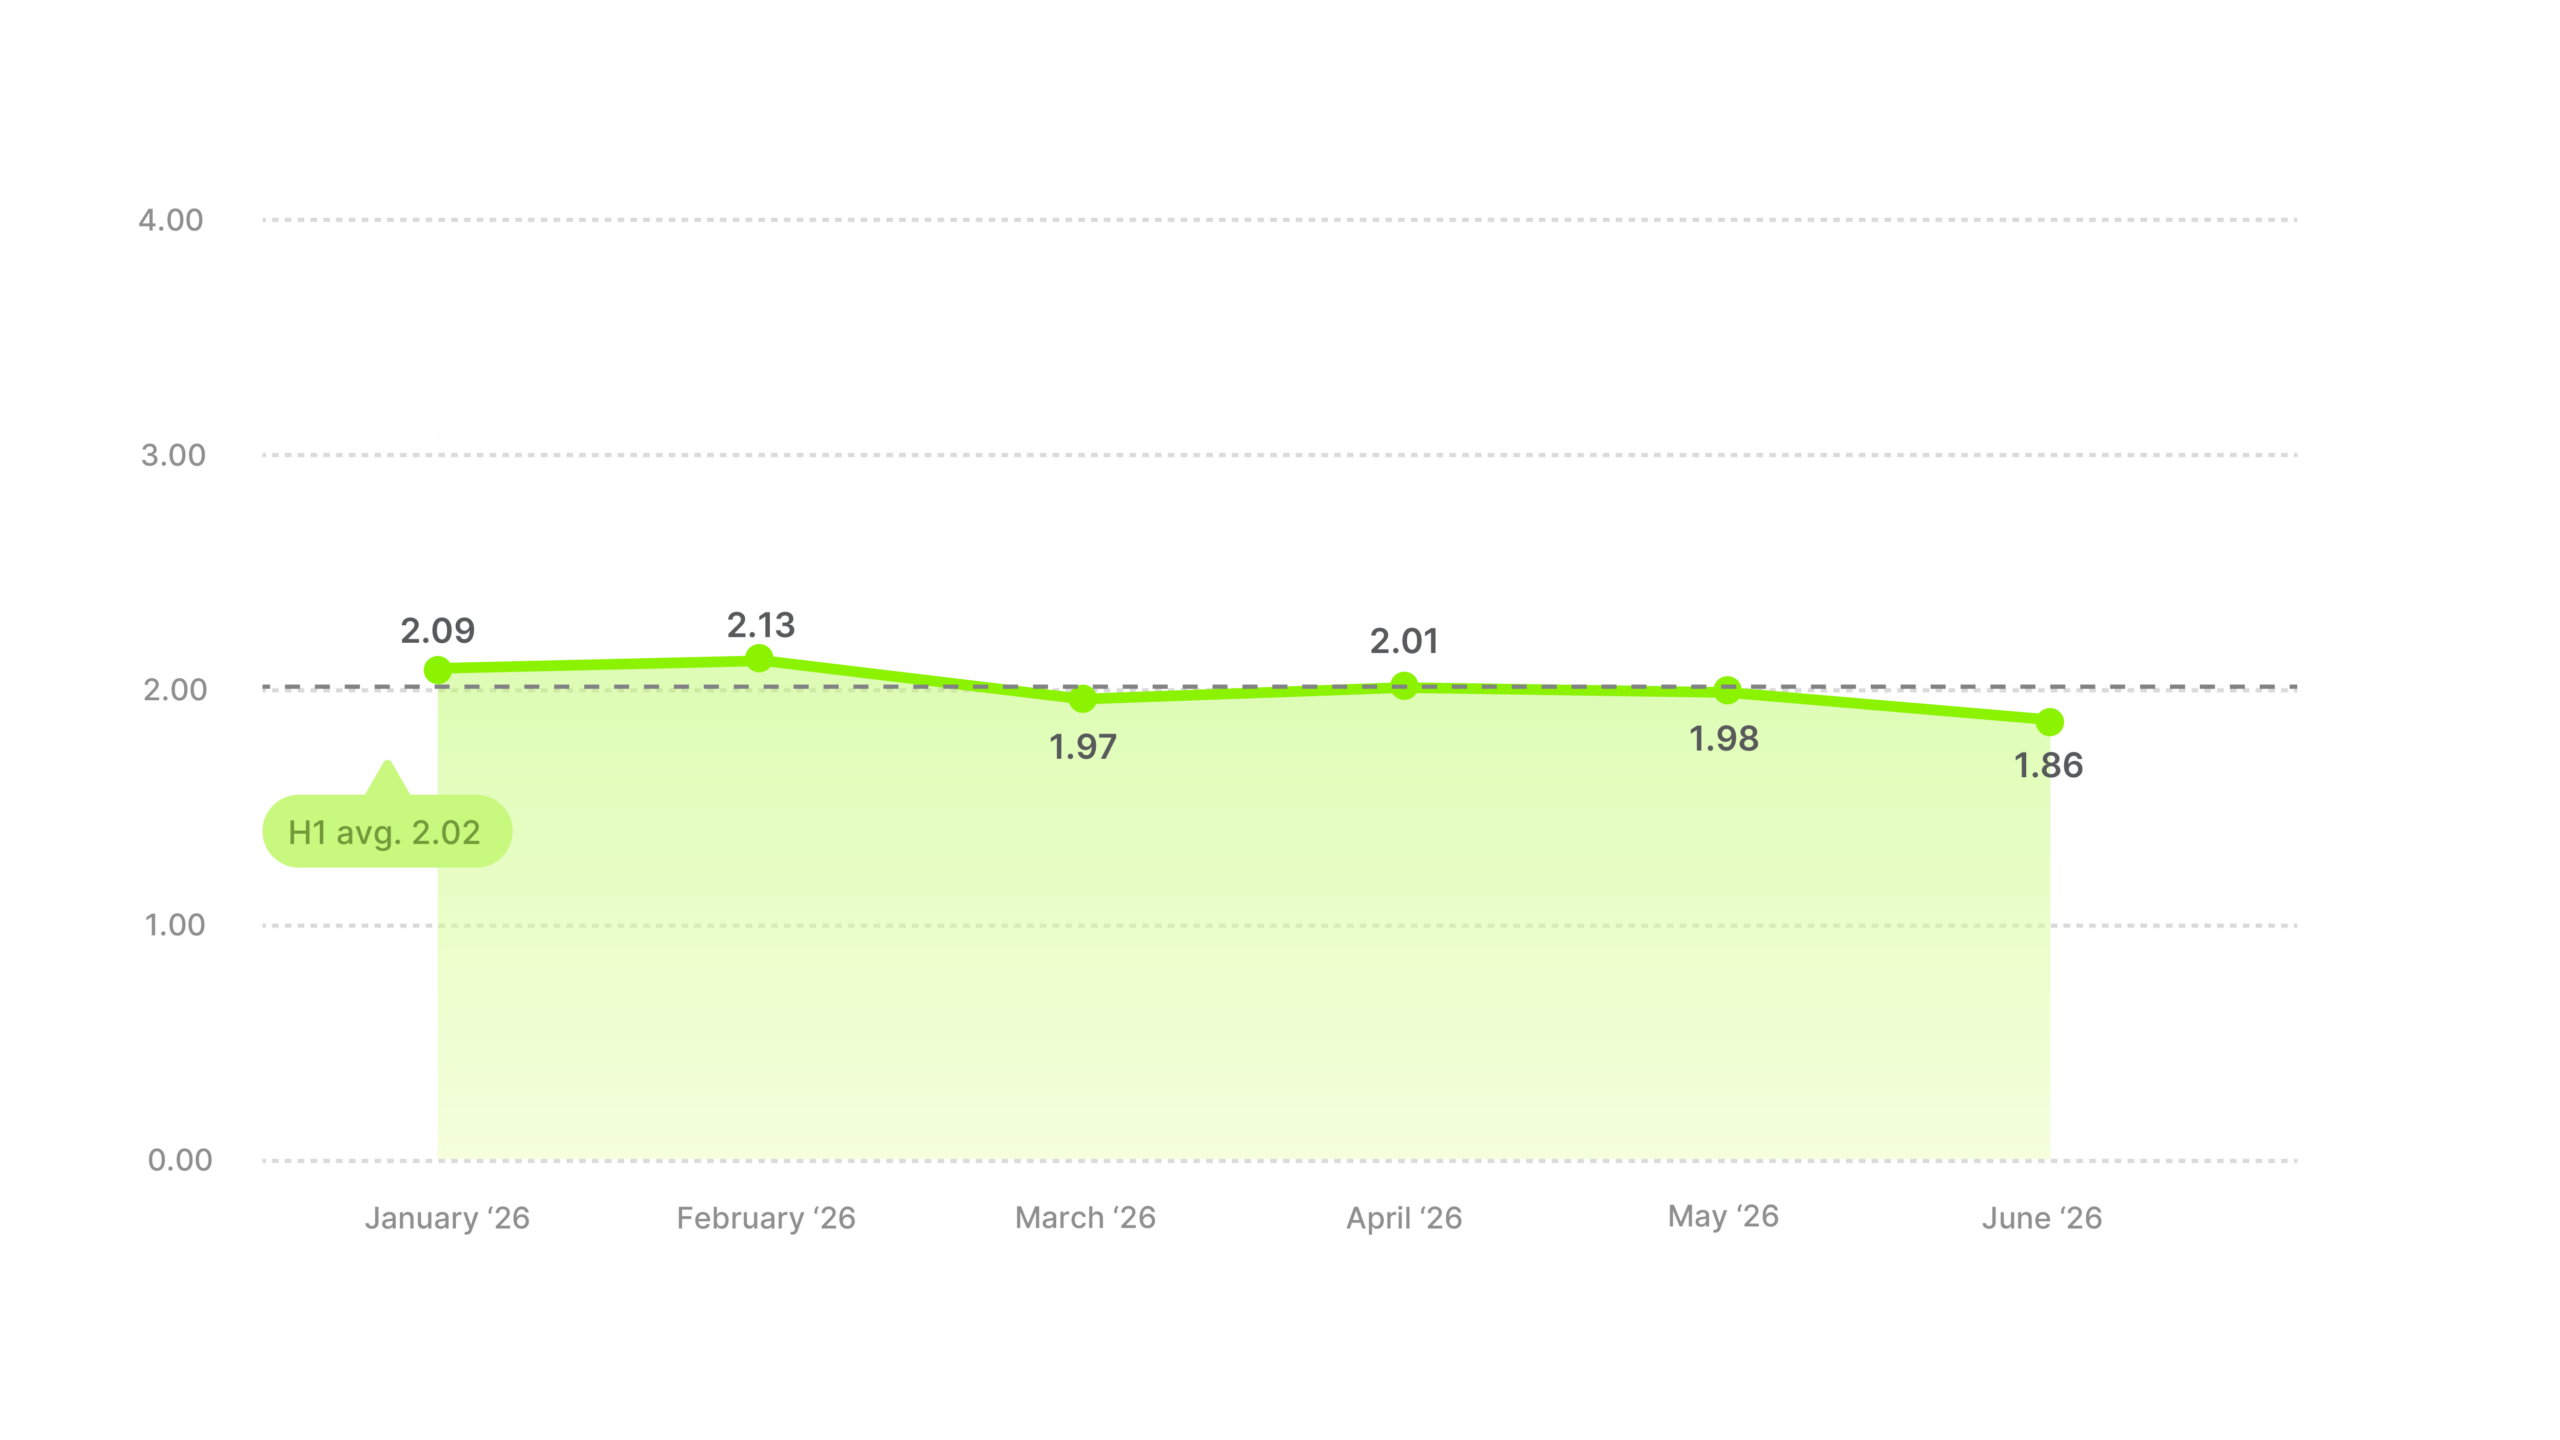
Every month came in between 1.86 and 2.13, a total range of 0.27 across the half. Nothing spiked and nothing collapsed. Sporting Goods drifted very slightly down as the half went on and otherwise held around 2.0.
Last half Sporting Goods averaged 3.66 and was second in the table. This half it’s 2.02, a 45% fall and the steepest of the fourteen.
The flat line is the interesting part, because the rest of the funnel was not flat. Hook rate climbed more than four points between January and May, and click-through went from about 1.36% across the first four months to 1.71% in May and June, which is the spring and summer sport season arriving. Return didn’t follow. It averaged 2.05 over the first four months and 1.92 over the last two.
So more people watched and clicked once the season started, and no more of them bought.
Any improvement has to come after the click. Lead with a concrete product benefit and a reason to buy this week, and cut the steps between the click and the checkout.
Toys & Games averaged 1.62, twelfth of fourteen and well below the 2.17 cross-industry average. For a category that makes its year in Q4, the first half of it is the off-season.
Industry ROAS average
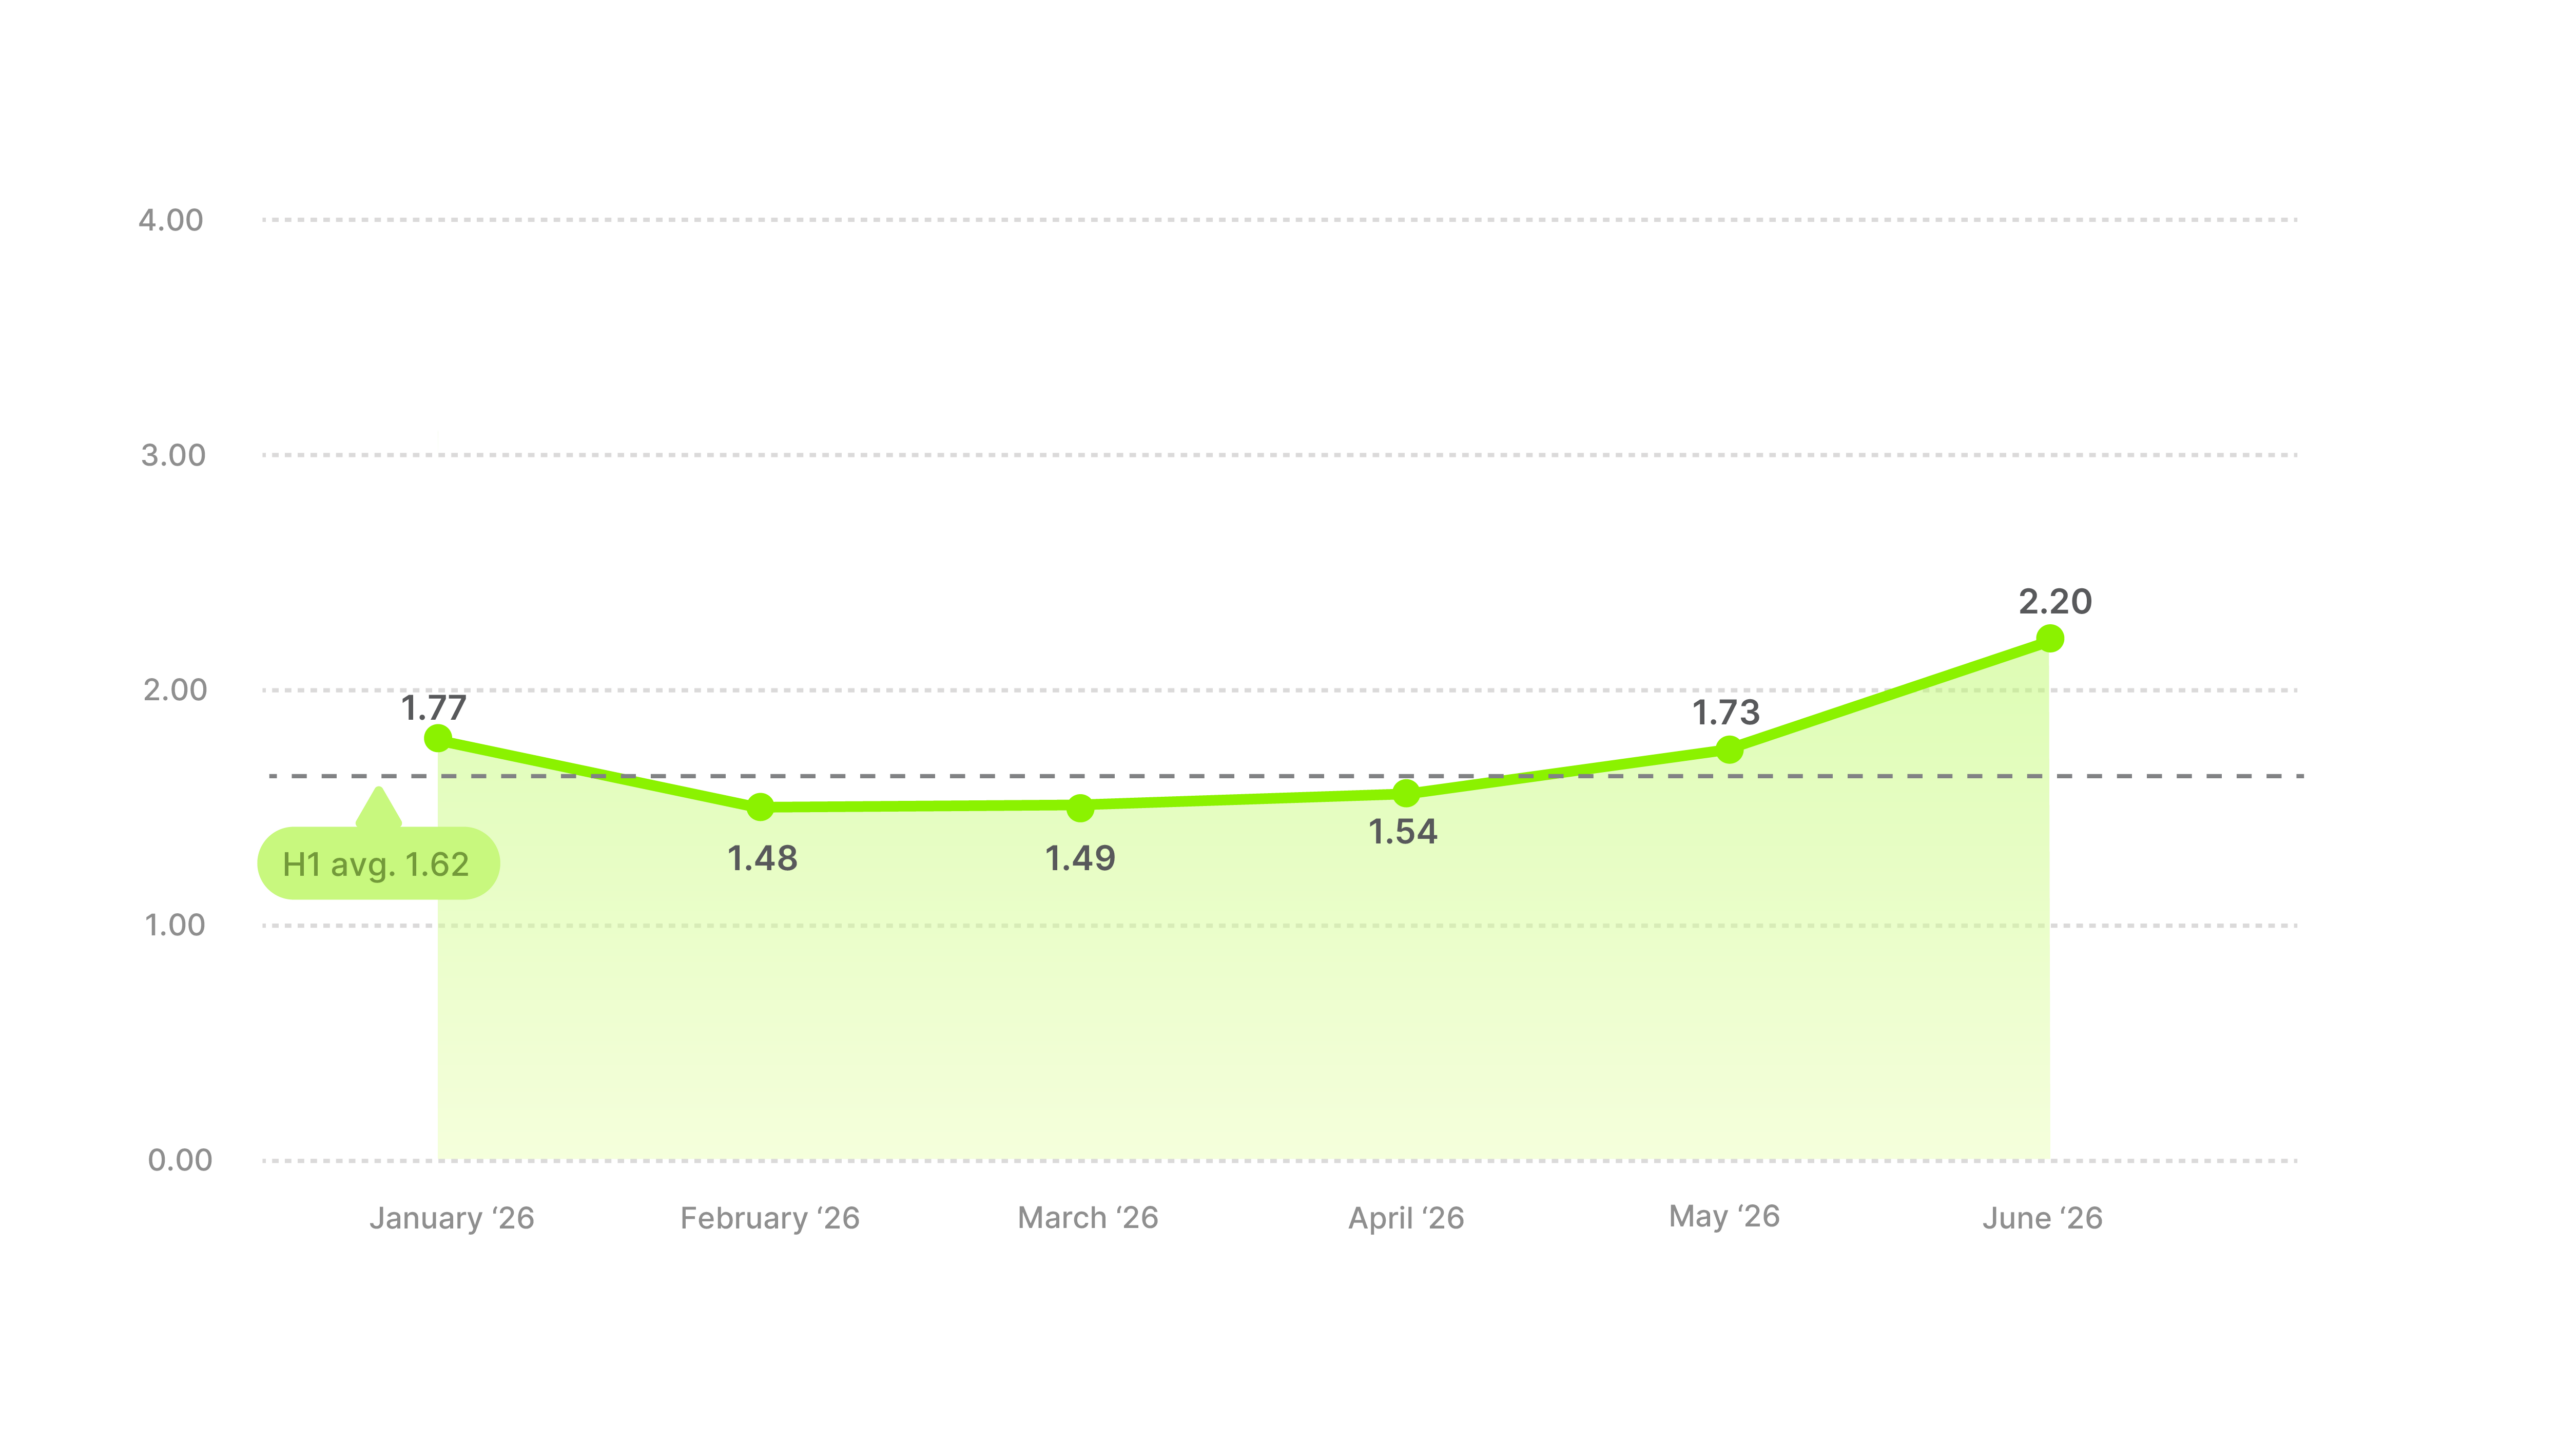
The half started at 1.77, then February, March and April flattened out at 1.48, 1.49 and 1.54. May reached 1.73 and June 2.20, its strongest month. Toys & Games came in below the cross-industry average in five of the six months, and June is the only one that cleared it.
Against 1.68 last half, the half-average barely moved, down about 4%.
Toys & Games had the best hook rate of all fourteen at 28.79% and the fourth-best click-through rate at 1.89%, and it still finished twelfth here. Last half people watched and didn’t click. This half they clicked and still didn’t buy.
Toys & Games earned more attention than any of the other thirteen categories during the half when its buyers aren’t shopping, which makes H1 the time to build audiences instead of chasing sales from them. Run the top-of-funnel creative that’s already working, keep the viewers, and put the offer in front of them when the gift season comes back.
Other averaged 2.48, fifth of fourteen and above the 2.17 cross-industry average. It isn’t really a category, though. It’s every industry that didn’t have the volume to report on its own, added together.
Industry ROAS average
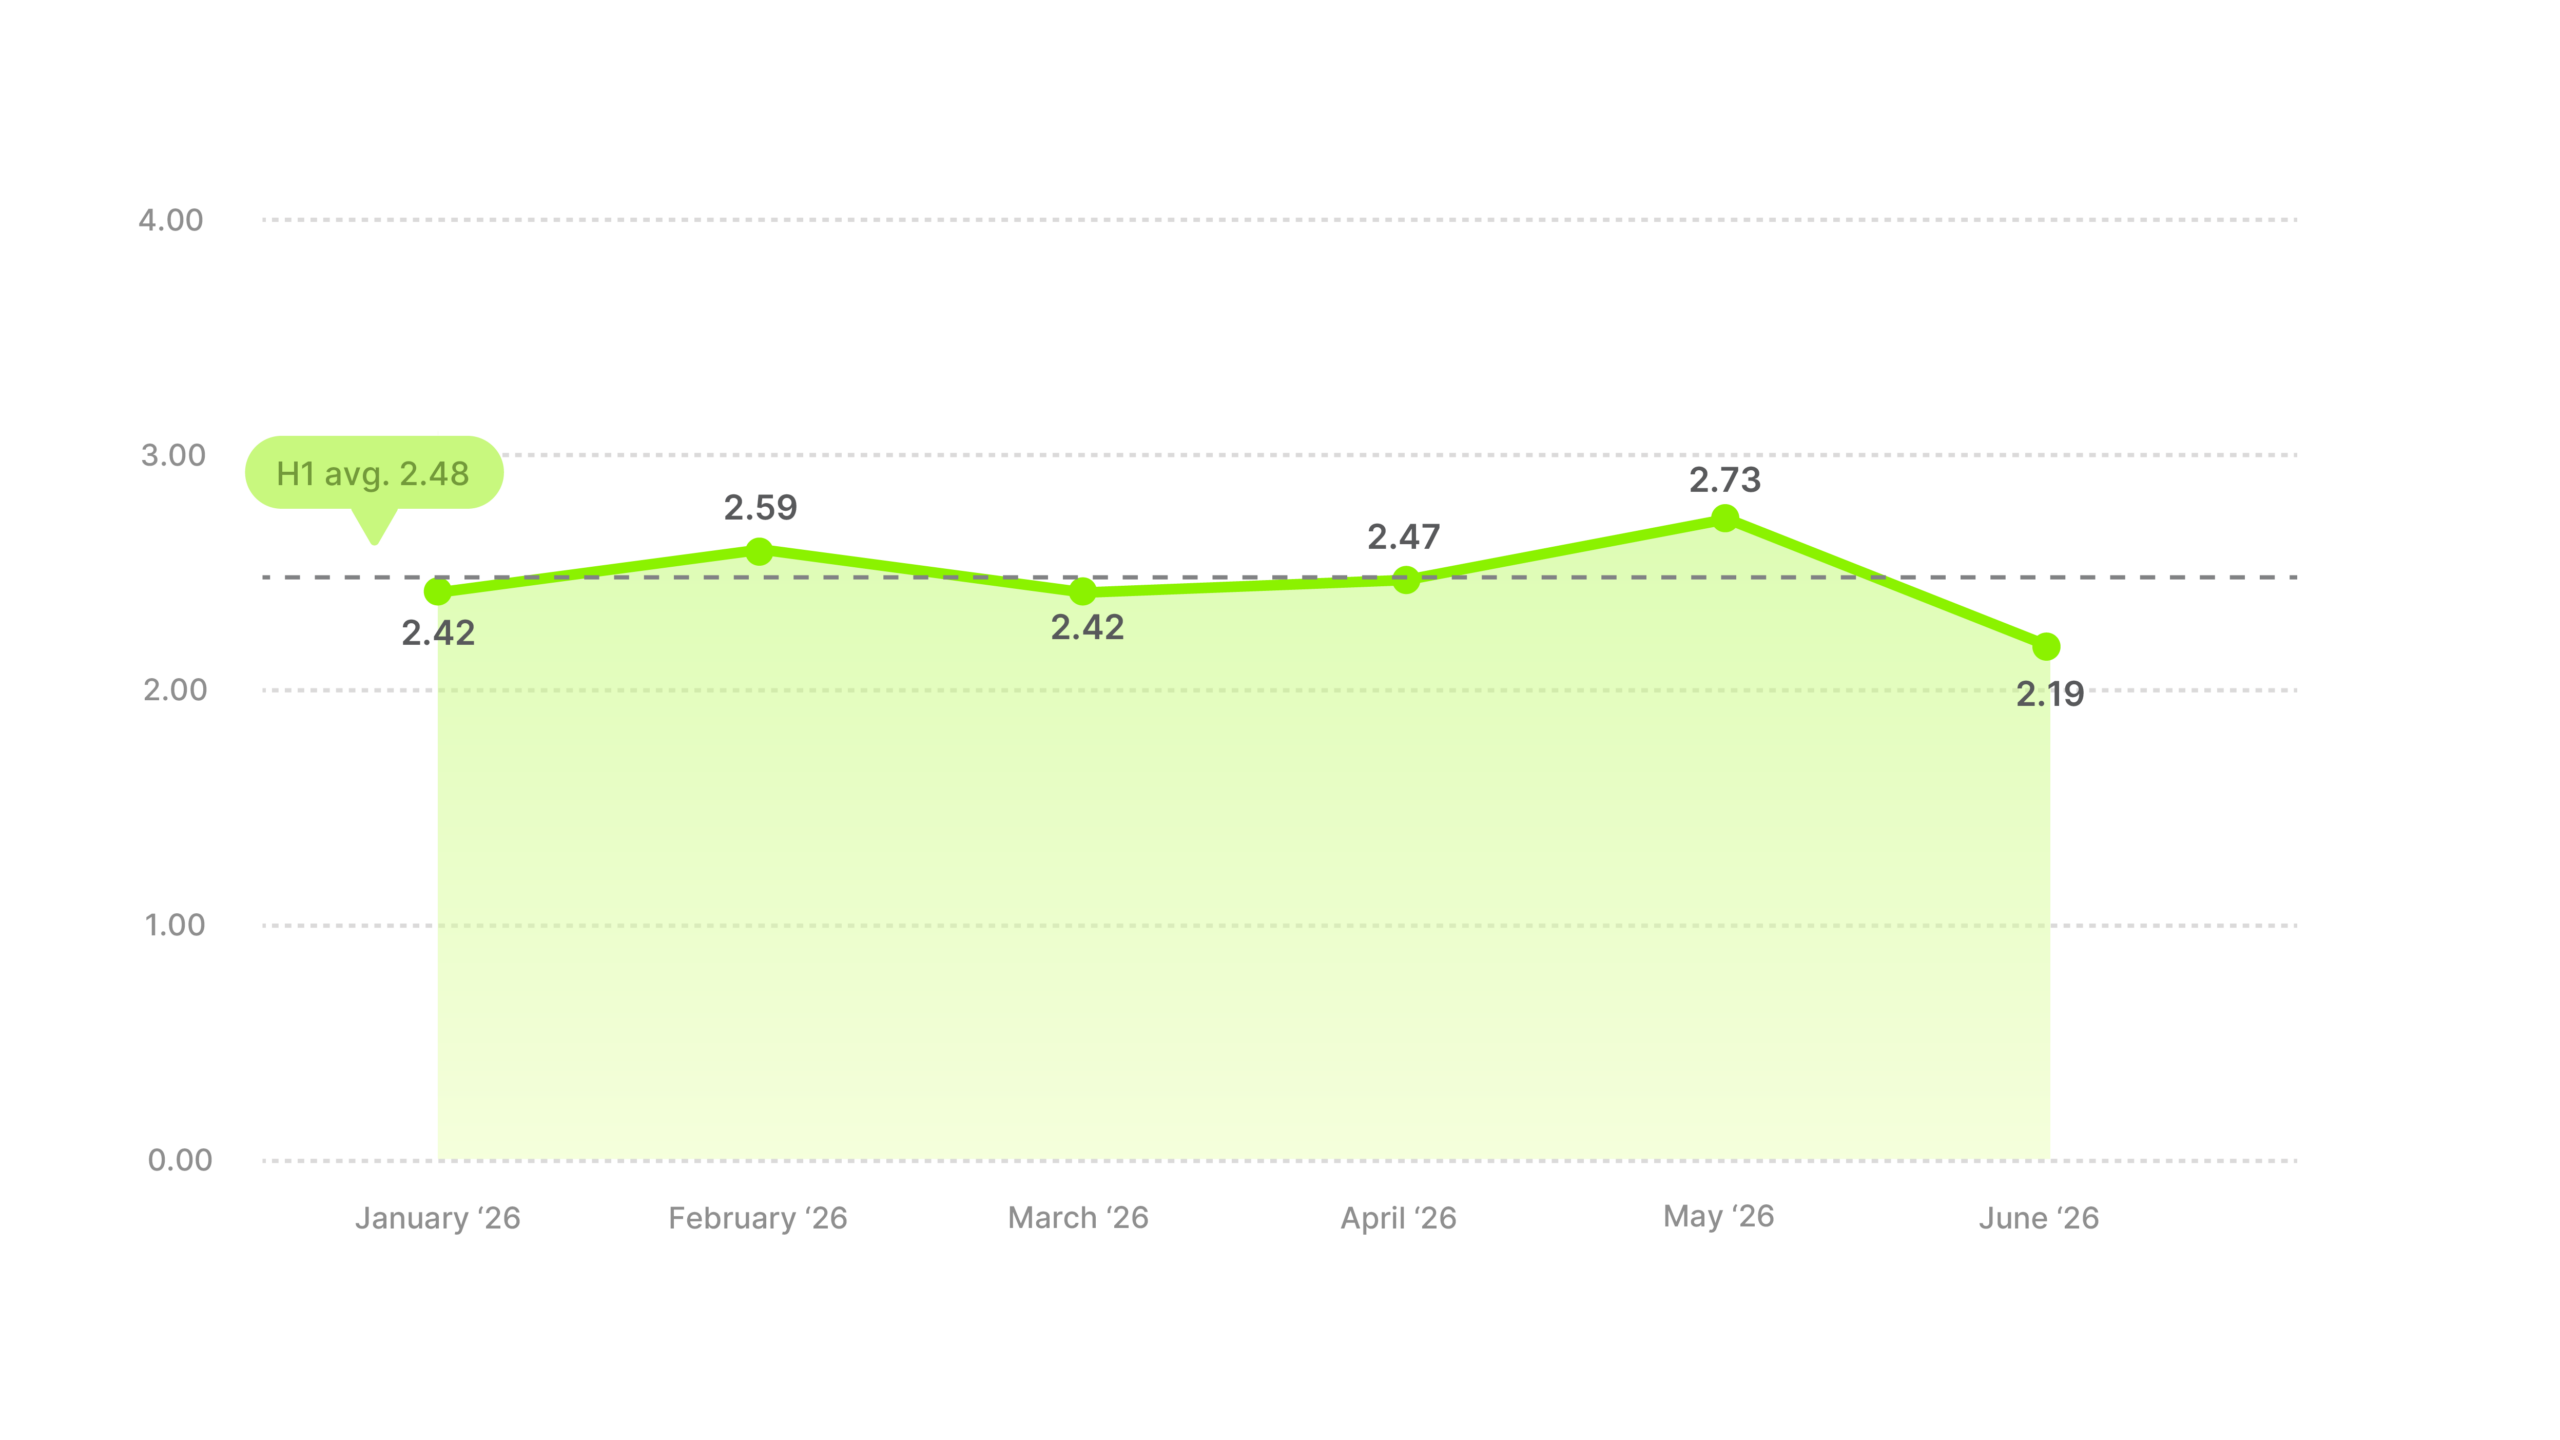
Other moved less across the half than anything except Sporting Goods, with every month between 2.19 and 2.73 and a total range of 0.54. Add enough unrelated industries together and their swings cancel each other out.
Against 2.55 last half, Other barely moved, down about 3%.
Don’t plan against 2.48. It’s an average of businesses that have nothing to do with each other. Find the named industry closest to what you actually sell and benchmark against that, and if nothing here is close, benchmark against your own last half. Failing both, look at Baby & Toddler and Electronics. Both sell to people who had already decided they needed the thing.
Methodology
Data source: 88,329 Meta video ads that ran between January 1 and June 30, 2026, carrying $122 million in spend and $212 million in purchase value between them. That’s every qualifying ad in the fourteen categories below, not a sample of them.
Inclusion criteria: Sales-objective video ads with reliable metrics and more than 1,000 impressions.
ROAS definition: Each ad’s purchase value divided by its own ad spend, then averaged across ads. It describes what a typical ad returned for every dollar behind it. Dividing the dataset’s total purchase value by its total spend answers a different question and gives a different number.
Industry classification: Fourteen categories assigned by advertiser product type. “Other” holds the industries too small to report on their own.
A note on interpretation: These figures describe what happened in H1 2026. They aren’t a forecast or a guarantee. Smaller-sample categories are more sensitive to the behavior of individual advertisers.