What the data told us
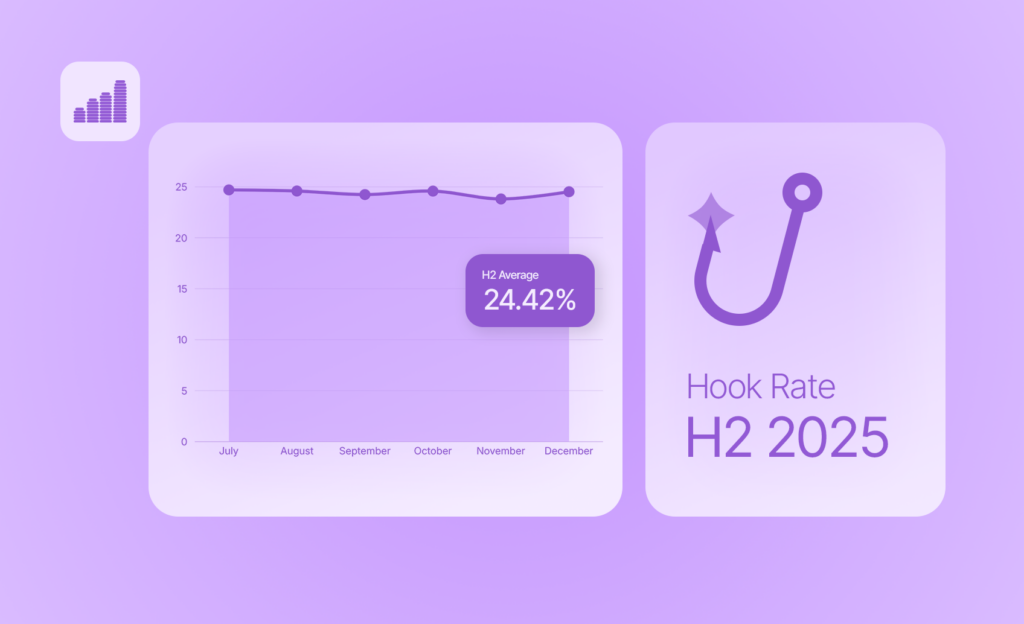
1. Your benchmark went up by a point. The cross-industry average was 25.44%, against 24.42% last half. Anyone still measuring against the 2025 number is flattering themselves by a full percentage point.
2. Industry numbers matter more than the overall average. Services, Business & Industrial, Sporting Goods and Arts & Entertainment all held or improved from Q1 to Q2, and all four ended June above the month’s average. The cross-industry line went the other way, from a March peak to a June low. Nine categories declined, and they’re 82% of the ads, so this is a dominating trend.
3. Business & Industrial reached 33.03% in March. No other category reached that figure in any month, and Business & Industrial stayed above the cross-industry average in all six months, averaging 28.74% for the half. Whatever’s true about the category’s video being hard to sit through, it isn’t true of the first three seconds.
Overall hook rate trend, H1 2026
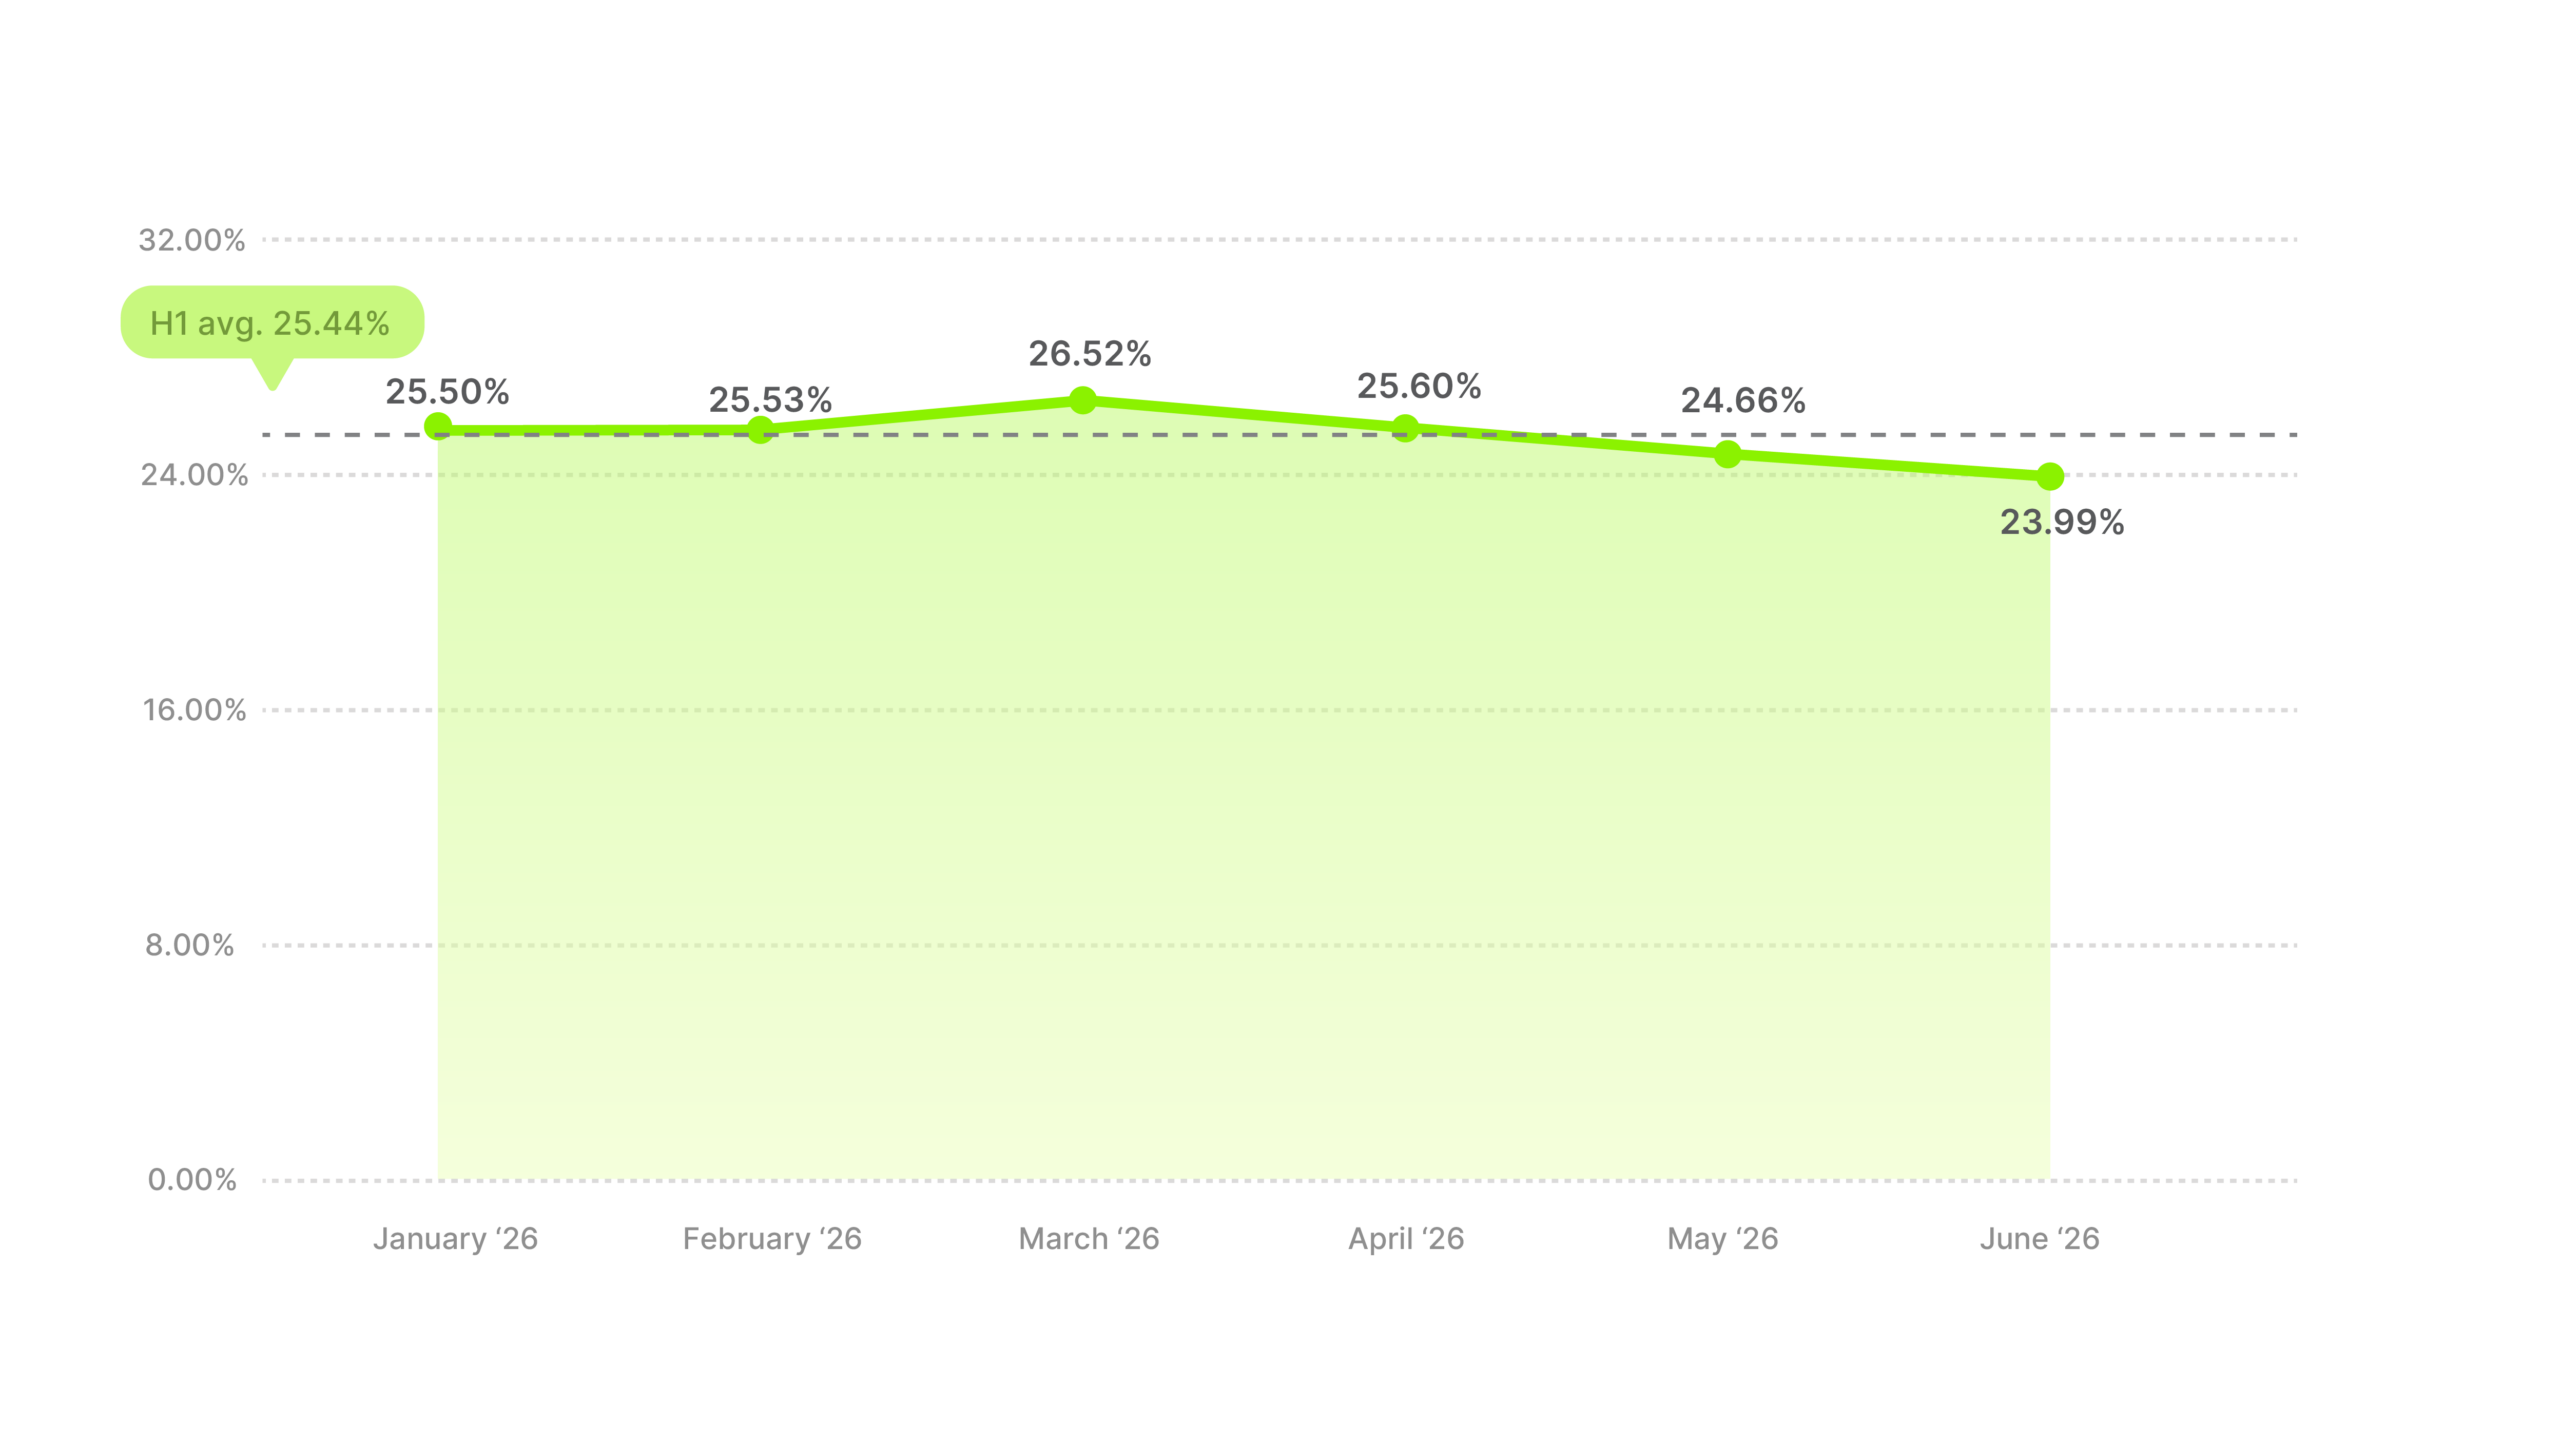
Hook rate rose into March, then fell every month after. January started at 25.50%, March peaked at 26.52%, and June closed at 23.99%, below where the year started. The gap between the highest and lowest month was 2.53 pp.
That’s nearly three times the 0.89 pp range of H2 2025, so there was more movement this half than last. It still isn’t much movement for a number that blends 14 industries and every advertiser in them. Roughly one viewer in four stayed past the opening seconds, every month, all half.

Read the March-to-June fall on its own and you’d conclude the market cooled, and you’d be half right.
But four categories went the other way. Services rose nearly 7 pp between February and May. Business & Industrial held above 28% from March onward. From February to June, Sporting Goods ran between 26.3% and 28.6%. Arts & Entertainment rose for four straight months and peaked in June, the exact month the cross-industry average bottomed out.
Going the other direction, Health & Beauty dropped more than 4 pp from its March high, Toys & Games lost nearly 5 points between April and June, and Baby & Toddler finished the half at its lowest reading. More categories fell than rose, and the ones that fell carried most of the volume, so the average came down.

The categories that declined lean gifting and need-based. H1 has gifting moments of its own, Valentine’s Day and Mother’s Day among them, but none of them carry Q4’s demand. After that, how much demand you get depends far more on your industry, and commerce in particular runs slower.
Use 25.4% as your baseline. Keep one viewer in four watching past the opening seconds and you were an average advertiser this half. Fine place to start. The overall number says nothing about which direction your category was moving, though, and three of the four that improved through Q2 ended June above it. Your category is your benchmark.
Hook rate benchmarks by industry
The 14 industries ranged 7.47 pp from highest to lowest. The cross-industry average moved 2.53 pp across six months. So your industry mattered about three times more than the month did.
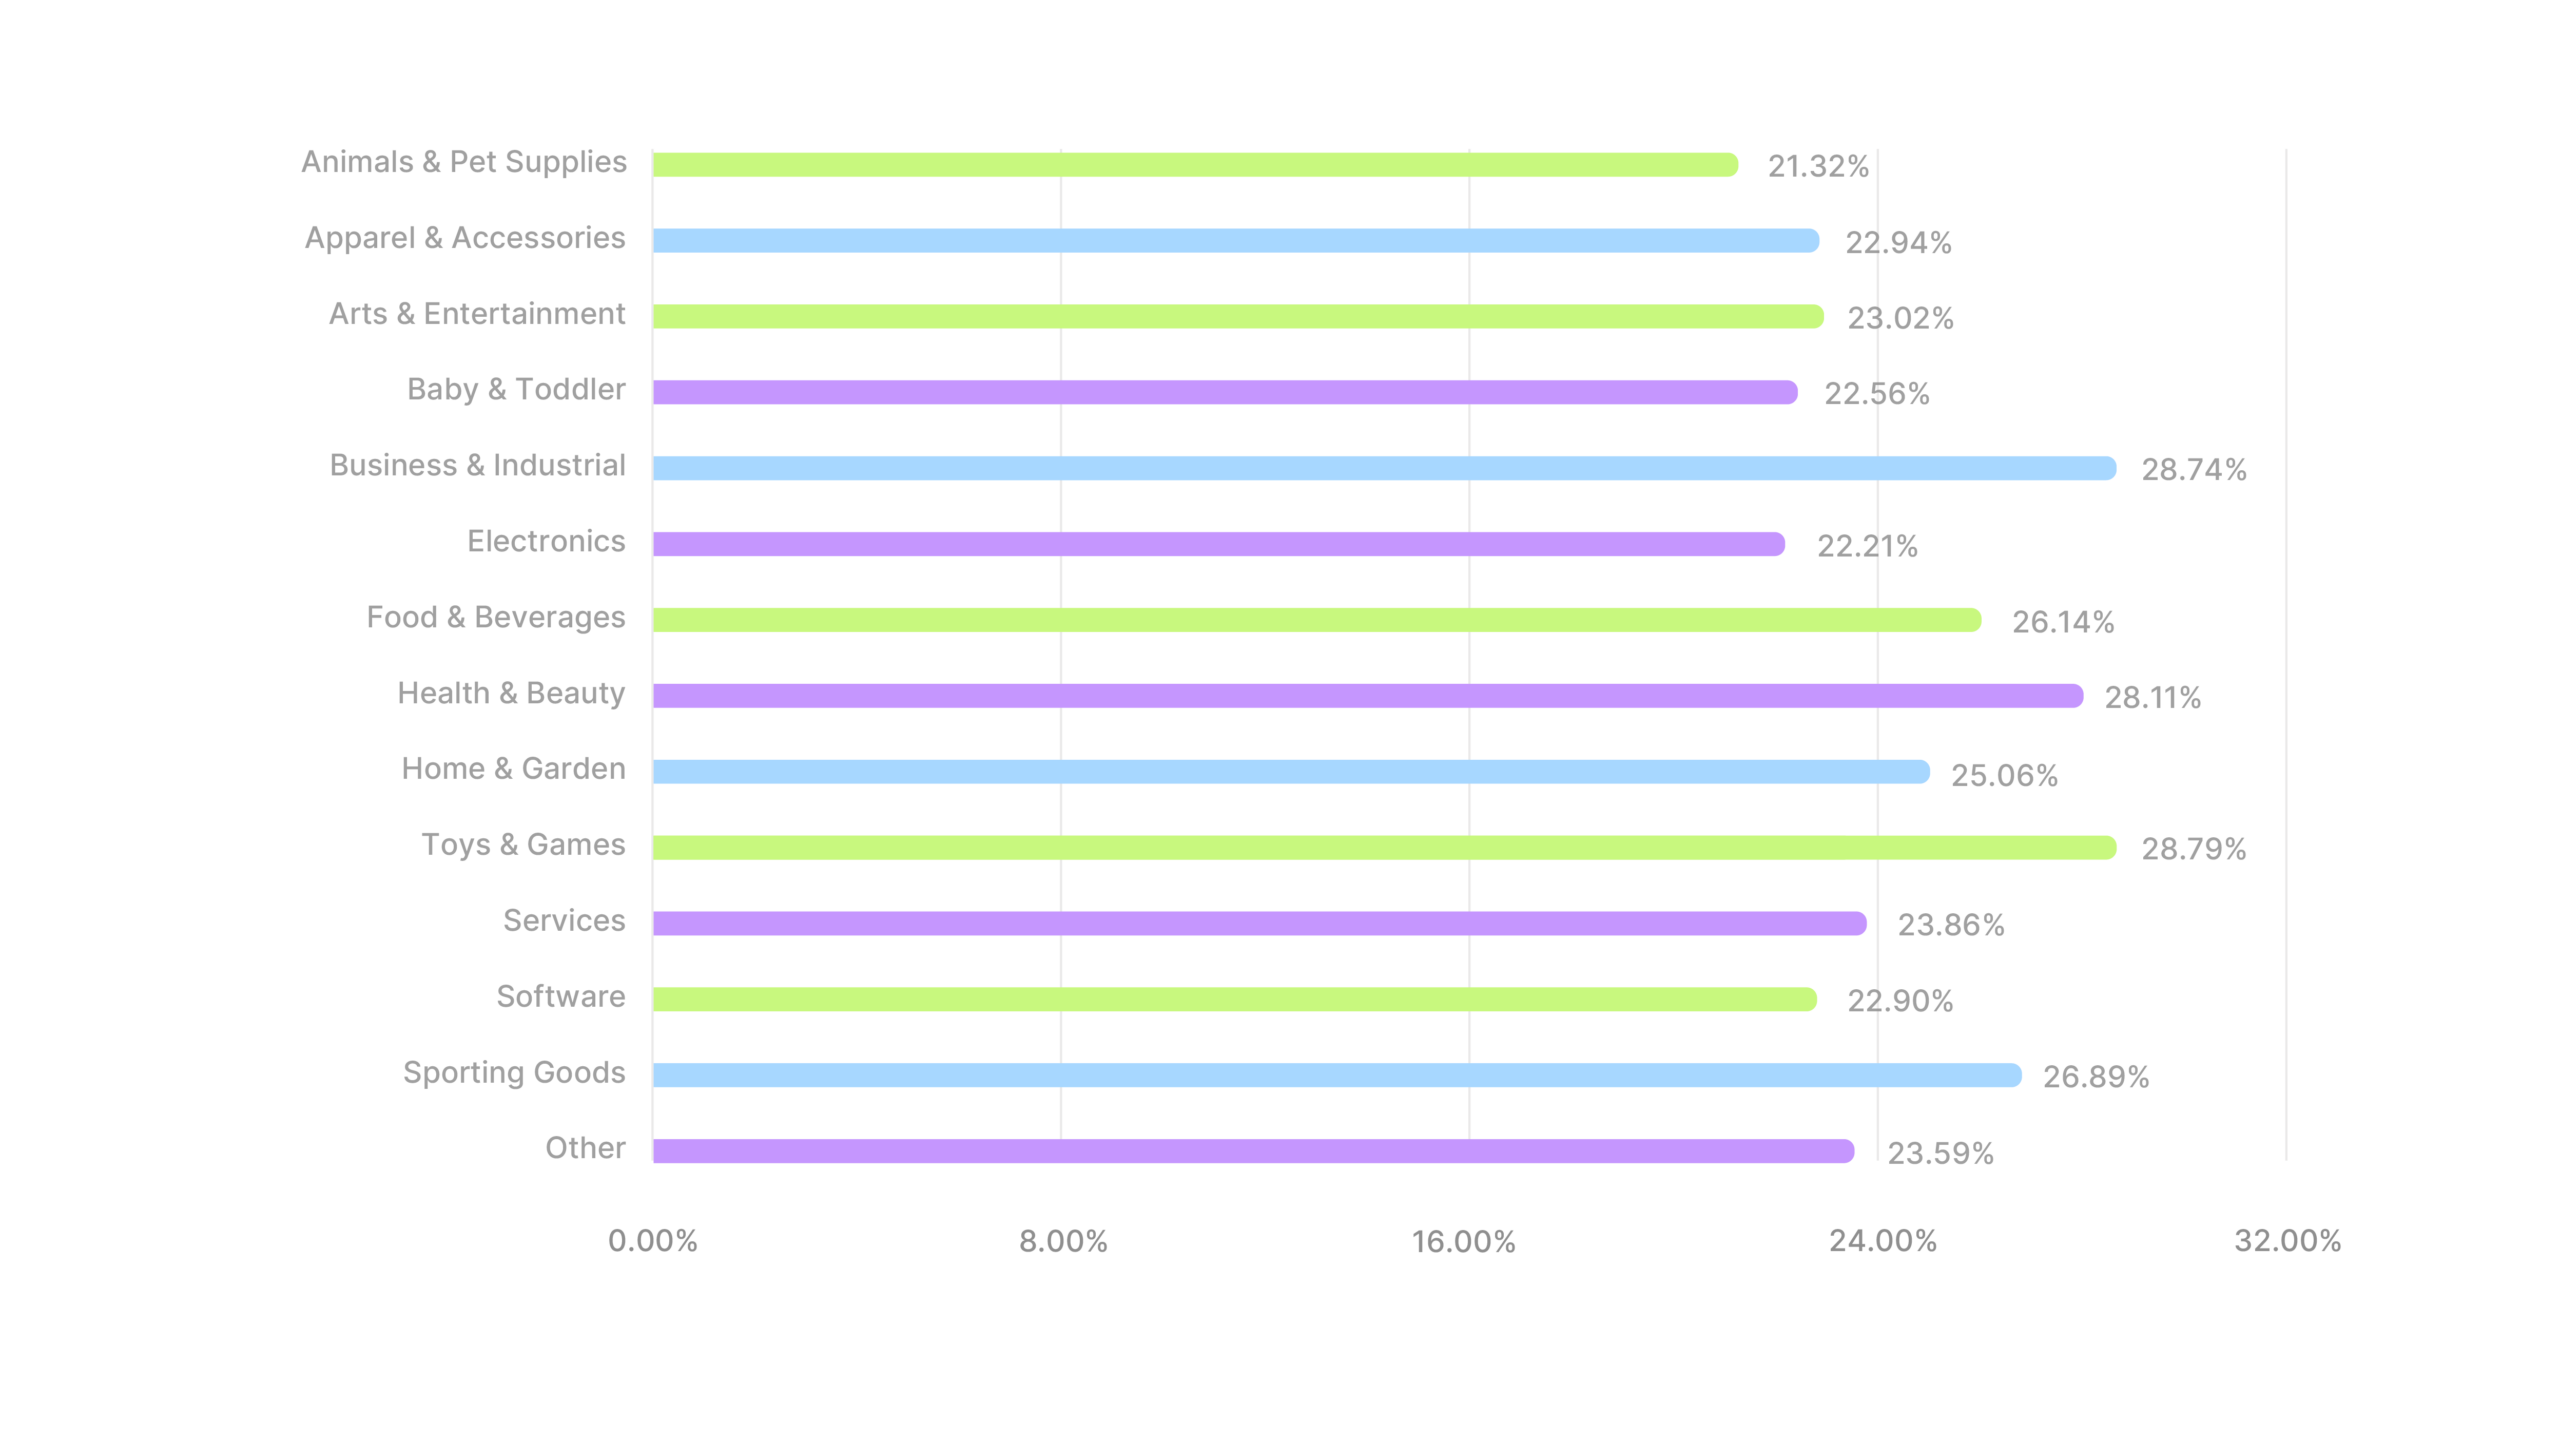
The distribution changed too. Three categories sat near 28% at the top, eight sat below 24% at the bottom, and the middle thinned out compared with last half. The overall spread narrowed from 8.54 pp to 7.47, almost entirely because the lowest categories improved. Animals & Pet Supplies gained 1.5 pp and Services gained nearly 4, while the top barely moved.
Two of the three leaders are no surprise. A toy mid-play and a before-and-after both do their selling inside three seconds. Business & Industrial sitting up there with them is the surprise.
The bottom of the table carries the sharper lesson. Apparel & Accessories and Electronics are about as visual as categories get, and both spent all six months below the average. Being showable isn’t the same as being worth watching. Once every ad in a category opens the same way, the format stops earning attention on its own, which means the fix is in the creative.
Industry deep dives
Fourteen categories below, each with its monthly line, its distance from the cross-industry average, and what the pattern means for how you brief. Find yours and use its number instead of the cross-industry average.
No month came closer than 3 pp to the cross-industry average, and February was 5.4 pp below it. Six months out of six on the wrong side of the line is what a ceiling looks like.
Industry hook rate average
Distance from all-industry average
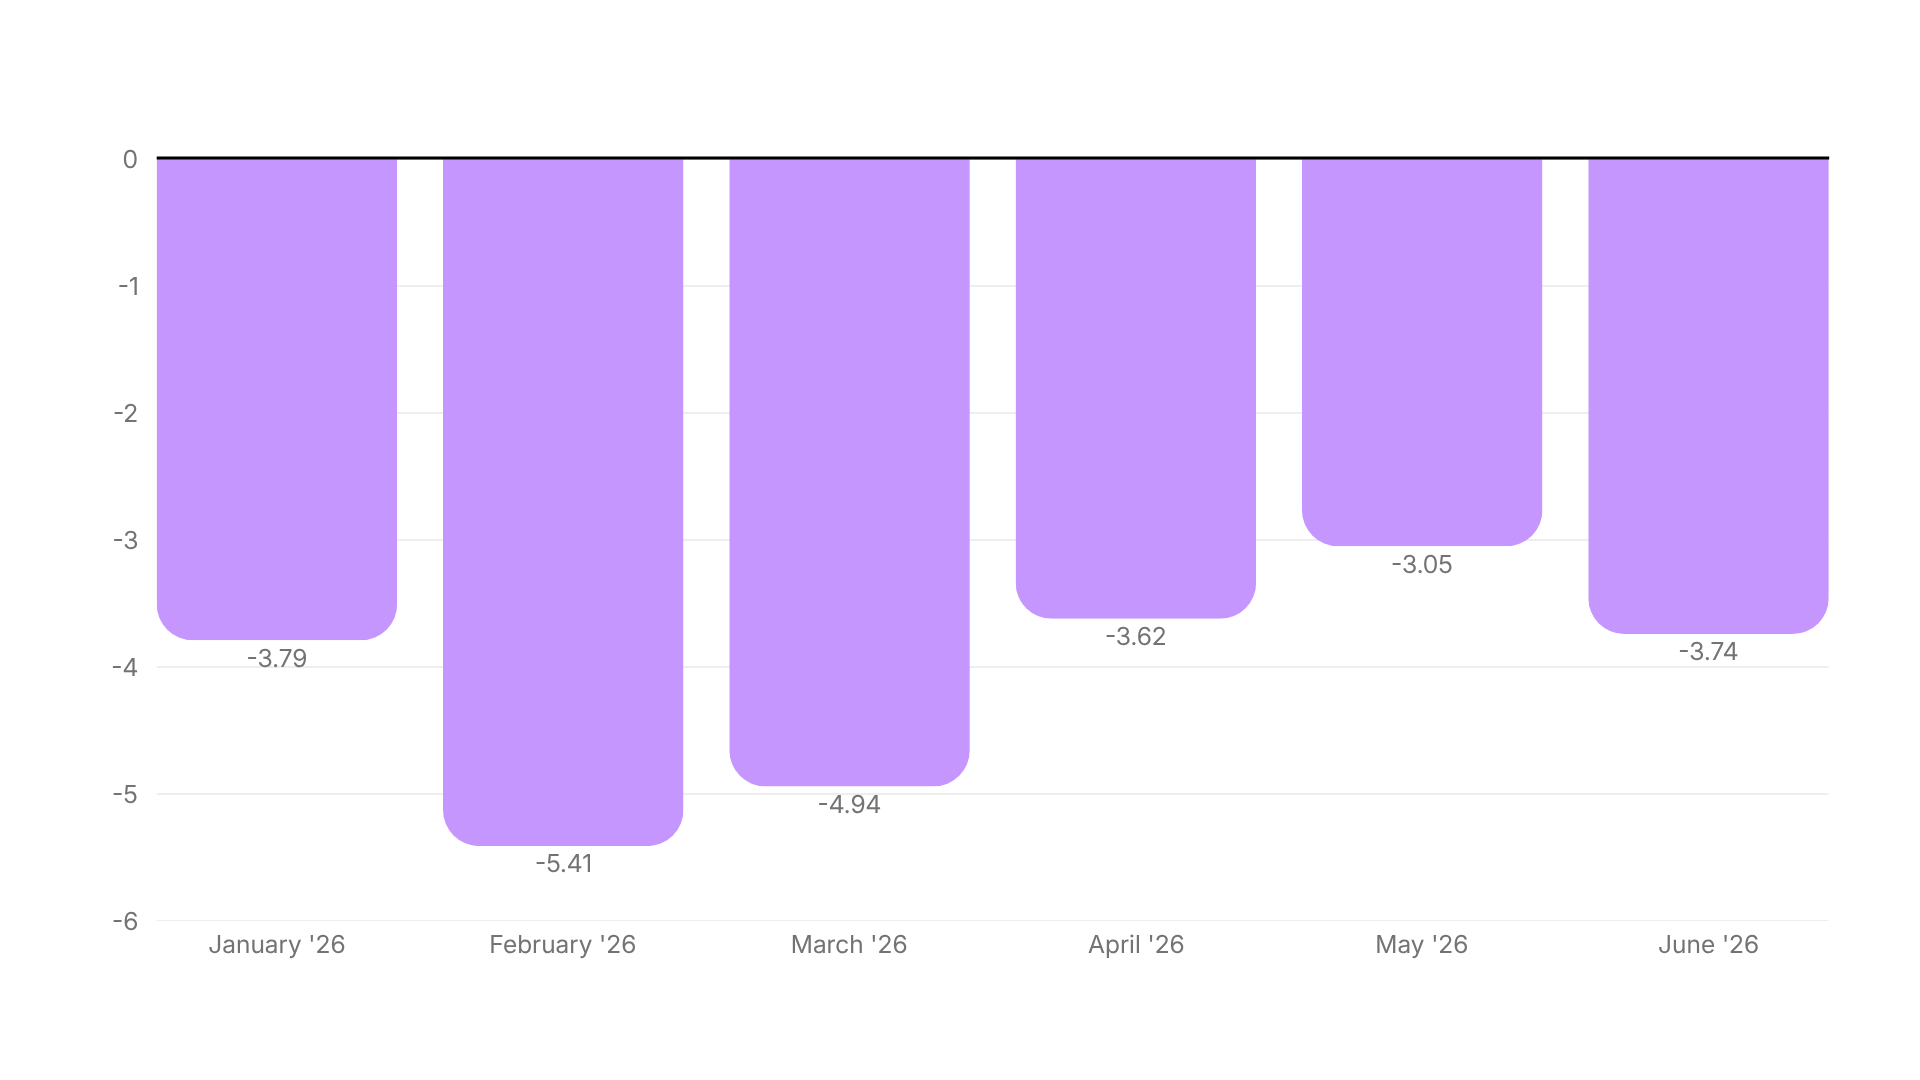
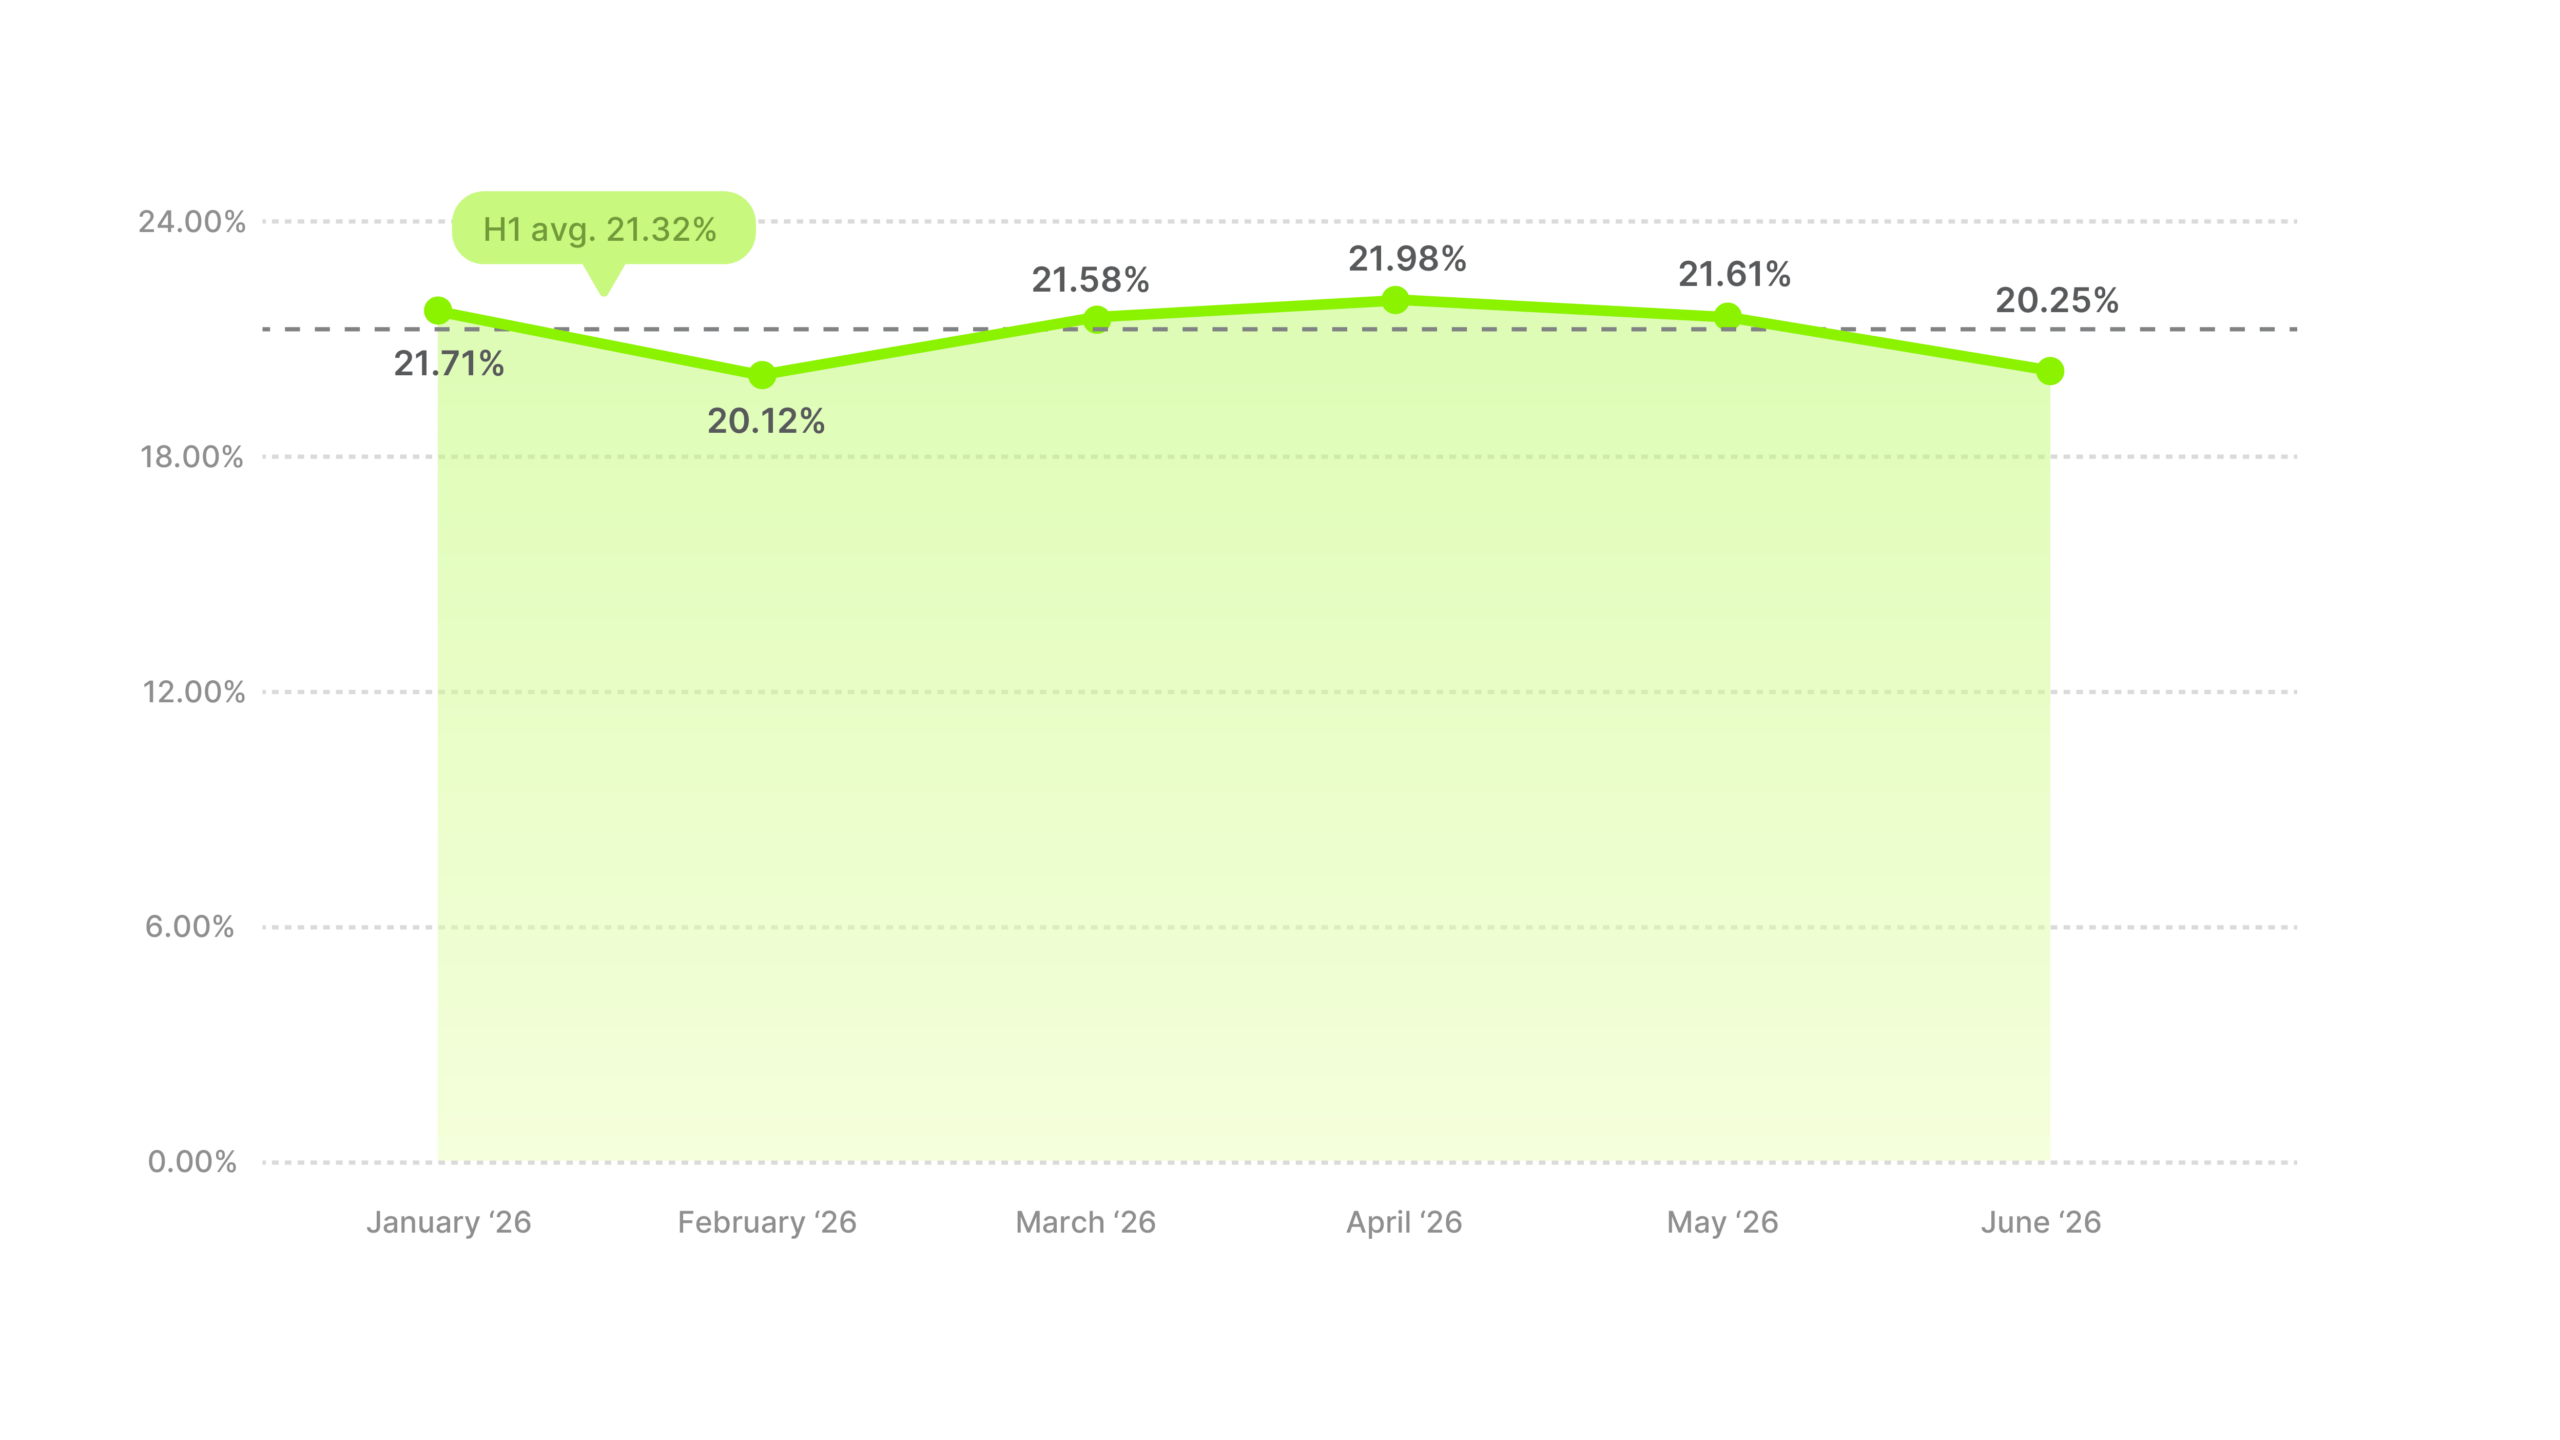
Nothing much happened inside the half either. The line stayed in the low 20s from January to June with no clear direction, lowest in February at 20.12% and June at 20.25%.
The floor did move up, from under 20% last half to 21.32% here. Average above 22% and you’re ahead of your category. The cross-industry average of 25.44% is a hard bar to clear.
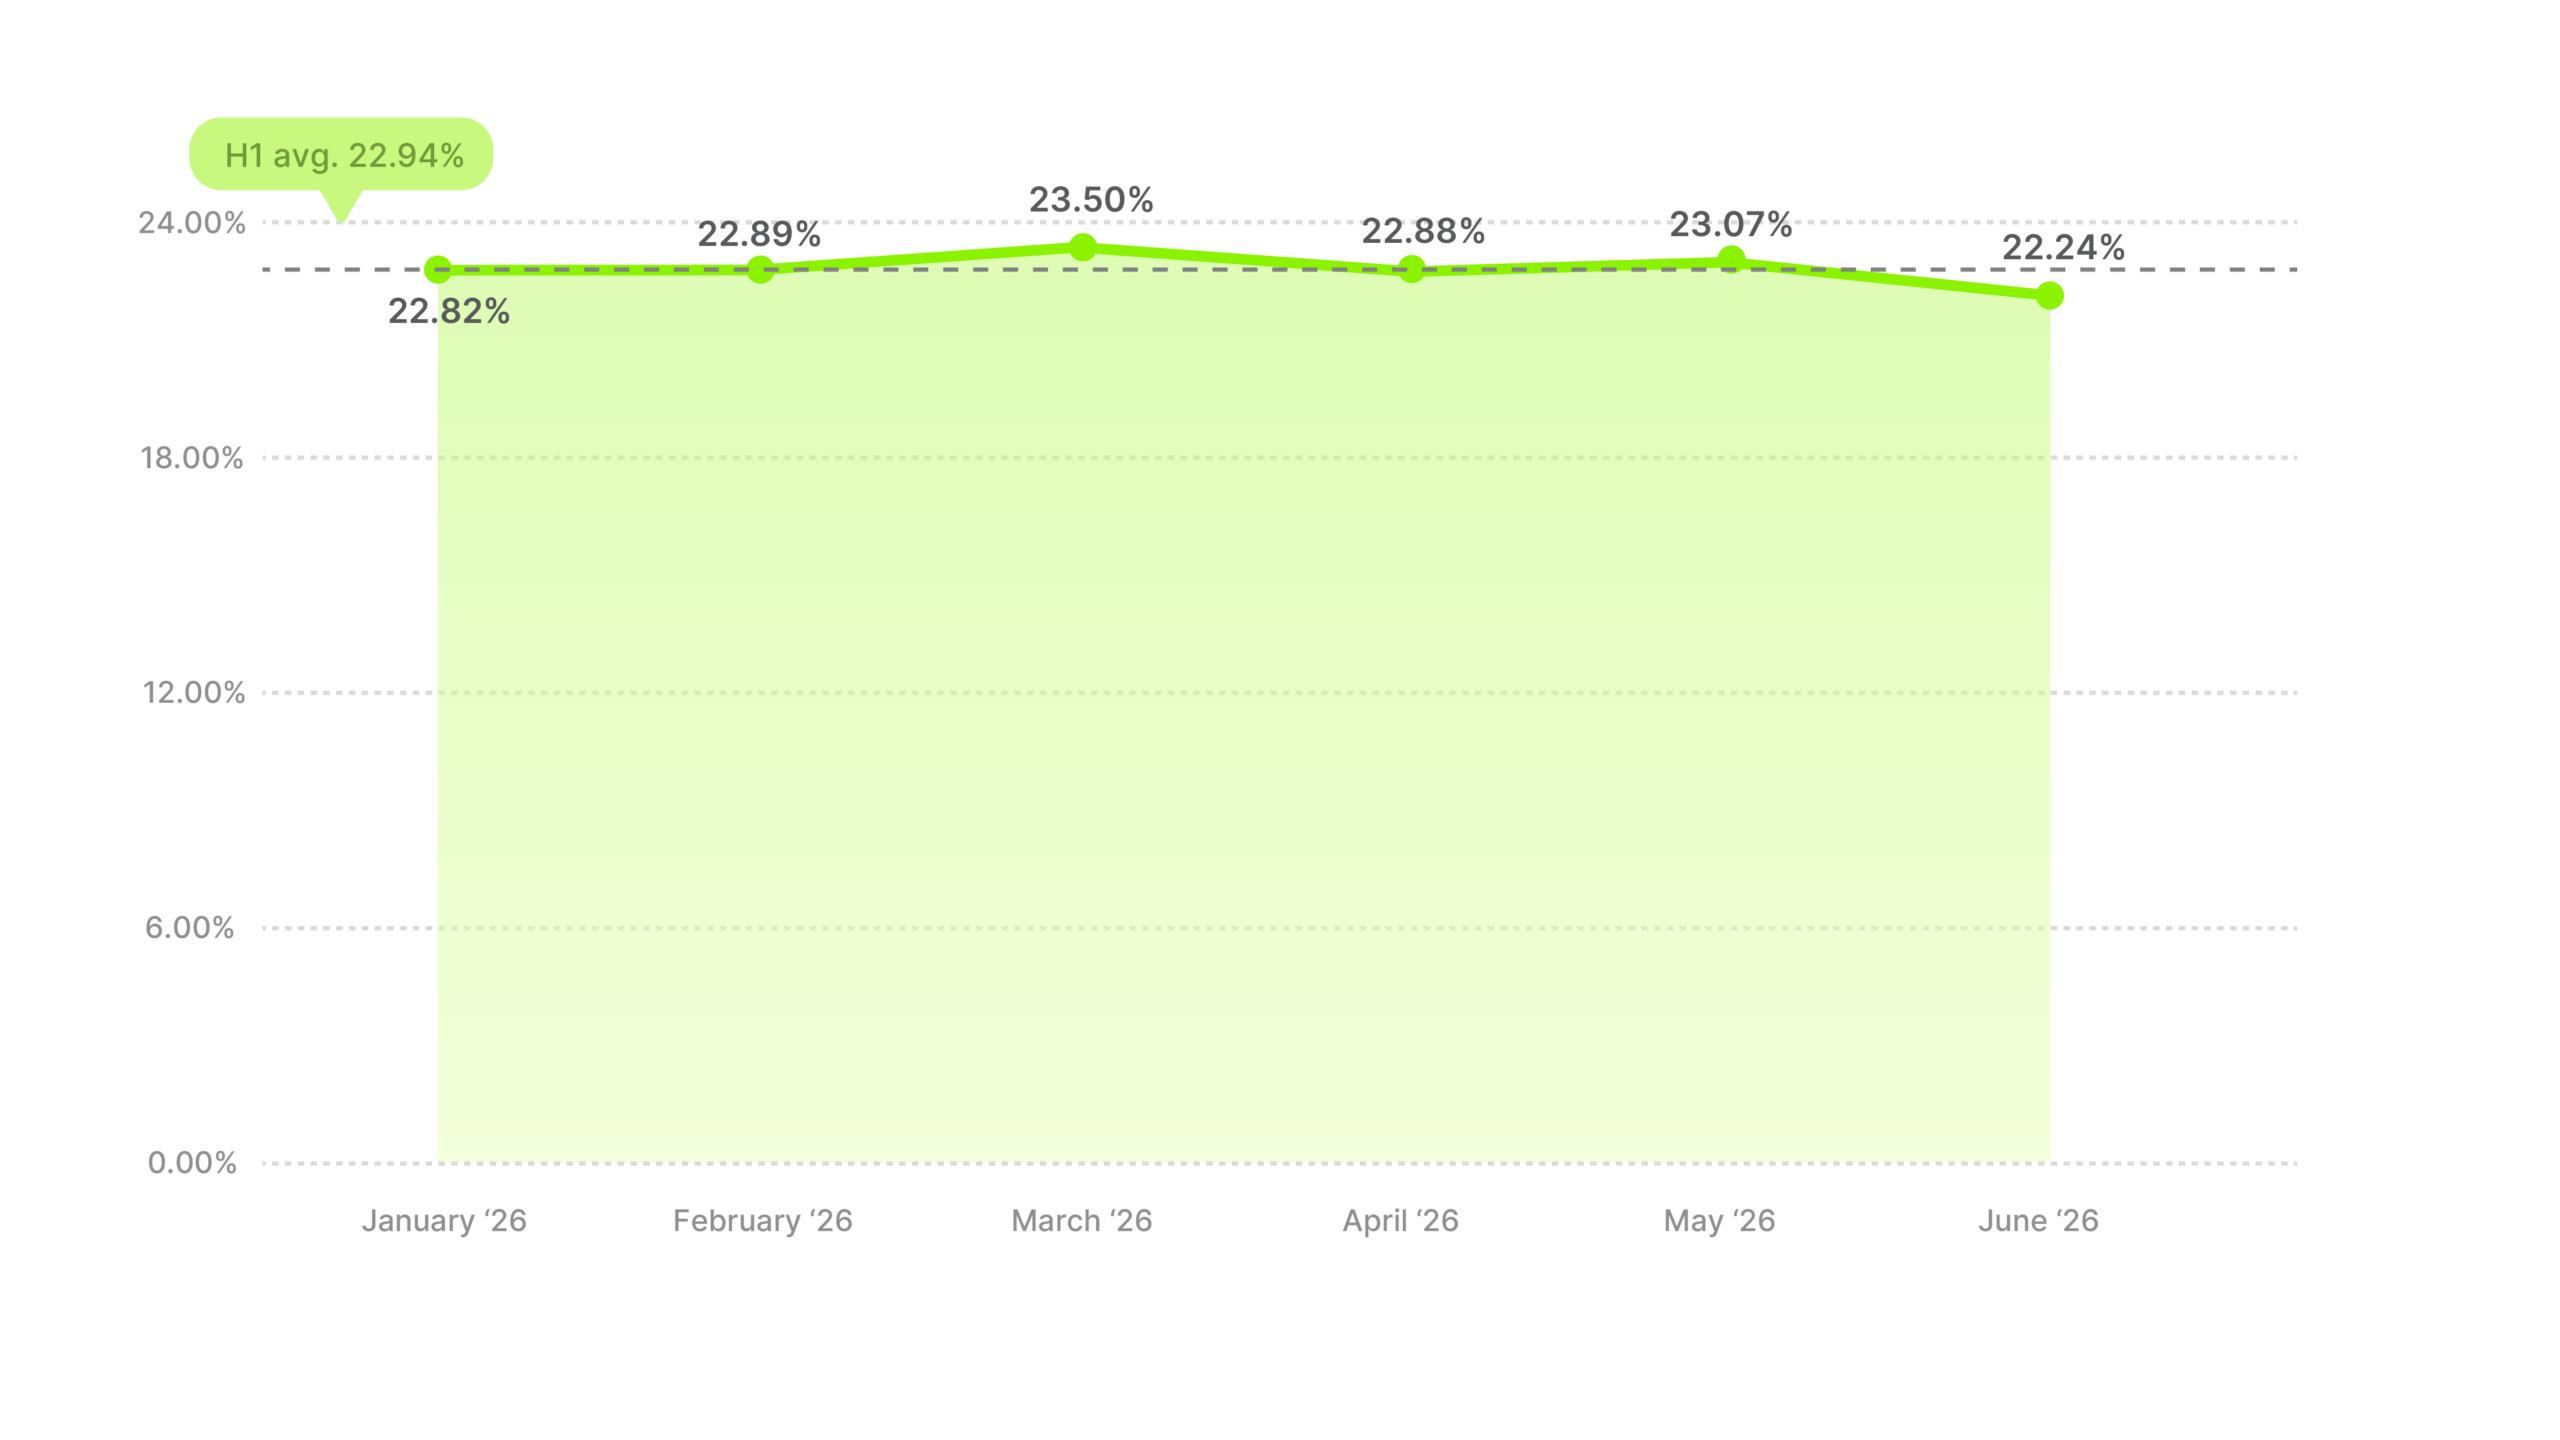
Few categories are more obviously suited to video, and Apparel still spent every month of H1 below the cross-industry average. Clothes on screen don’t buy you three seconds. When every ad in the category opens on the same shot, the format stops working.
Industry hook rate average
Distance from all-industry average
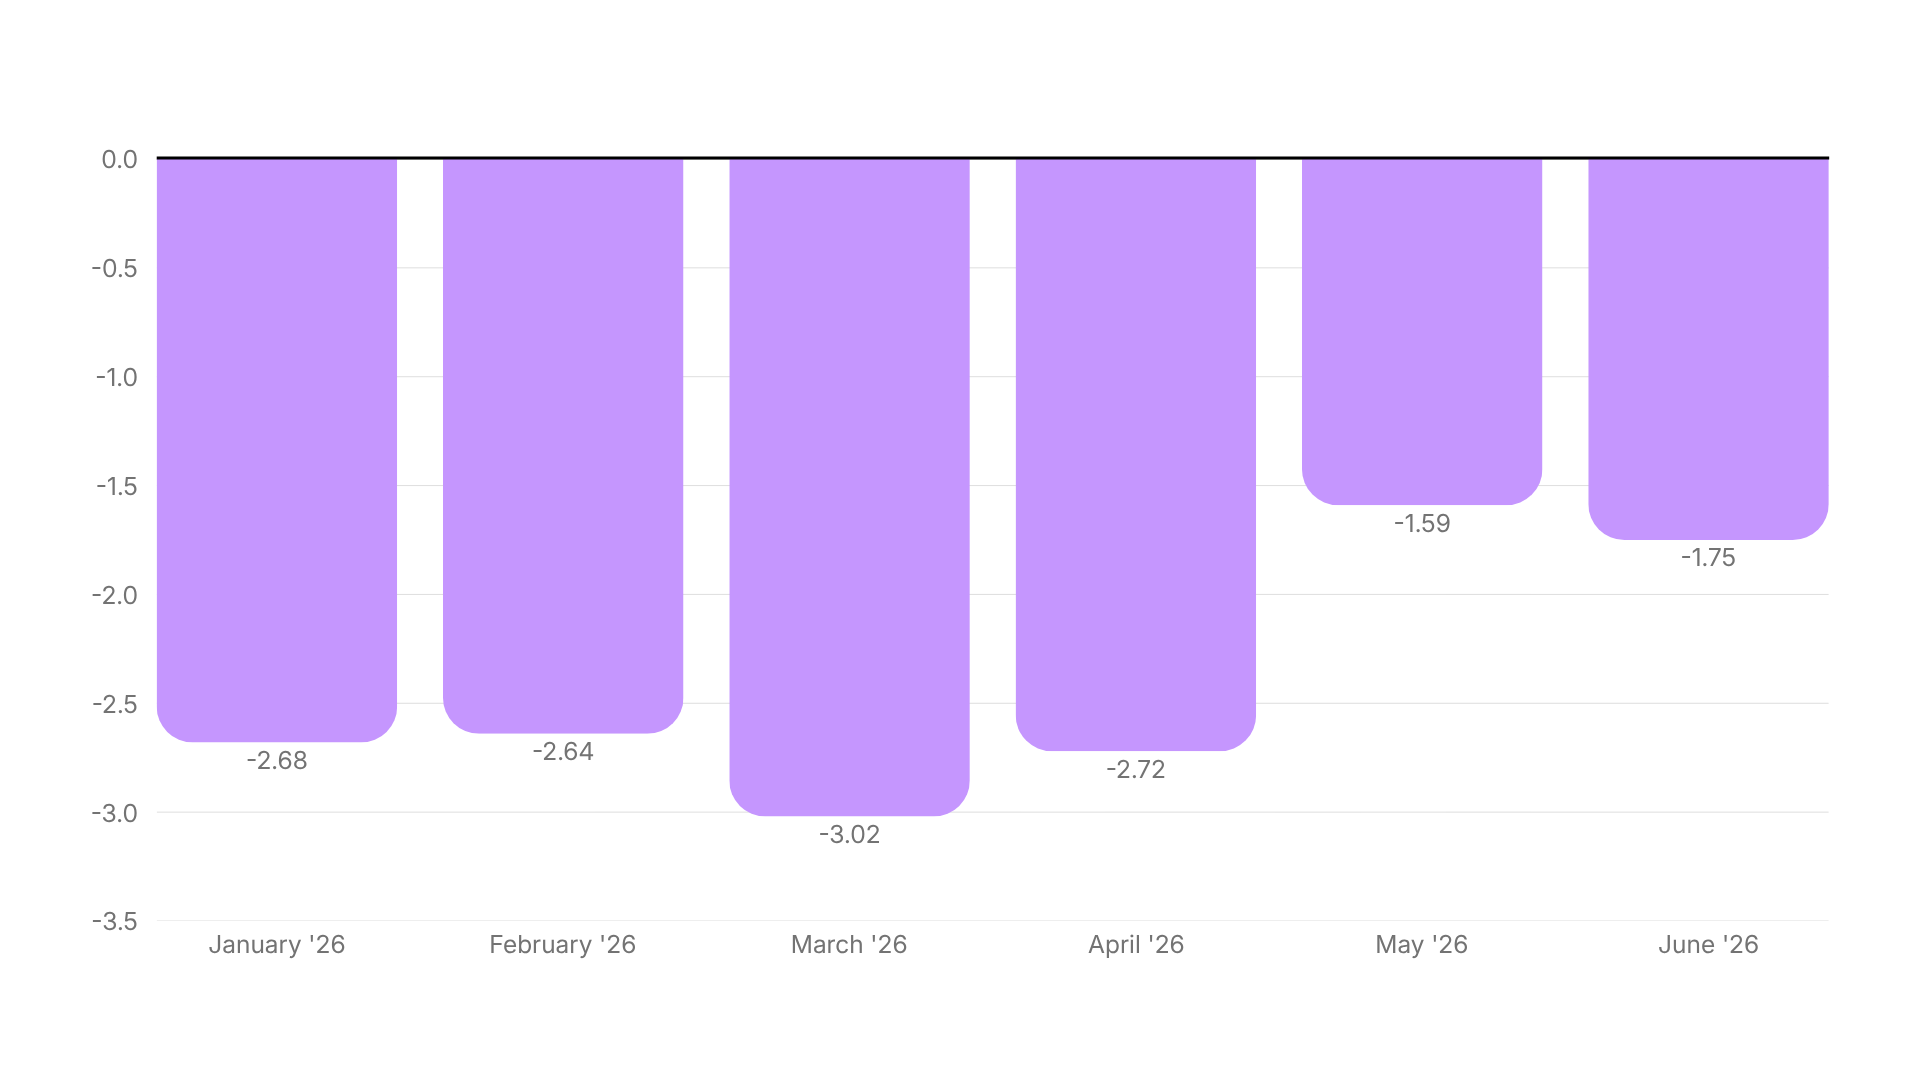
The line barely moved, a 1.26 pp range between the March high of 23.50% and the June low of 22.24%. No trend, no seasonal moment, nothing that stood apart.
Last half told a different story. H2 2025’s whole Apparel narrative was a November spike, when Black Friday intent met the creative halfway. H1 has no such moment on the calendar, so the creative ran unassisted, and 22.94% is what it was worth on its own.
That puts the upside squarely in differentiation, and the variable you control is the opening frame. The garment in motion, the fit problem it solves, the texture up close, the getting-ready shot instead of the finished look – rotate which one opens the ad, and keep exploring new angles.
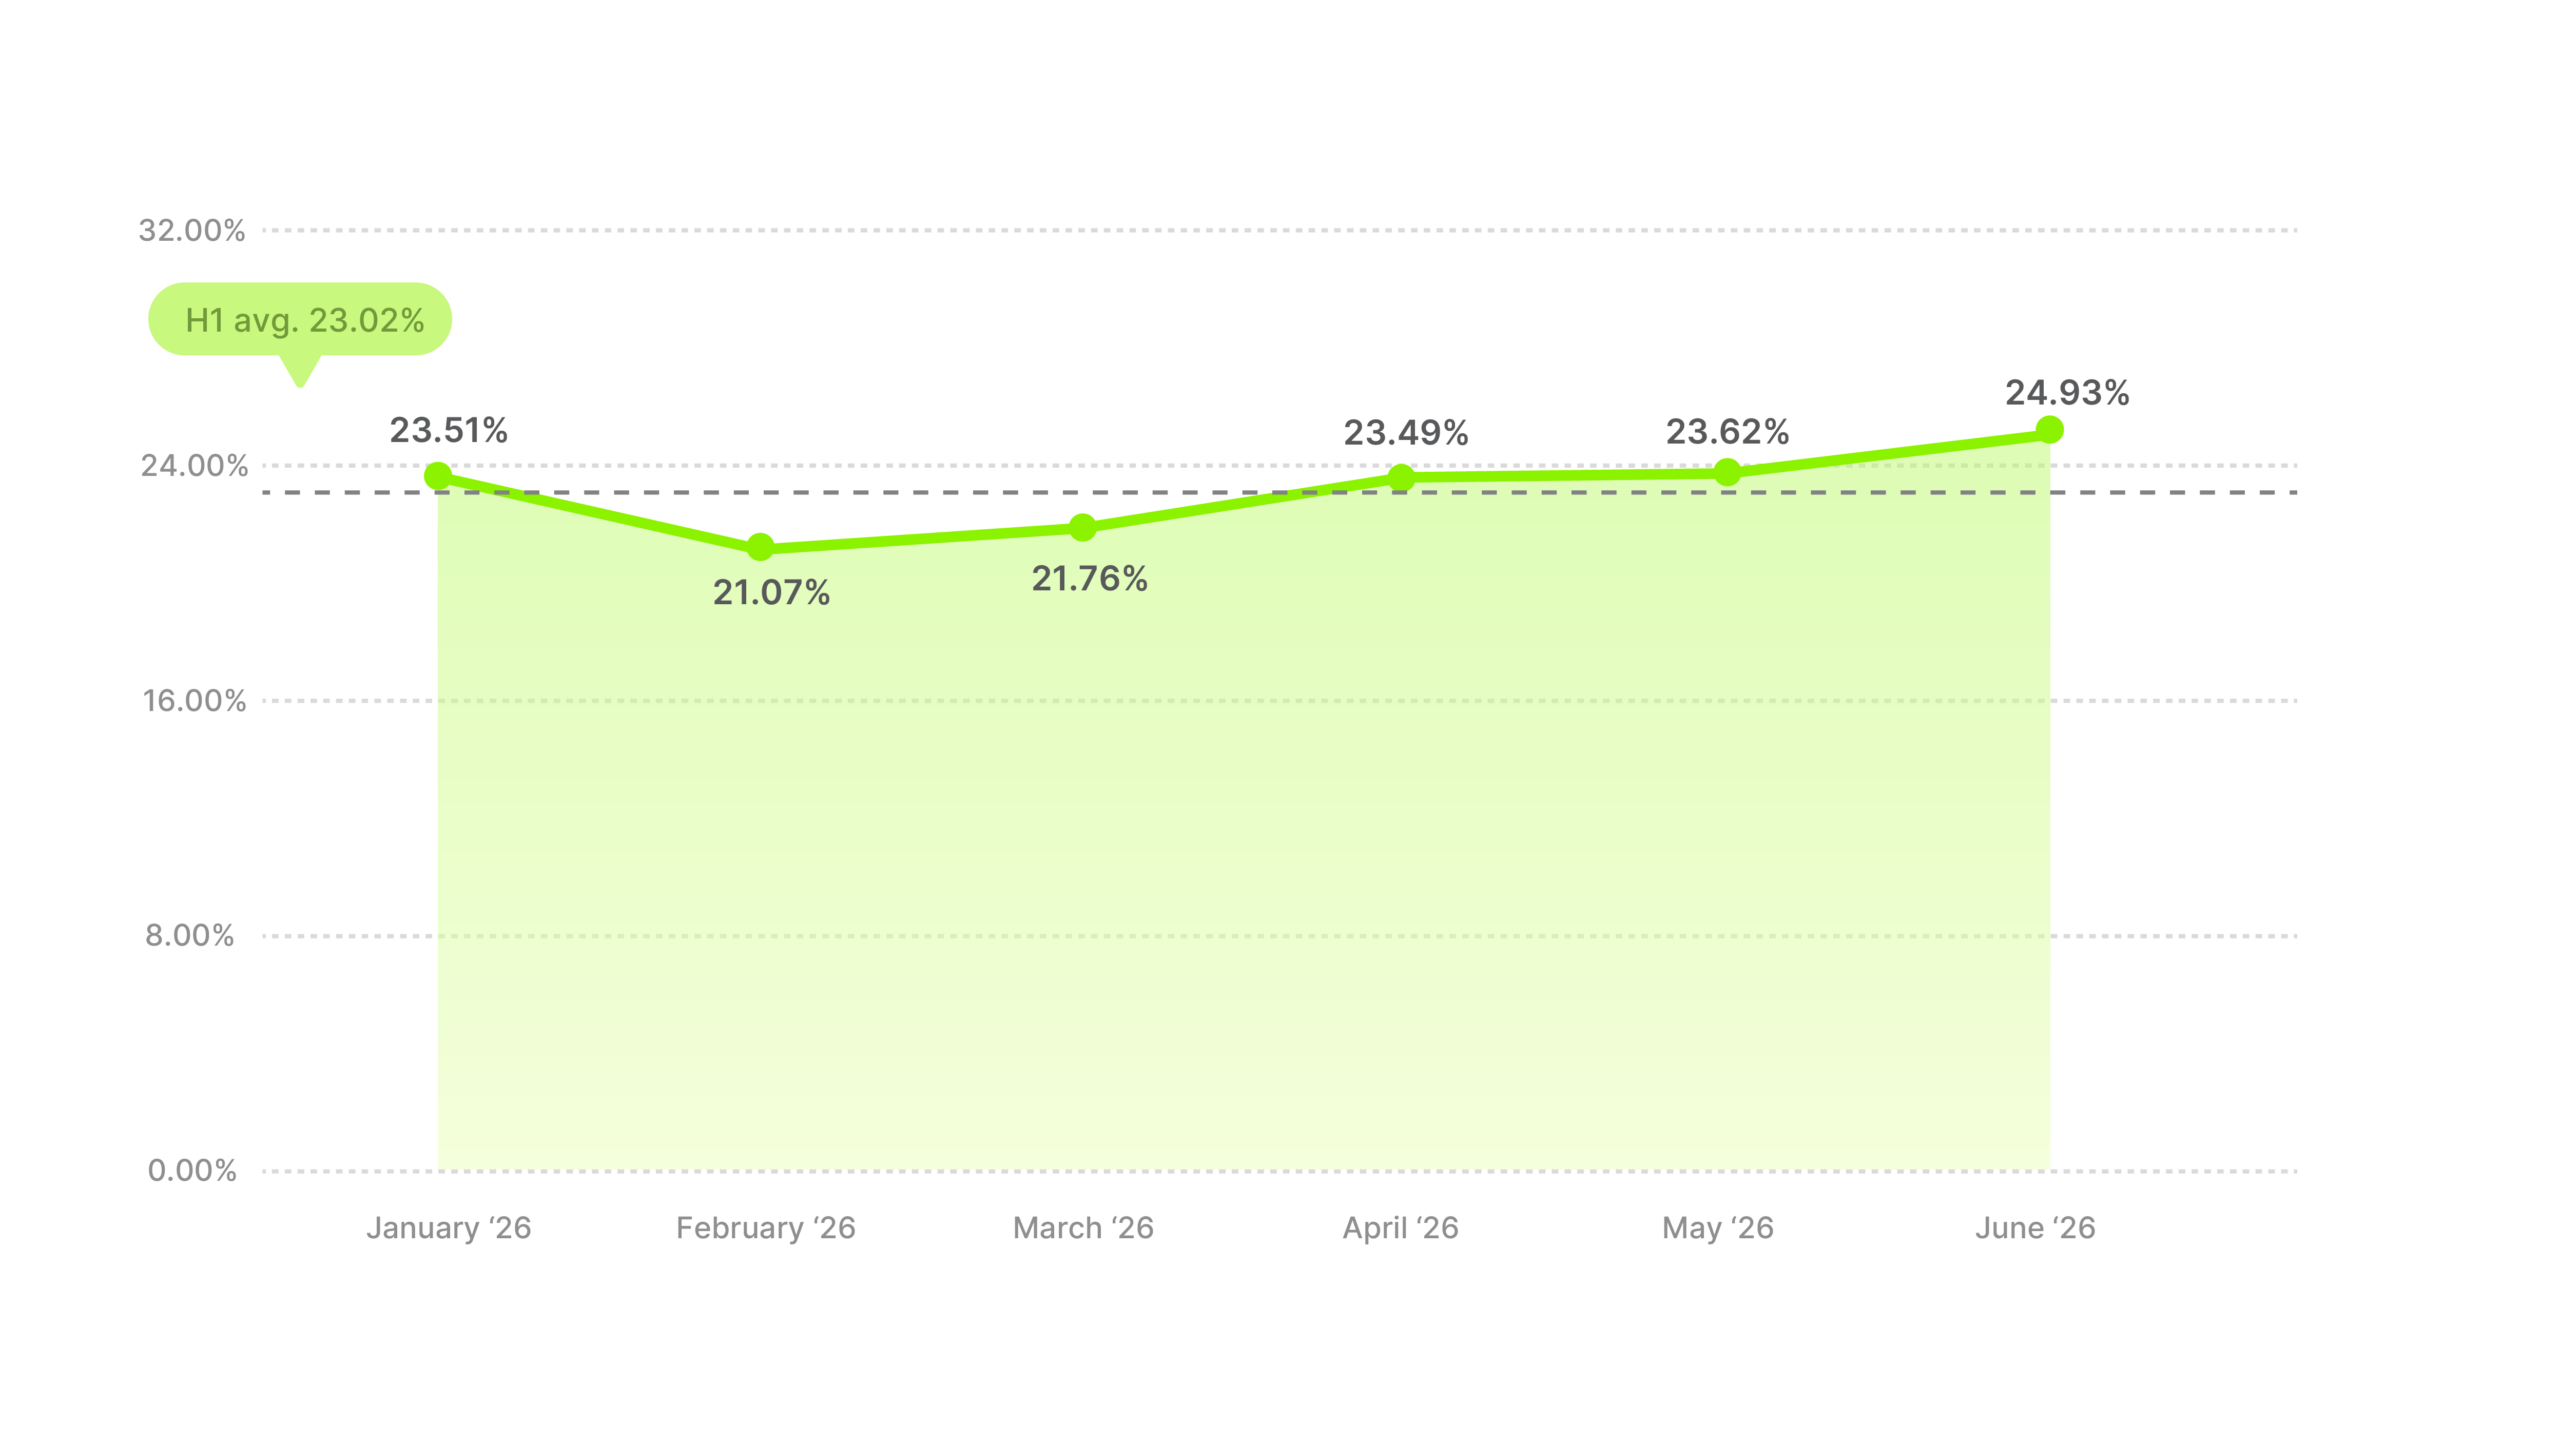
Forget the average on this one and look at the curve. January opened about 2 pp under the cross-industry average at 23.51%, then February and March fell to a low between 4.4 and 4.8 pp below it. From there the line rose four months straight, finishing at 24.93% in June.
Industry hook rate average
Distance from all-industry average
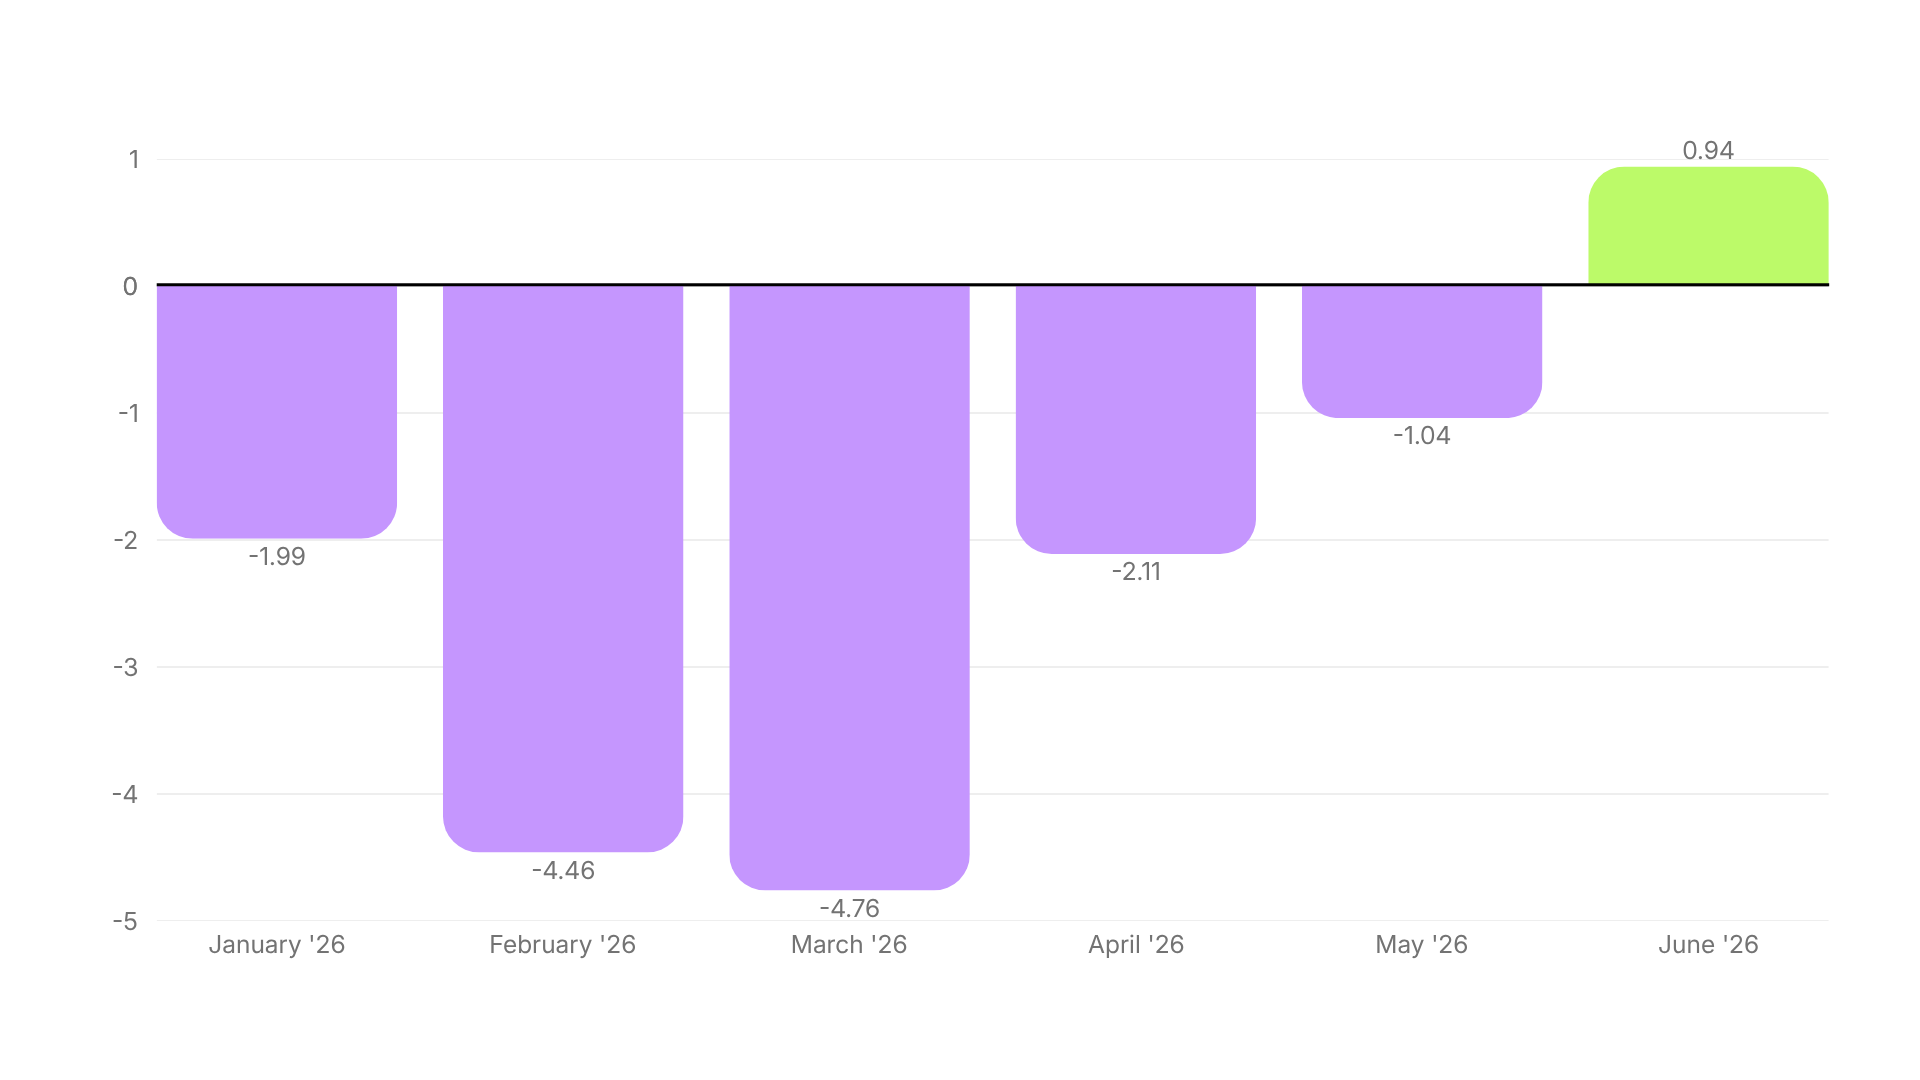
June was its only month above the cross-industry average all half, and its highest reading. It was also the month that average bottomed out, so this category was rising while most others fell.
Content timing is the likely reason. A quiet late winter turned into the spring and summer release season, with bigger releases, festivals and tours pulling attention up through the back half. If your launches can track your release calendar, that timing probably matters more here than in most categories.
Set against last half the level looks worse, 23.02% now versus 25.07% then. Direction is the more useful signal, because this category entered H2 improving while most others were declining. Benchmark around 23%, and give the trajectory more weight than the average.
The shape followed the overall market and stayed below it. A mild rise to 23.91% in March, then a 2 pp decline between April and June that left the category at its lowest reading of the half.
Industry hook rate average
Distance from all-industry average
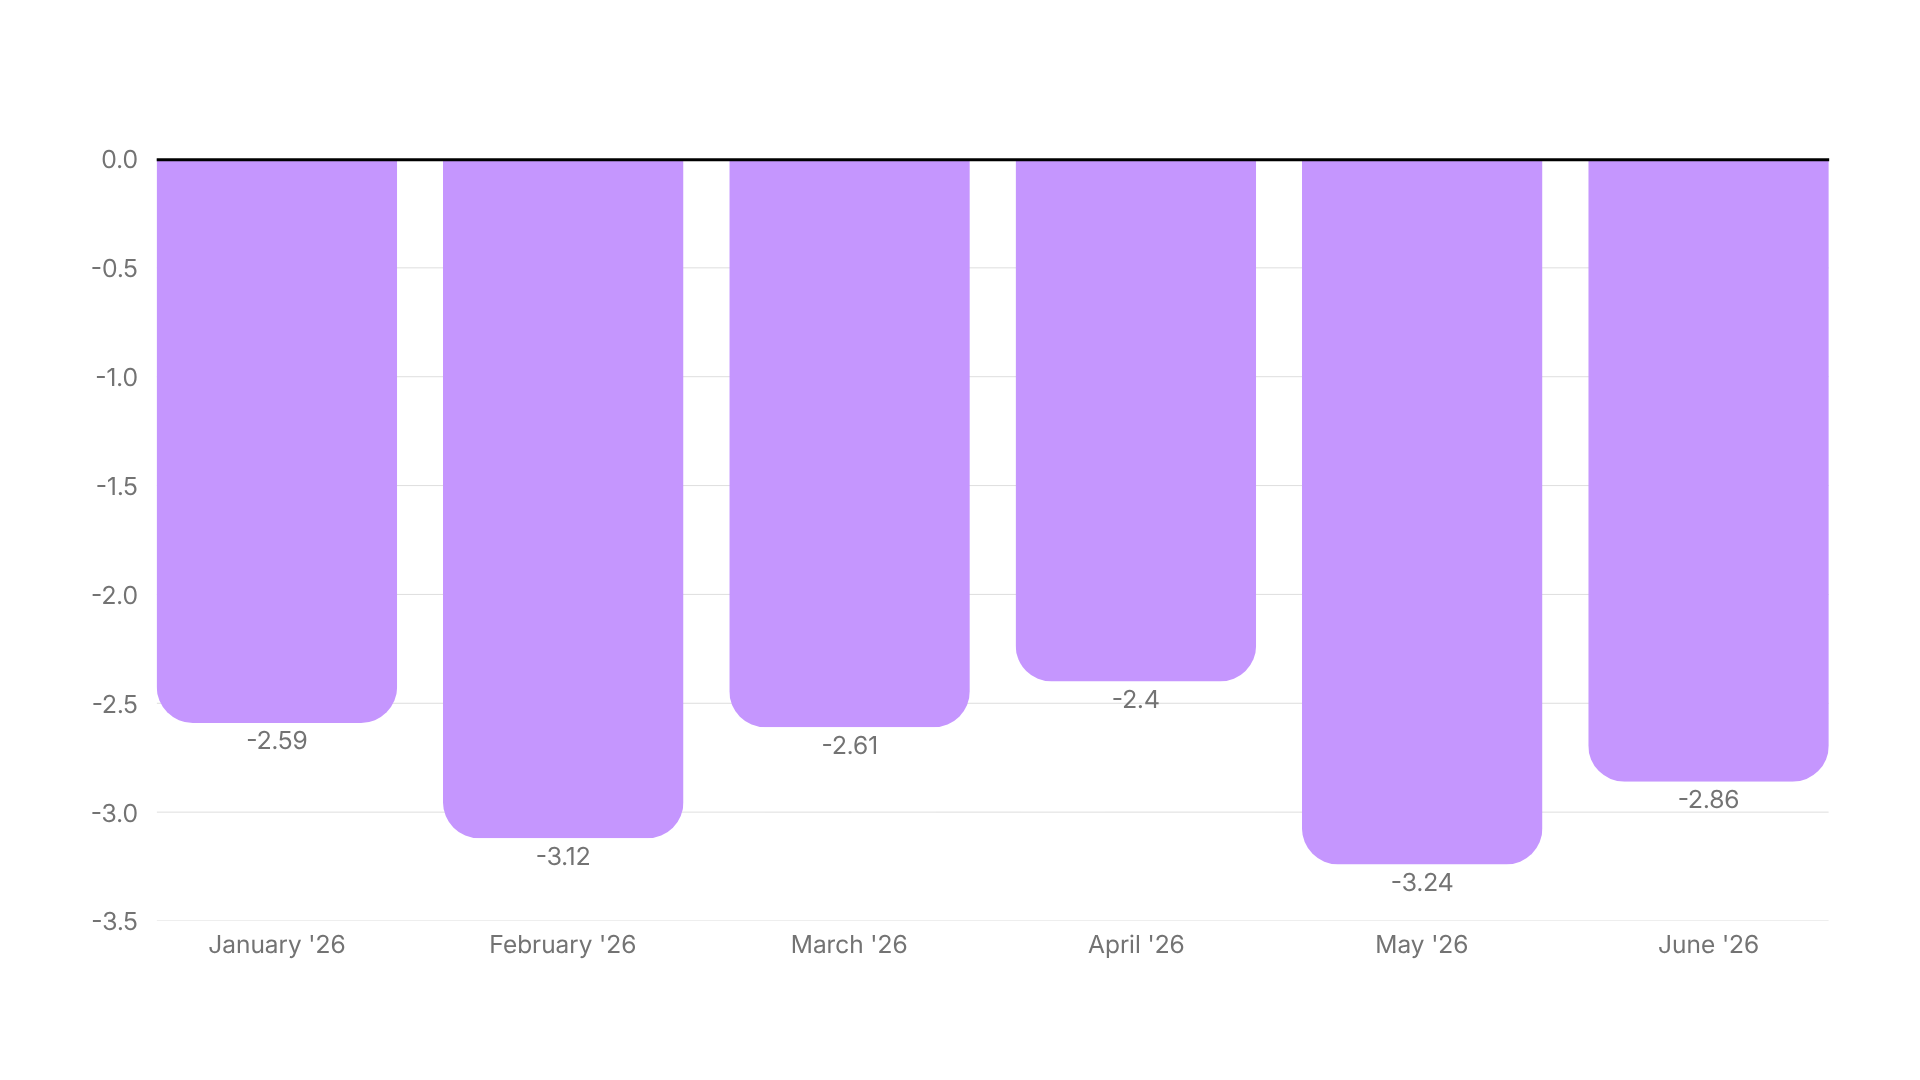
Nothing has changed structurally since last half. Diapers, formula and wipes get bought when the cupboard’s empty, not because an ad earned a second look, and that limits how high the category’s hook rate can realistically go.
What it lacked was an occasion. Arts & Entertainment had a release season; Sporting Goods had spring; Baby & Toddler had nothing equivalent on the H1 calendar. Once the January creative went stale, the line drifted down.
It tracked the cross-industry average almost exactly last half at 24.52% and fell below it this half, though the decline belongs to Q2 rather than the whole half. Benchmark between 22% and 23%, and treat the monthly figures loosely, because this category runs on roughly 300 ads a month.
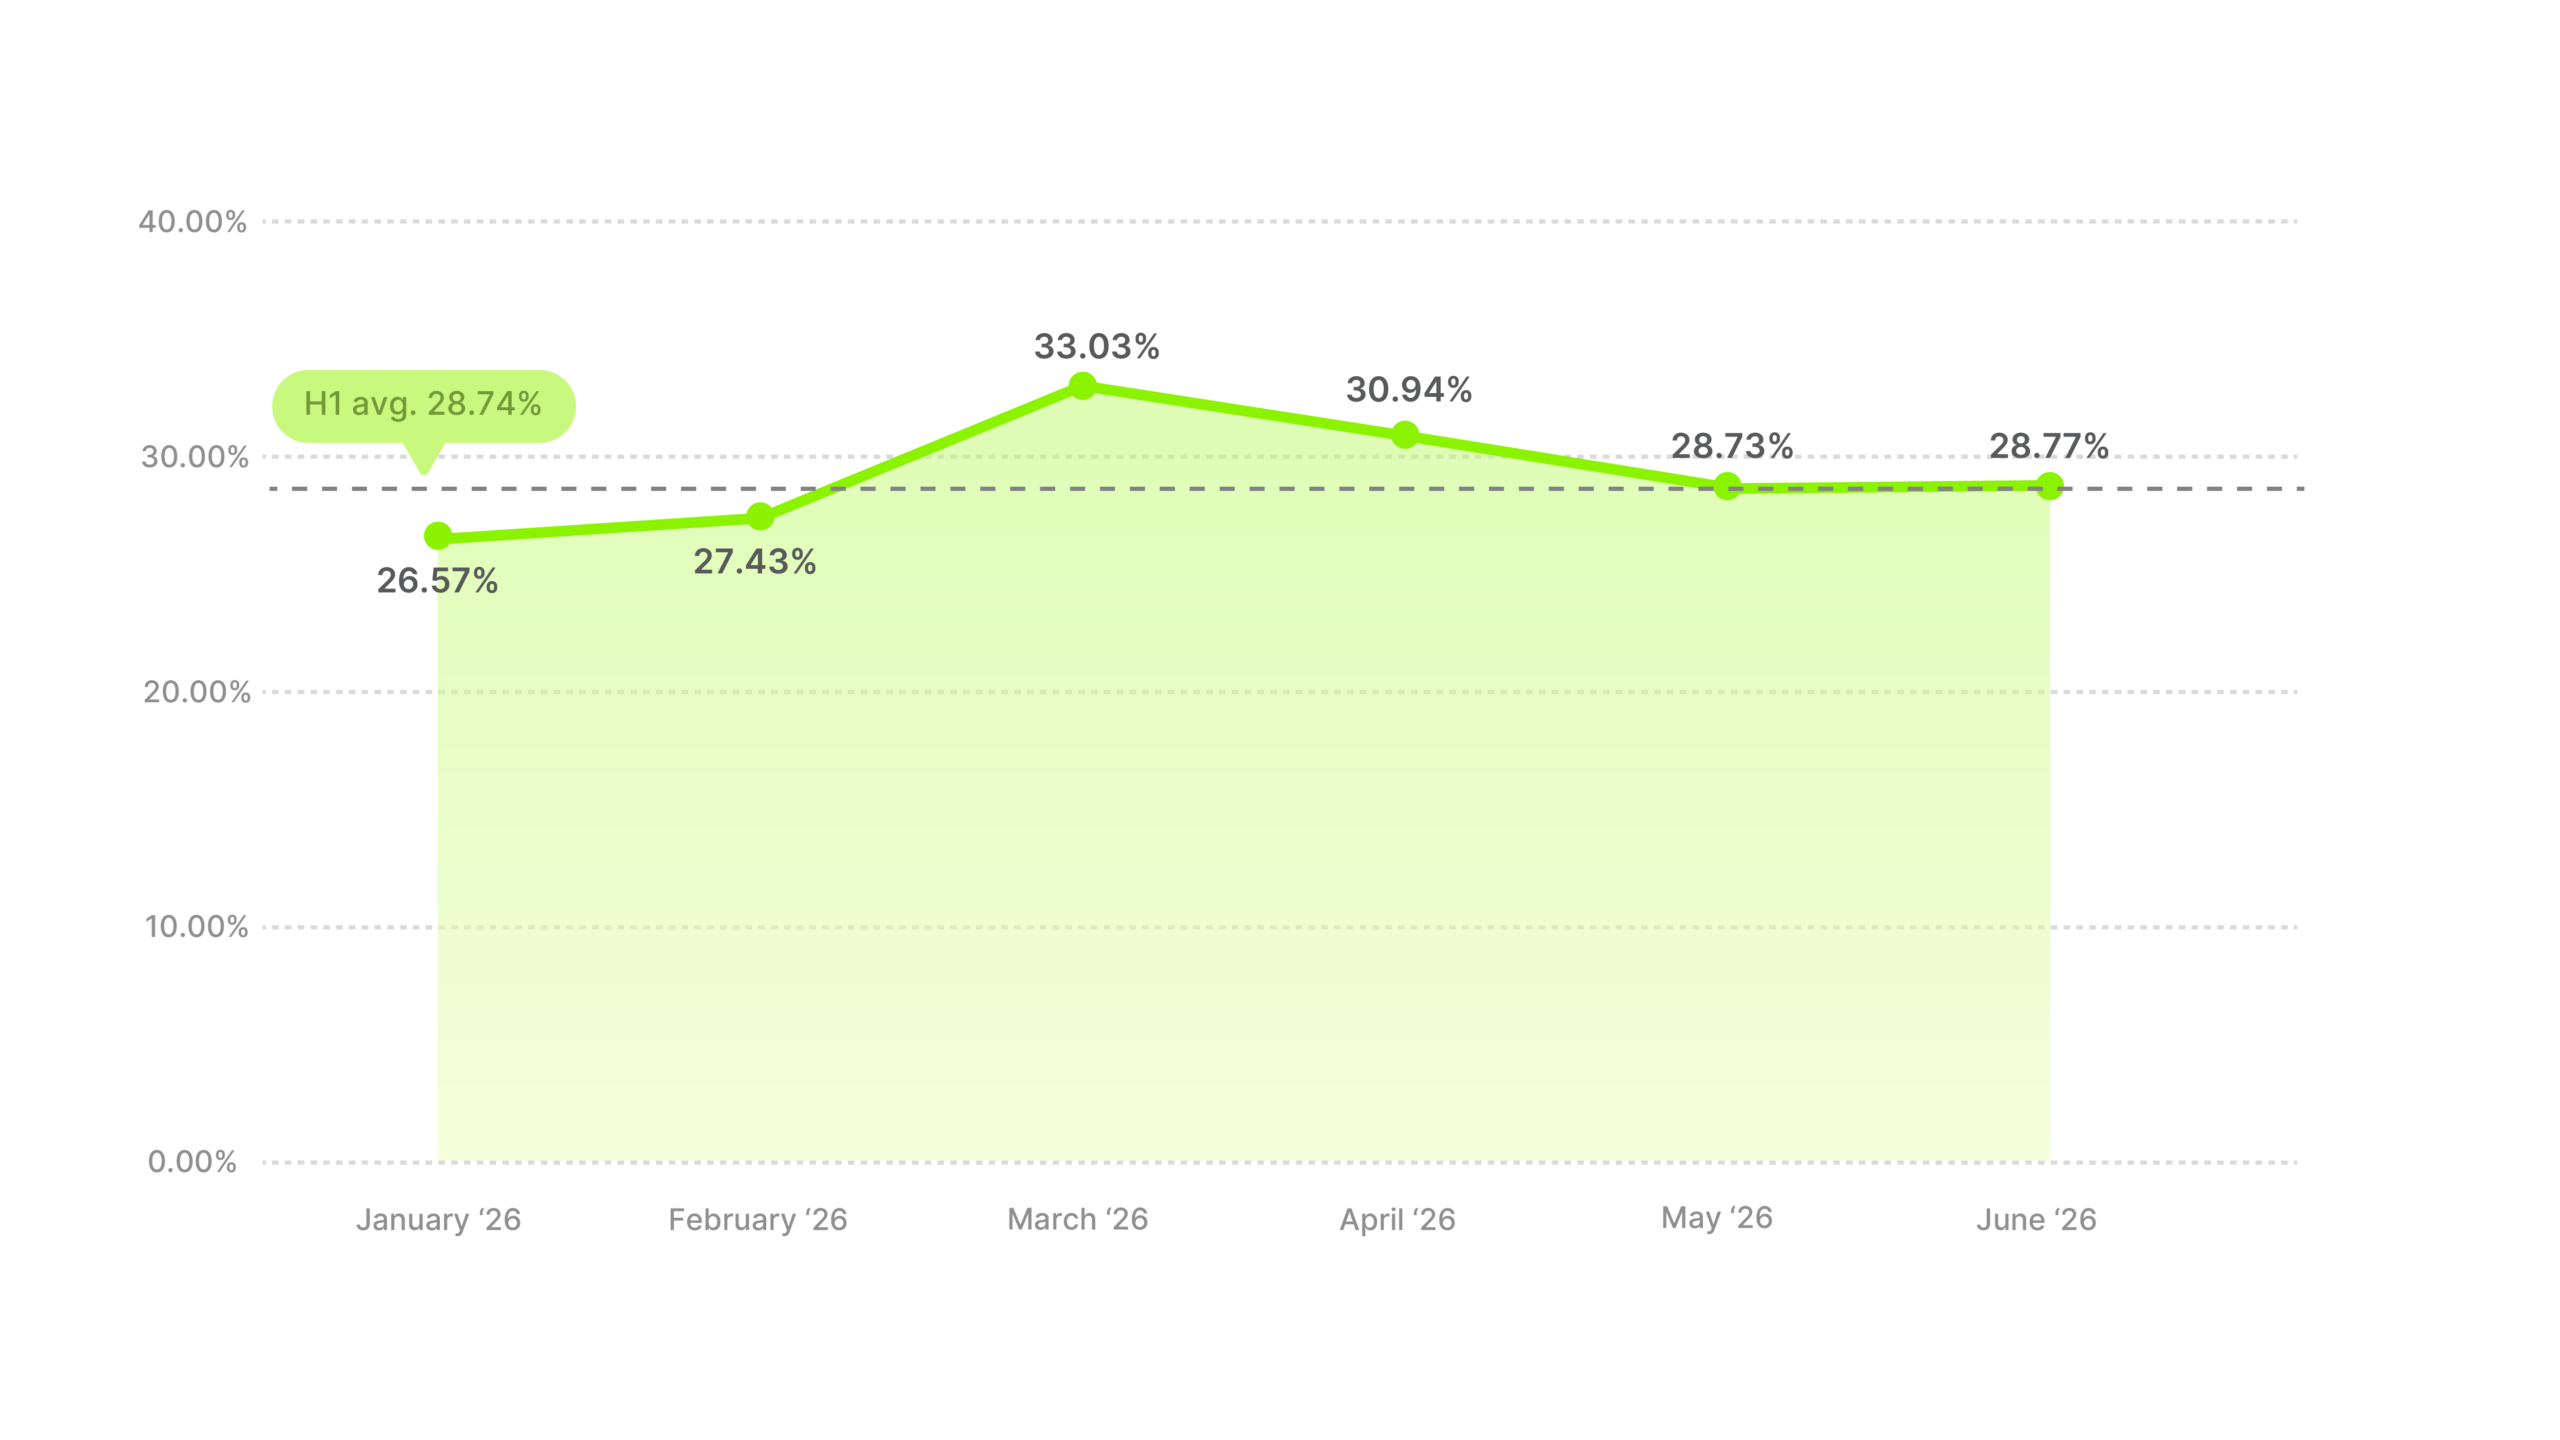
March reached 33.03%, the highest single month any category recorded in this dataset. Business & Industrial also stayed above the cross-industry average in all six months, and the margin grew from about a point in January to more than five by spring. The idea that the category is too dry to work on social doesn’t hold up.
Industry hook rate average
Distance from all-industry average
It’s the most consistent counter-trend in the data too. The cross-industry average fell through Q2 while this one held above 28% every month from March on. Whatever pulled attention out of the feed in the back half, this category never felt it.
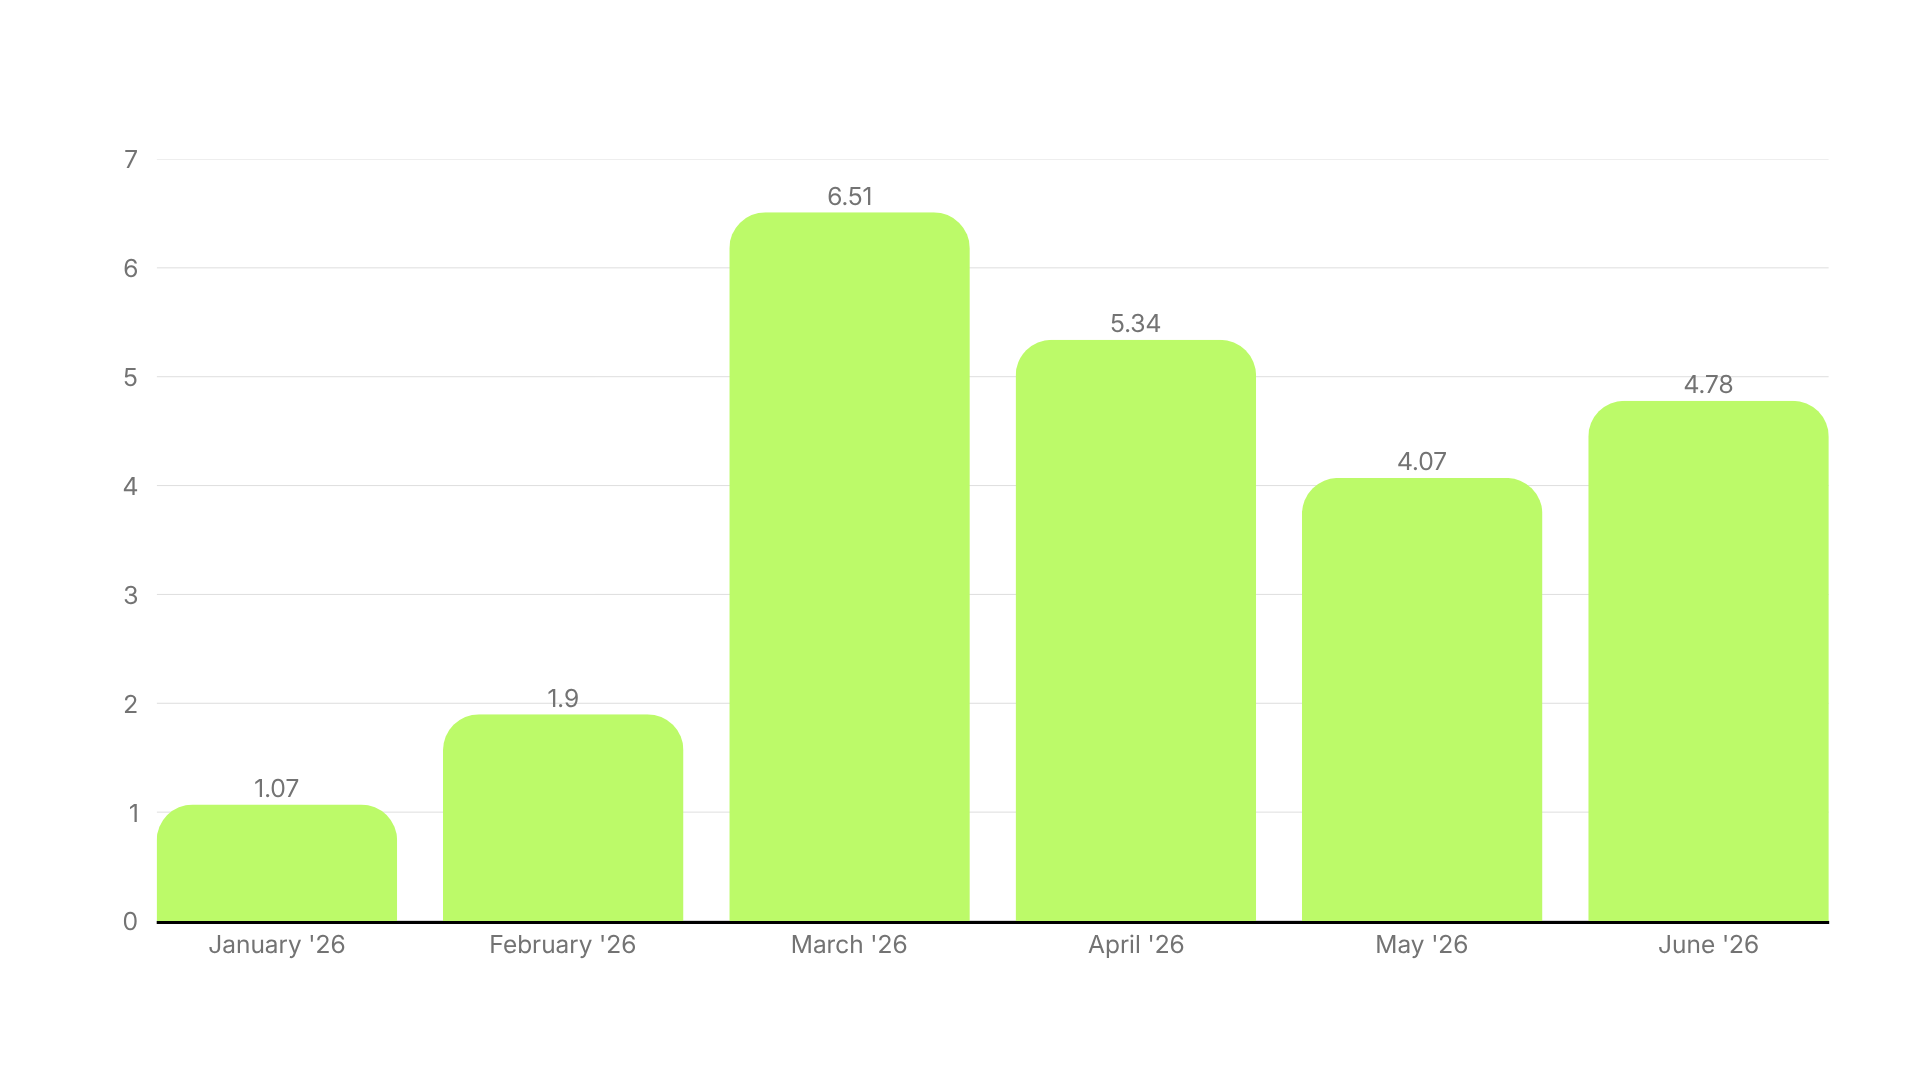
Look at the ad counts and a reason appears. Volume halved between January and June. January and February were this category’s two weakest months, and hook rate peaked at 33.03% in March once the January rush cleared.
So the Q1 crowd has the timing backwards. The advantage went to whoever was still running once the feed cleared, and if you’re planning your video budget in this category, this data argues against spending it all in Q1 and going quiet.
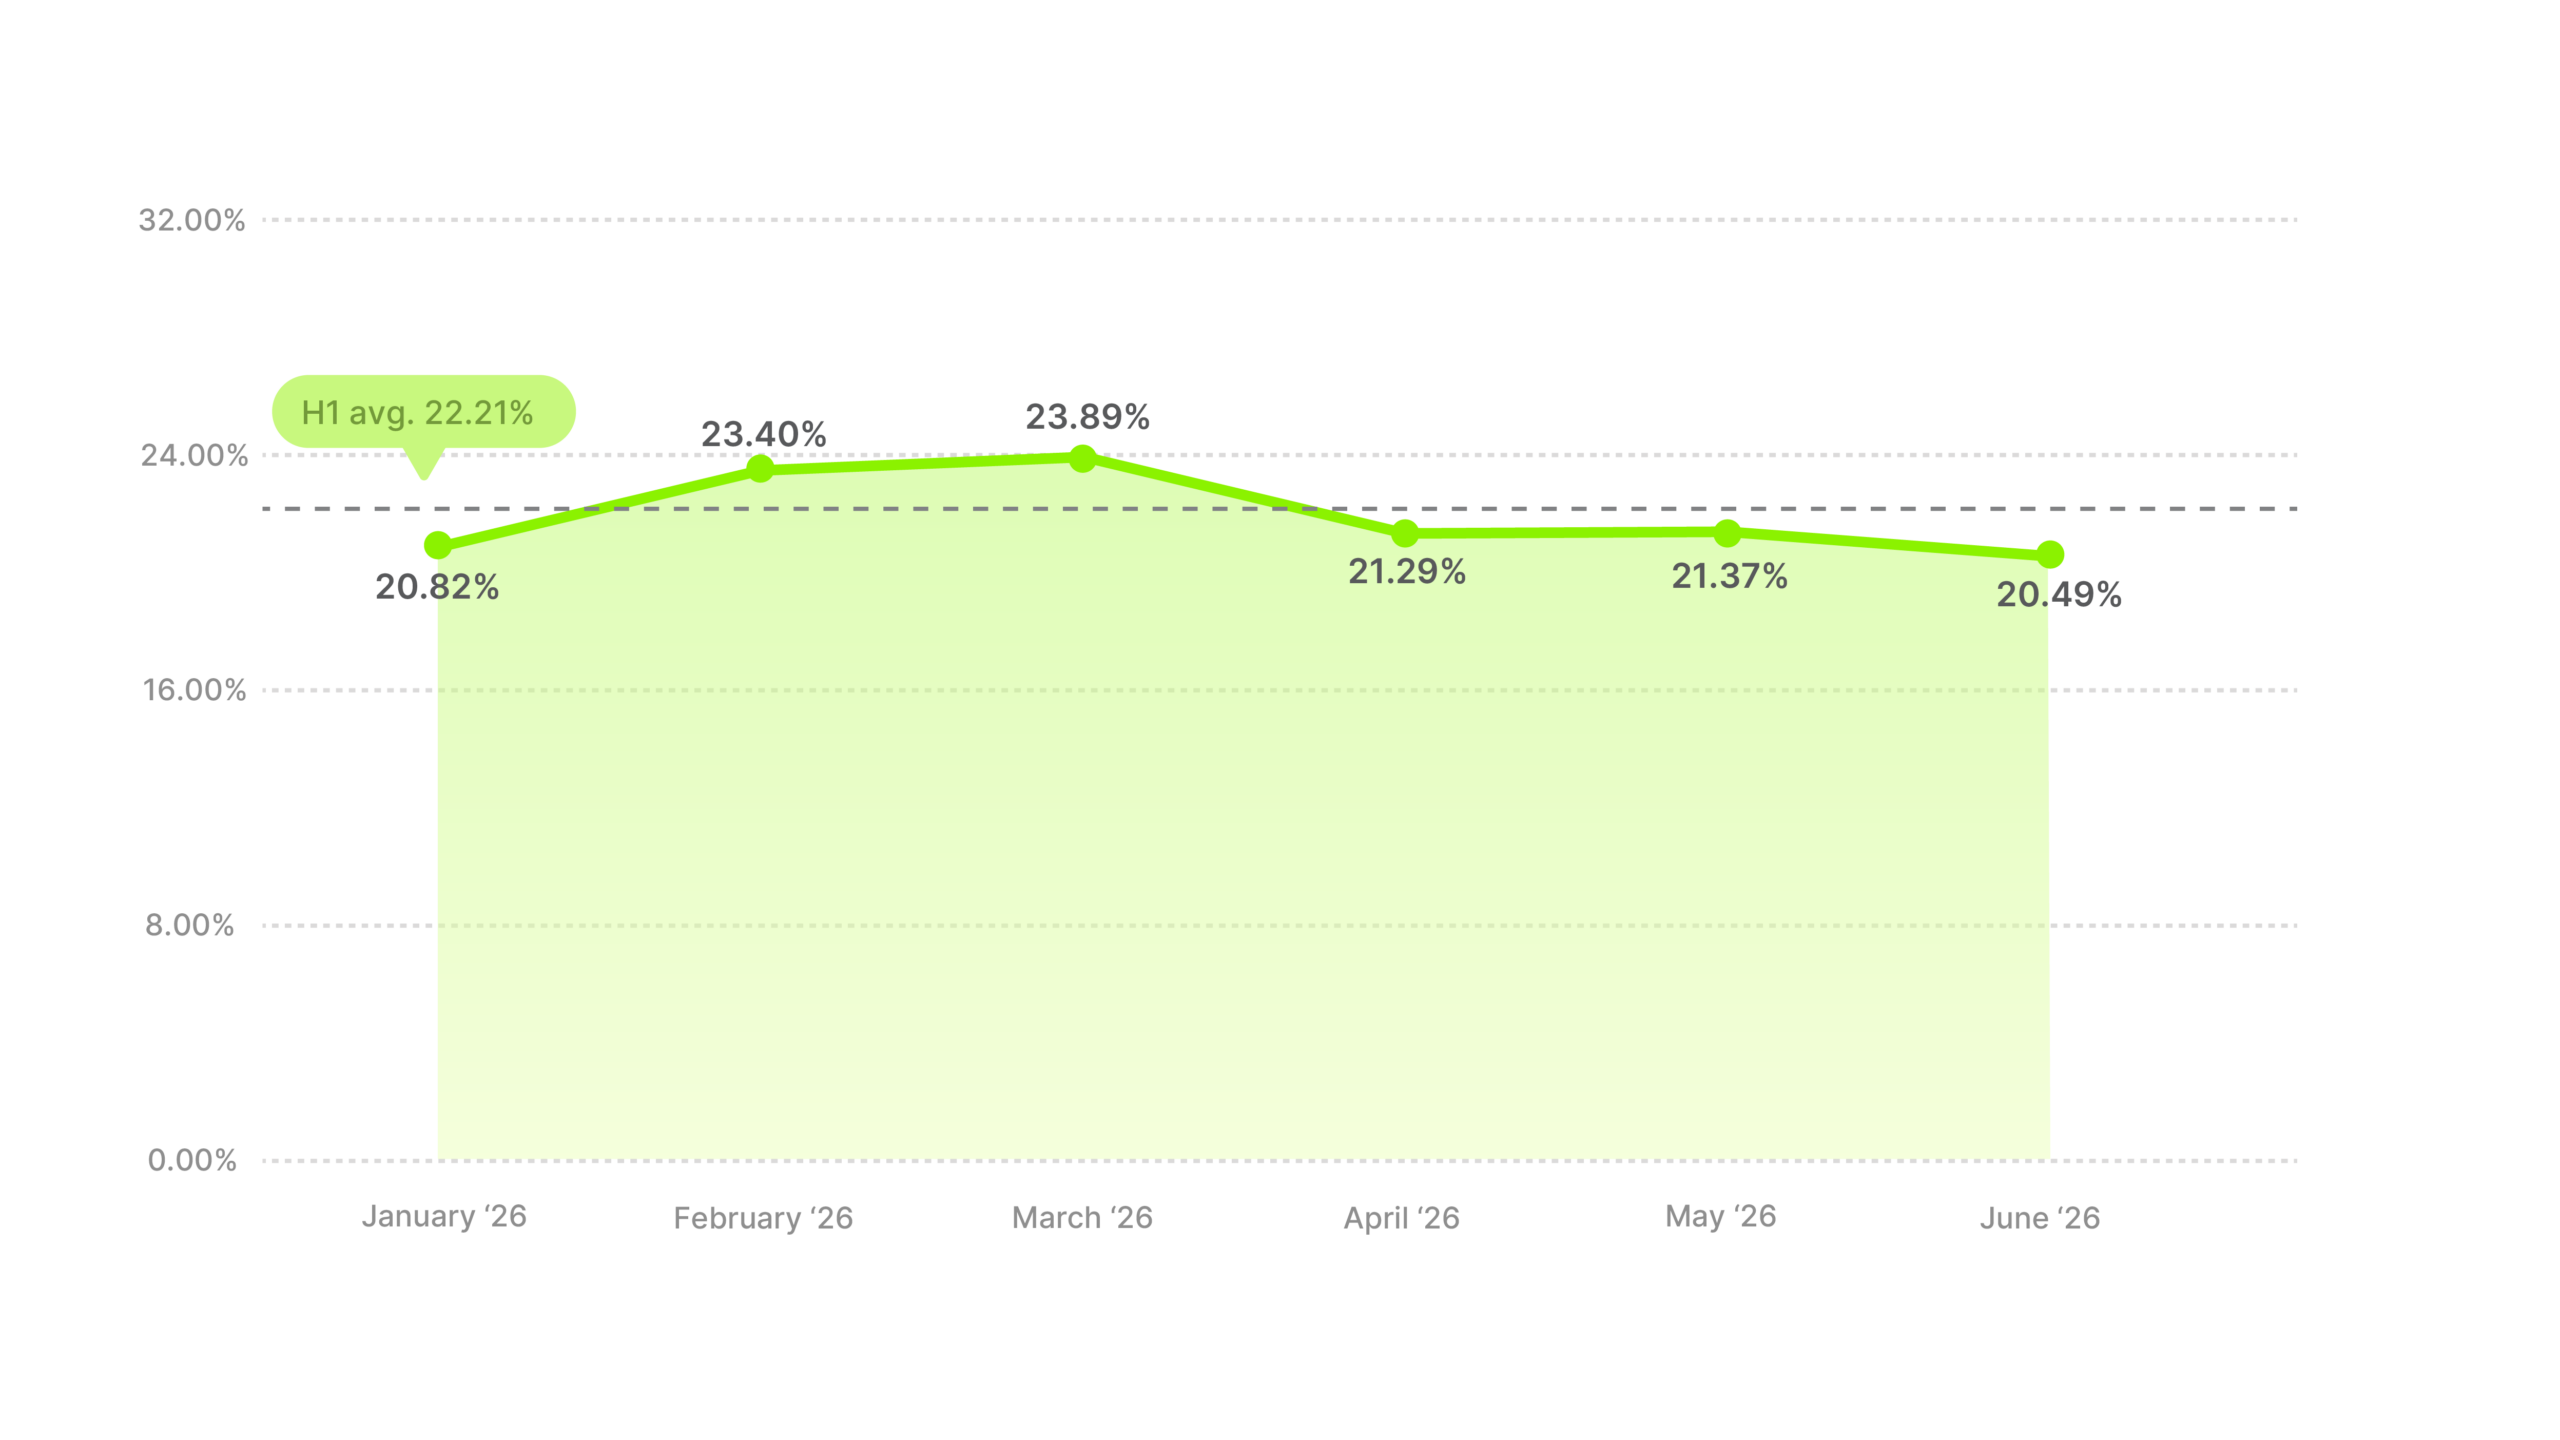
Electronics stayed near the bottom in every month, running from 20.49% at its lowest to 23.89% at its highest, with the stronger readings in late Q1 and the weakest at either end of the half.
Industry hook rate average
Distance from all-industry average
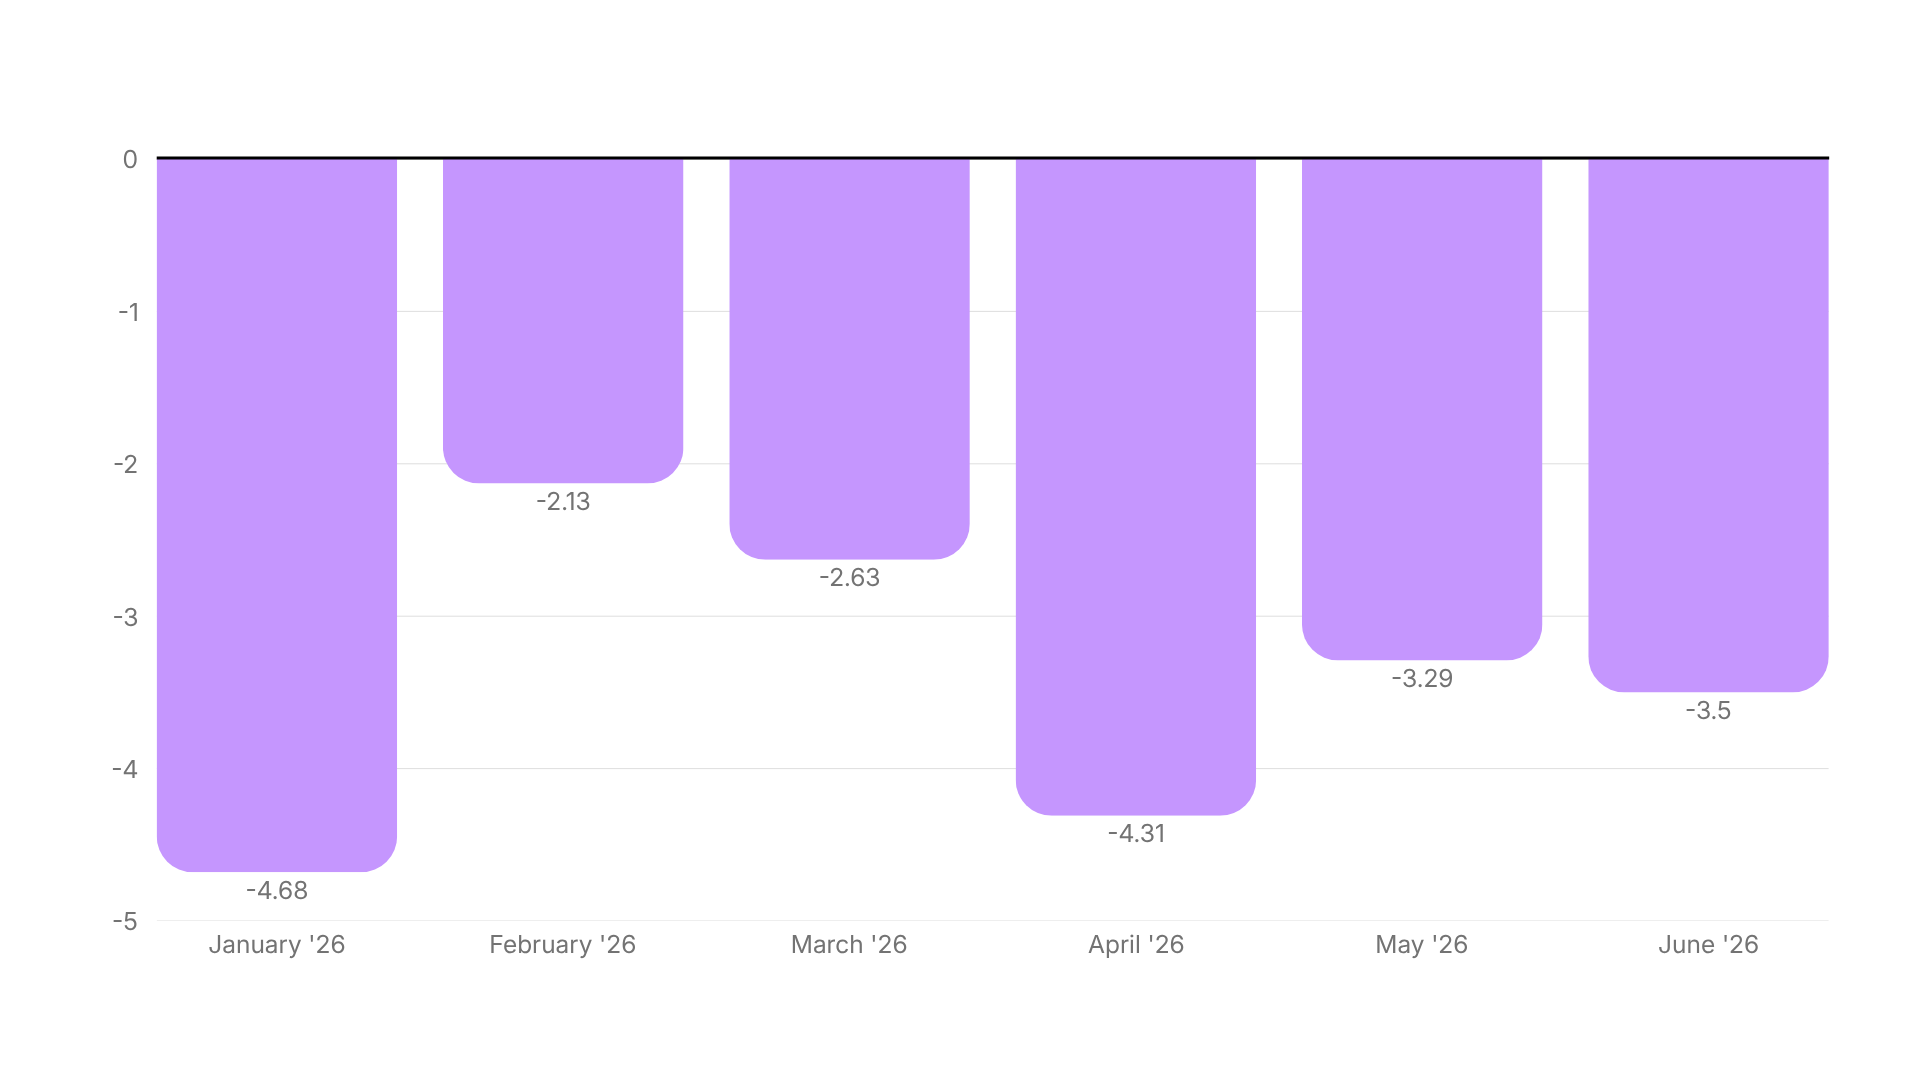
It also declined further than anything else in the report. From 25.00% last half to 22.21% this half is a 2.79 pp drop, the largest of the fourteen, and it moves a mid-table category into the bottom three in six months. Last half’s peak was probably back-to-school demand in August, a window H1 doesn’t contain, so the calendar explains part of the decline.
Sameness accounts for the rest. When the opening frame is a spec reveal or a price cut in every ad, three seconds isn’t enough to tell them apart. Open on the thing working instead, the problem it removes, or the moment it does what the specs promise.
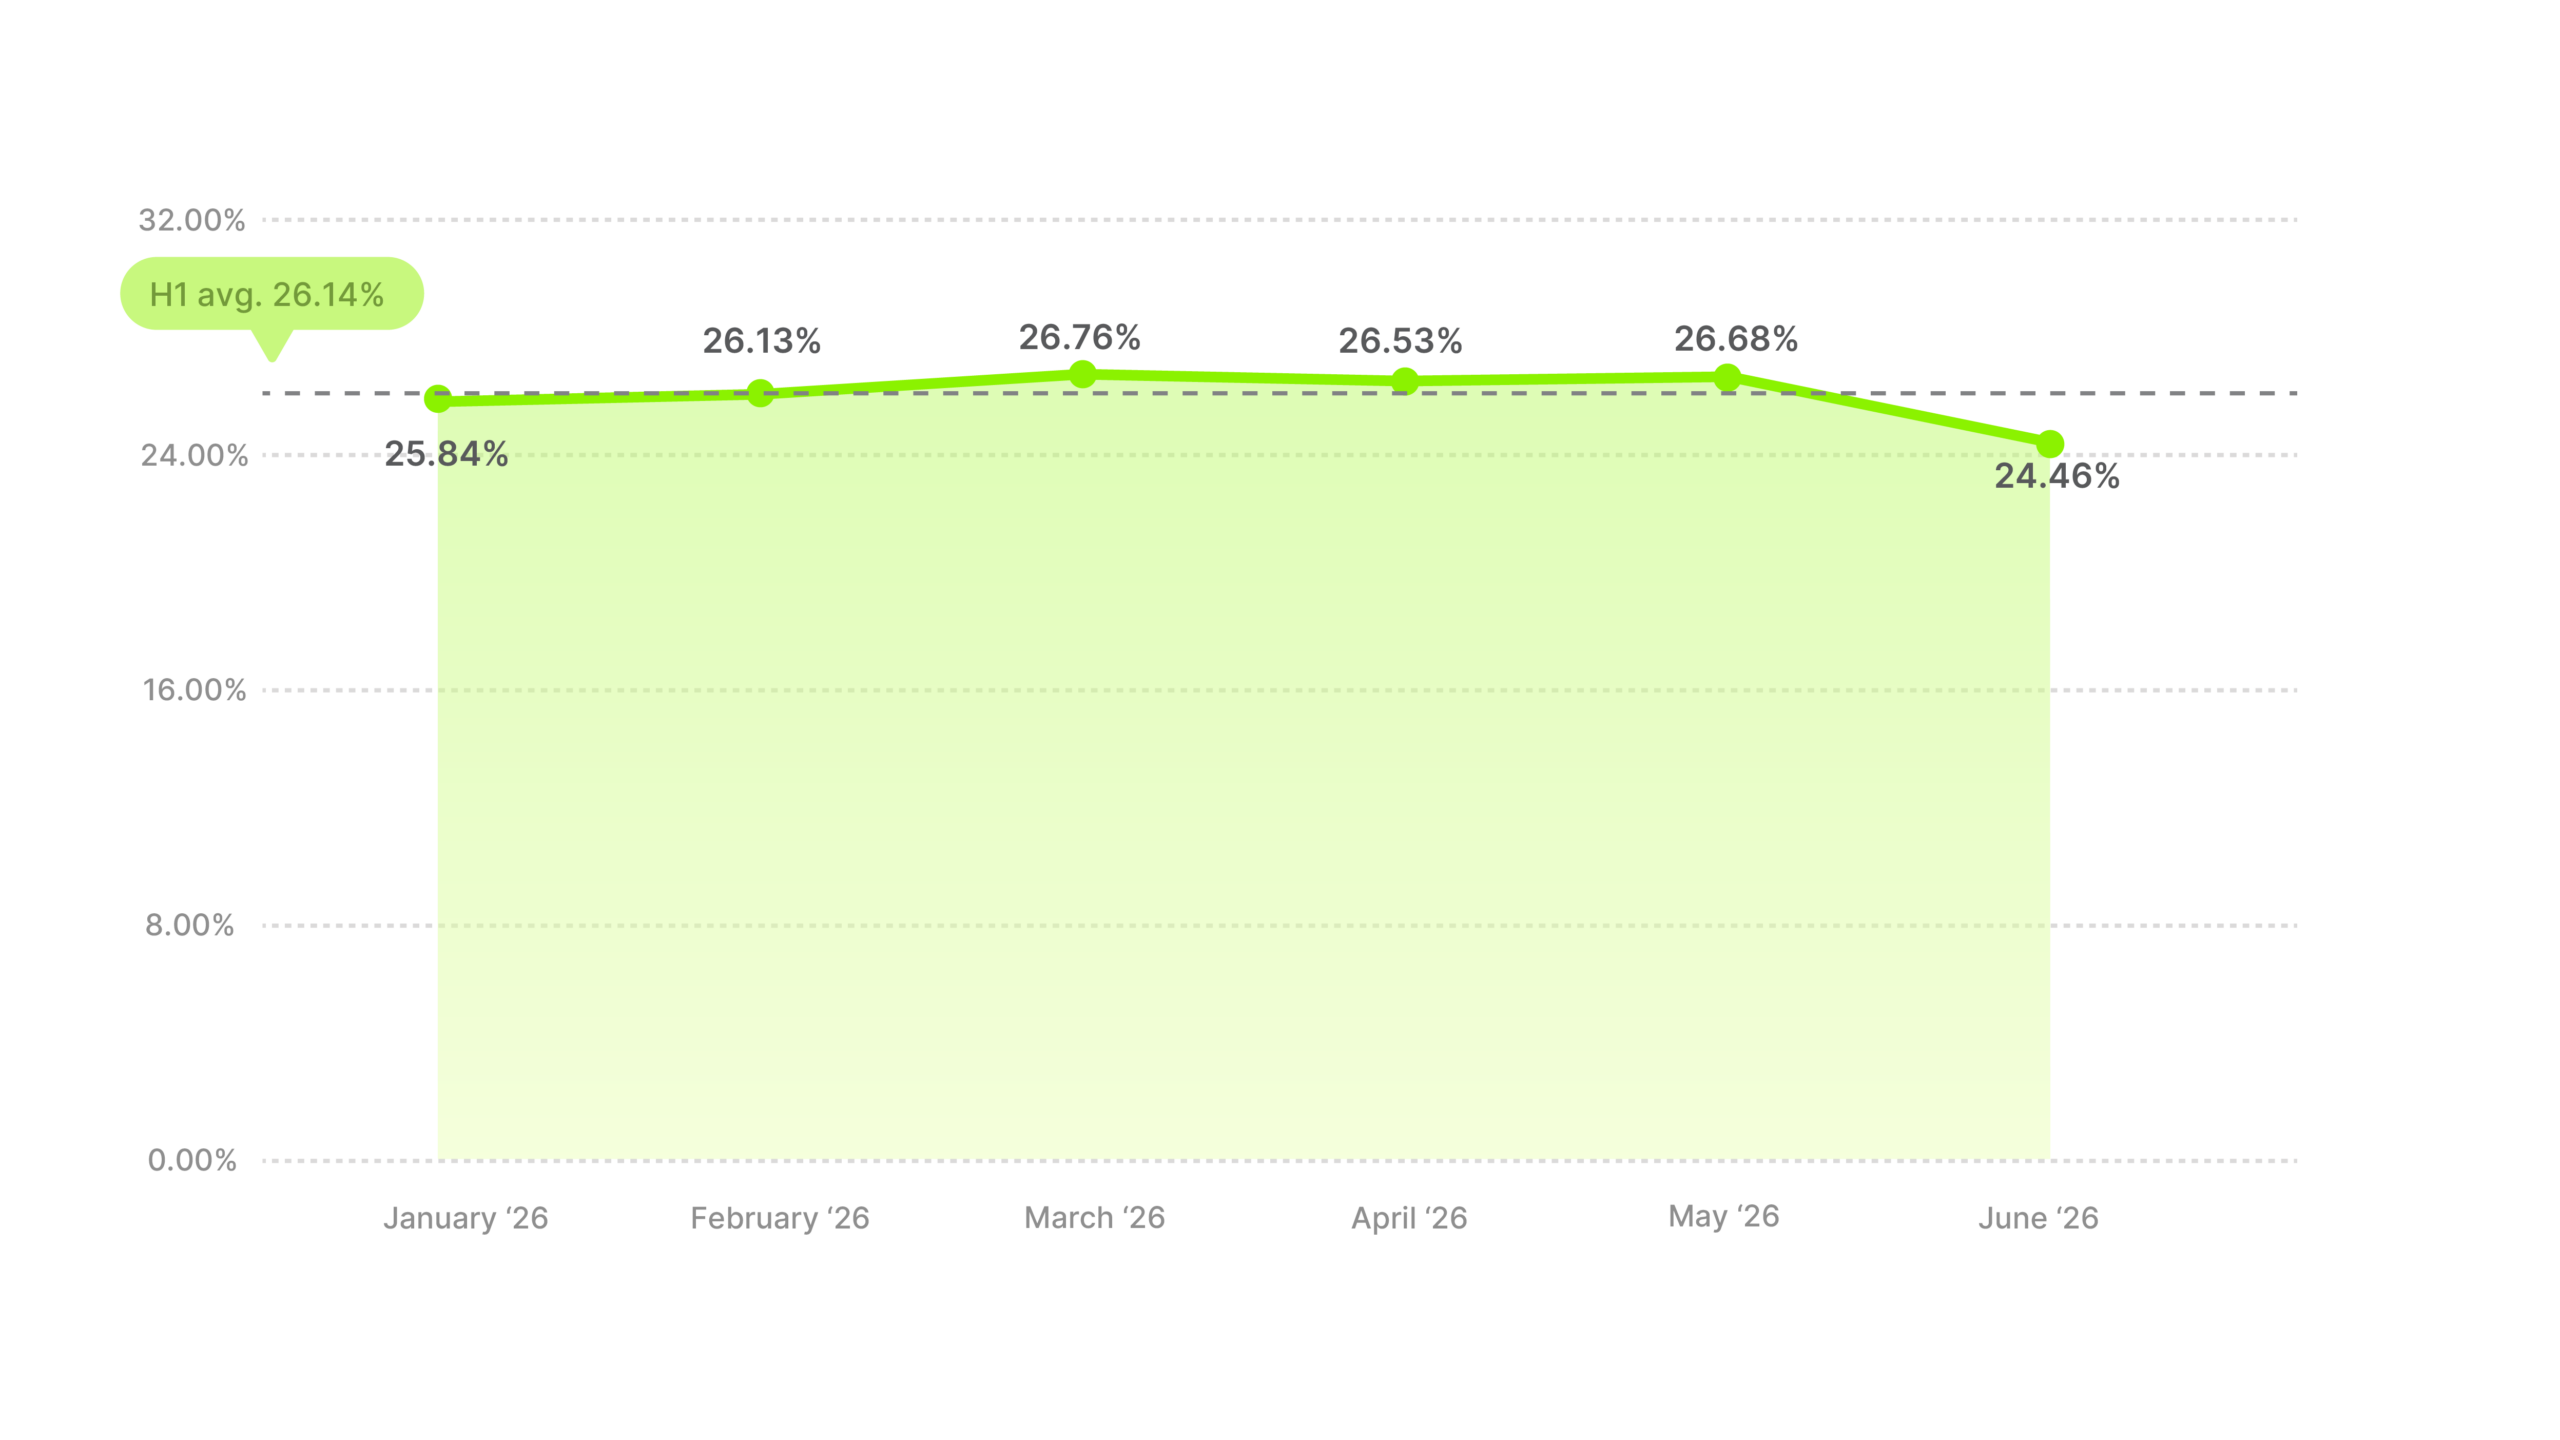
Food & Beverages stayed close to 26% for five months and finished above the cross-industry average in all six. No spikes, and one weaker month at the end. This category reliably runs above the average, which is a rare feat.
Industry hook rate average
Distance from all-industry average
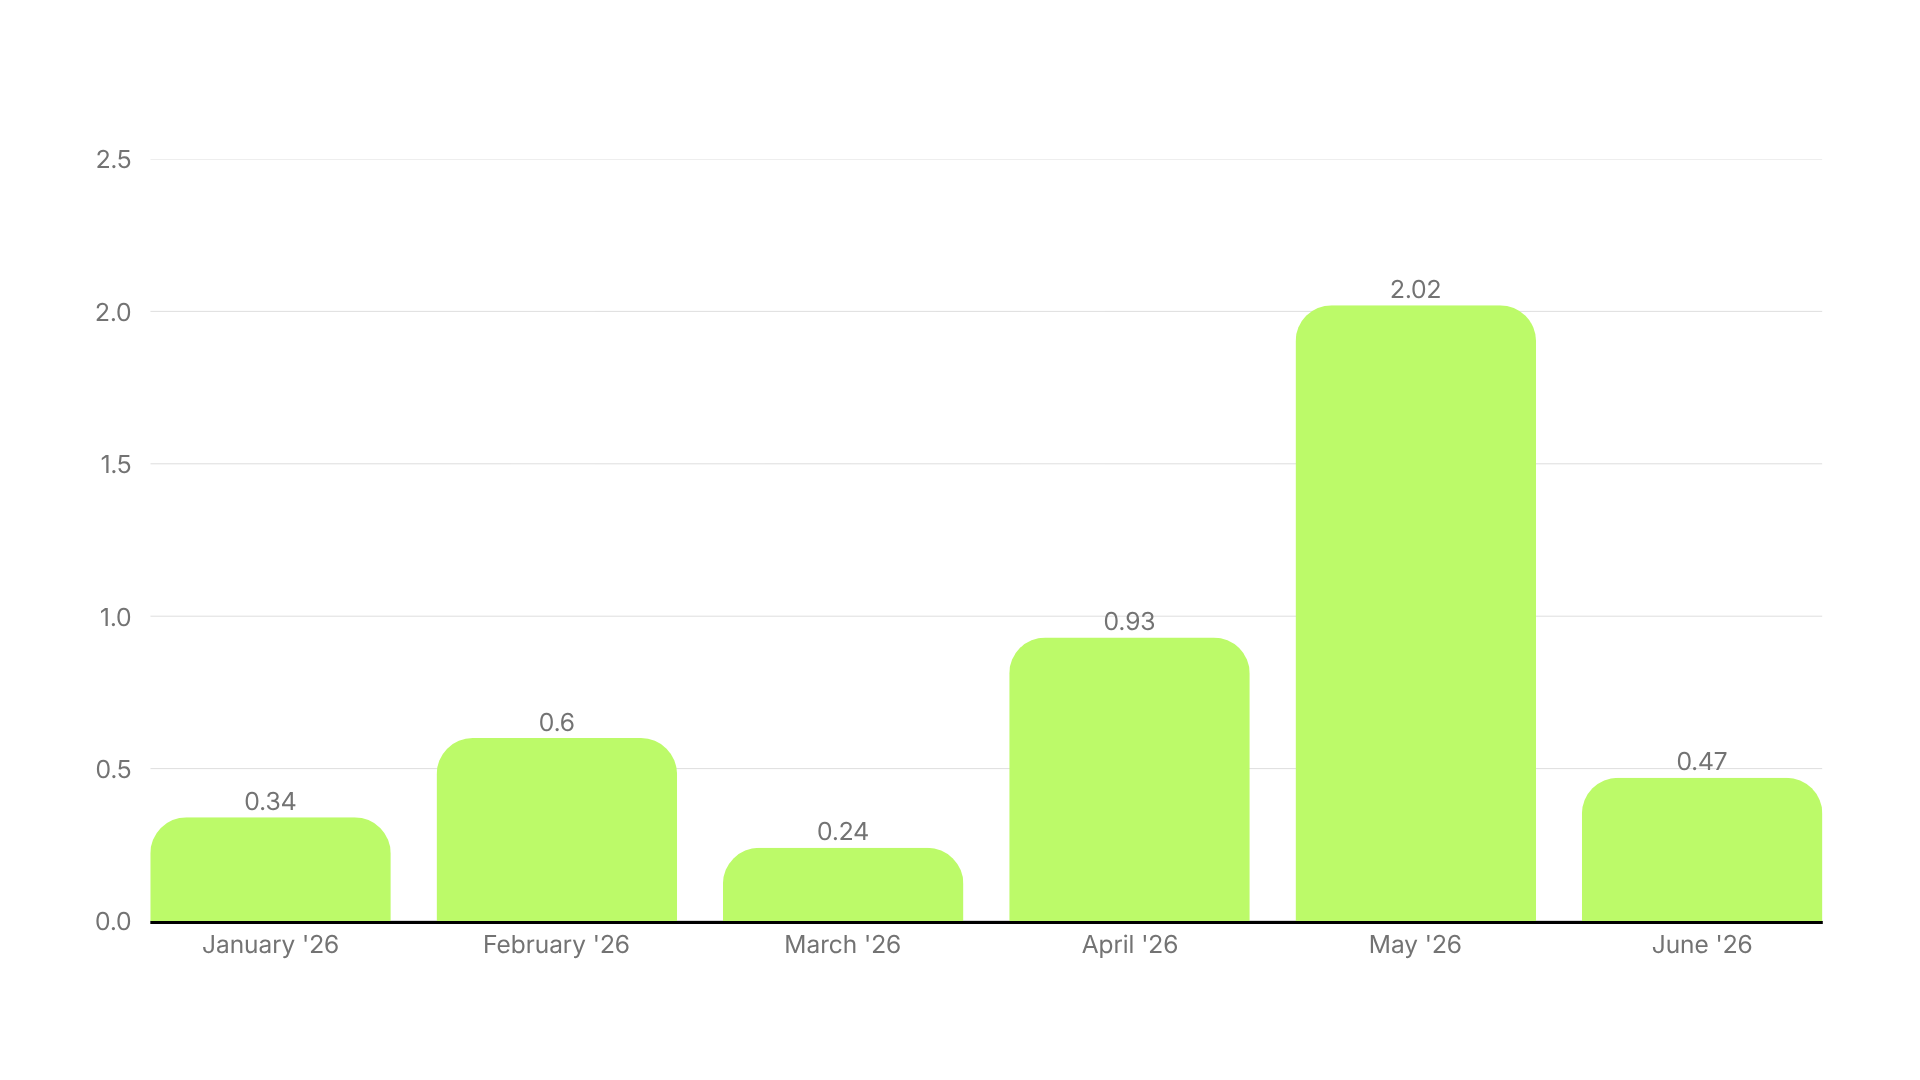
Its widest margin over the average came without the category doing anything at all. The gap peaked at +2.02 pp in May, not because food and drink improved, but because it stayed flat at 26.68% while the cross-industry average fell toward it. In a half where most categories declined, standing still turned into an advantage.
Appetizing and showable is a real head start, and it means this category doesn’t need a calendar moment to perform. June at 24.46% was the only weak reading, and it was still above the cross-industry average.
Last half the shape was a summer peak followed by a decline that ended December below the cross-industry average. This half was the flat version, above the line from January through June. Benchmark at 26%, and treat a month under 25% as worth a look.
To get ahead, make food the star and get it in the first frame. The pour, the sizzle, the pull-apart, the first bite. The failure here is opening on packaging, or on someone talking about the food instead of the food.
If you’re in this category, benchmark against 28%, not 25.44%. Health & Beauty stayed above the cross-industry average in all six months on the largest sample in the report, which means the cross-industry figure would have you congratulating yourself while trailing everyone you actually compete with.
Industry hook rate average
Distance from all-industry average
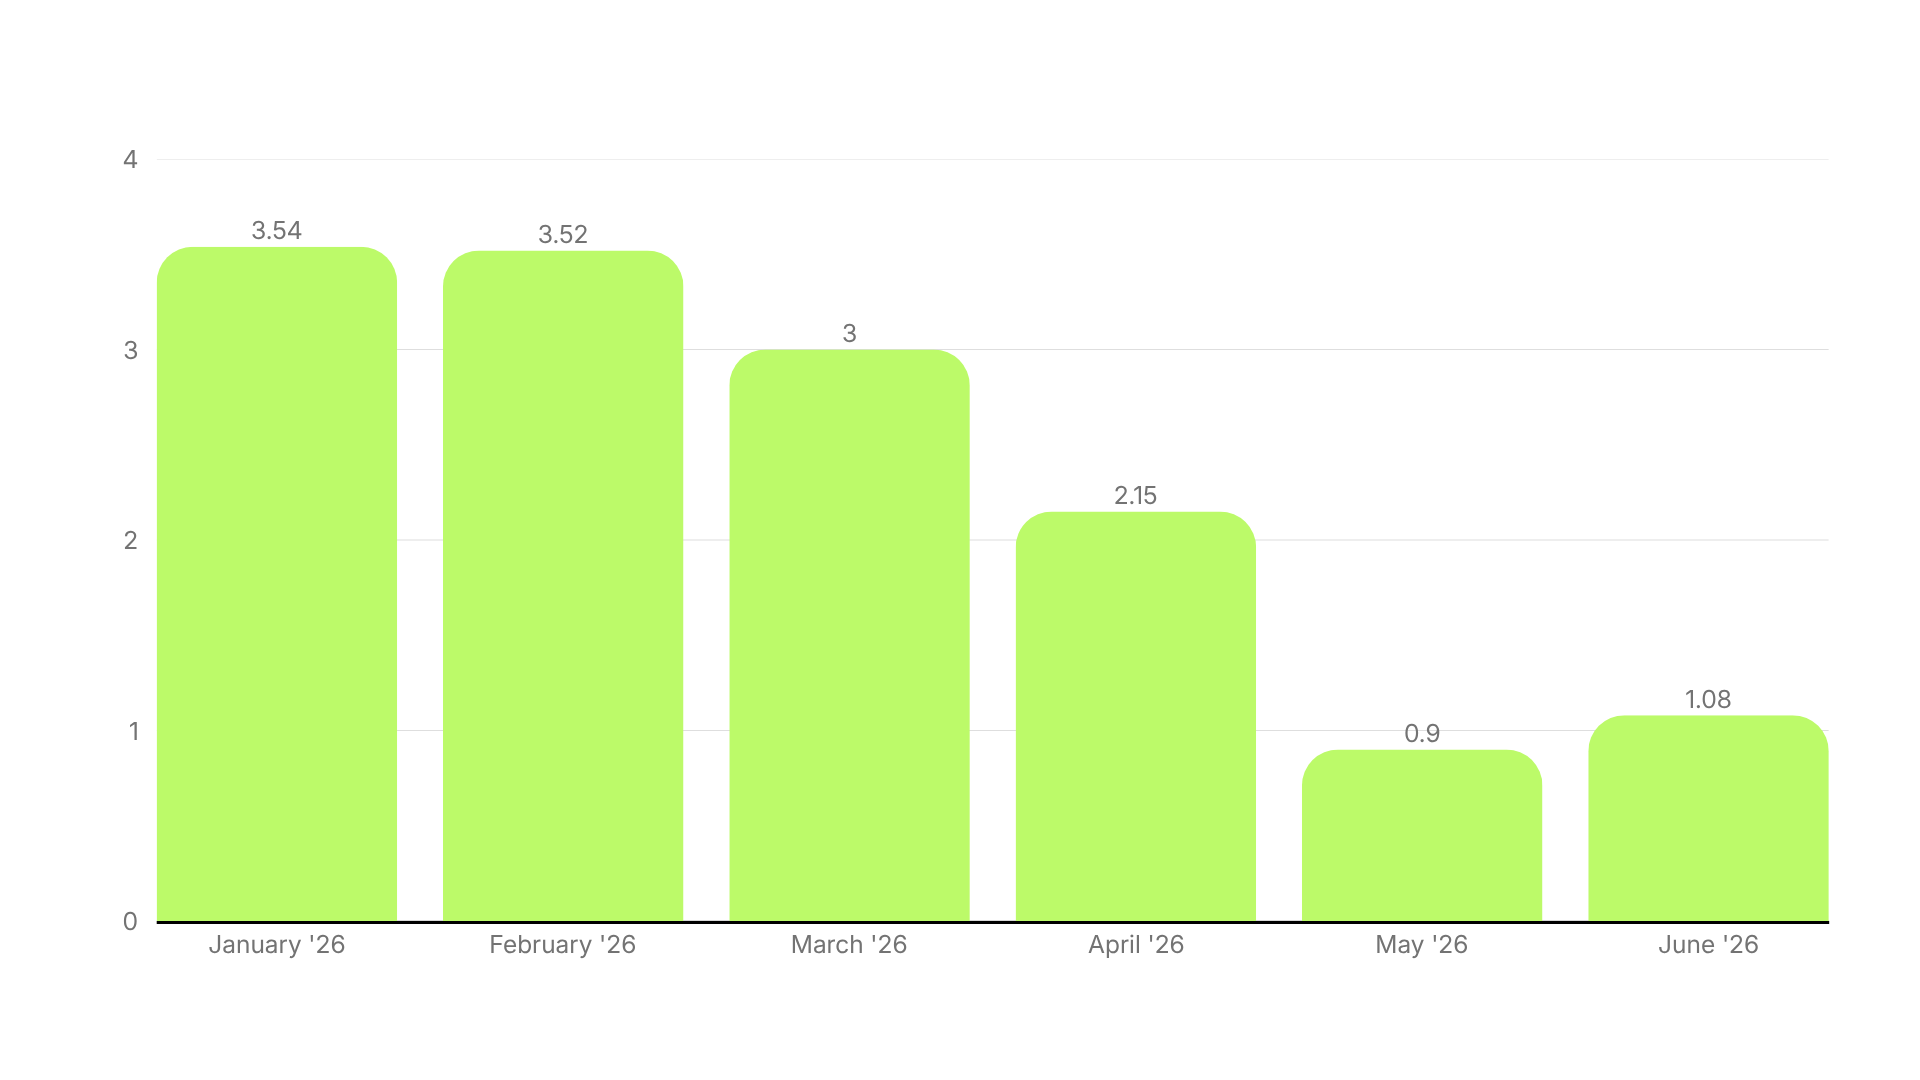
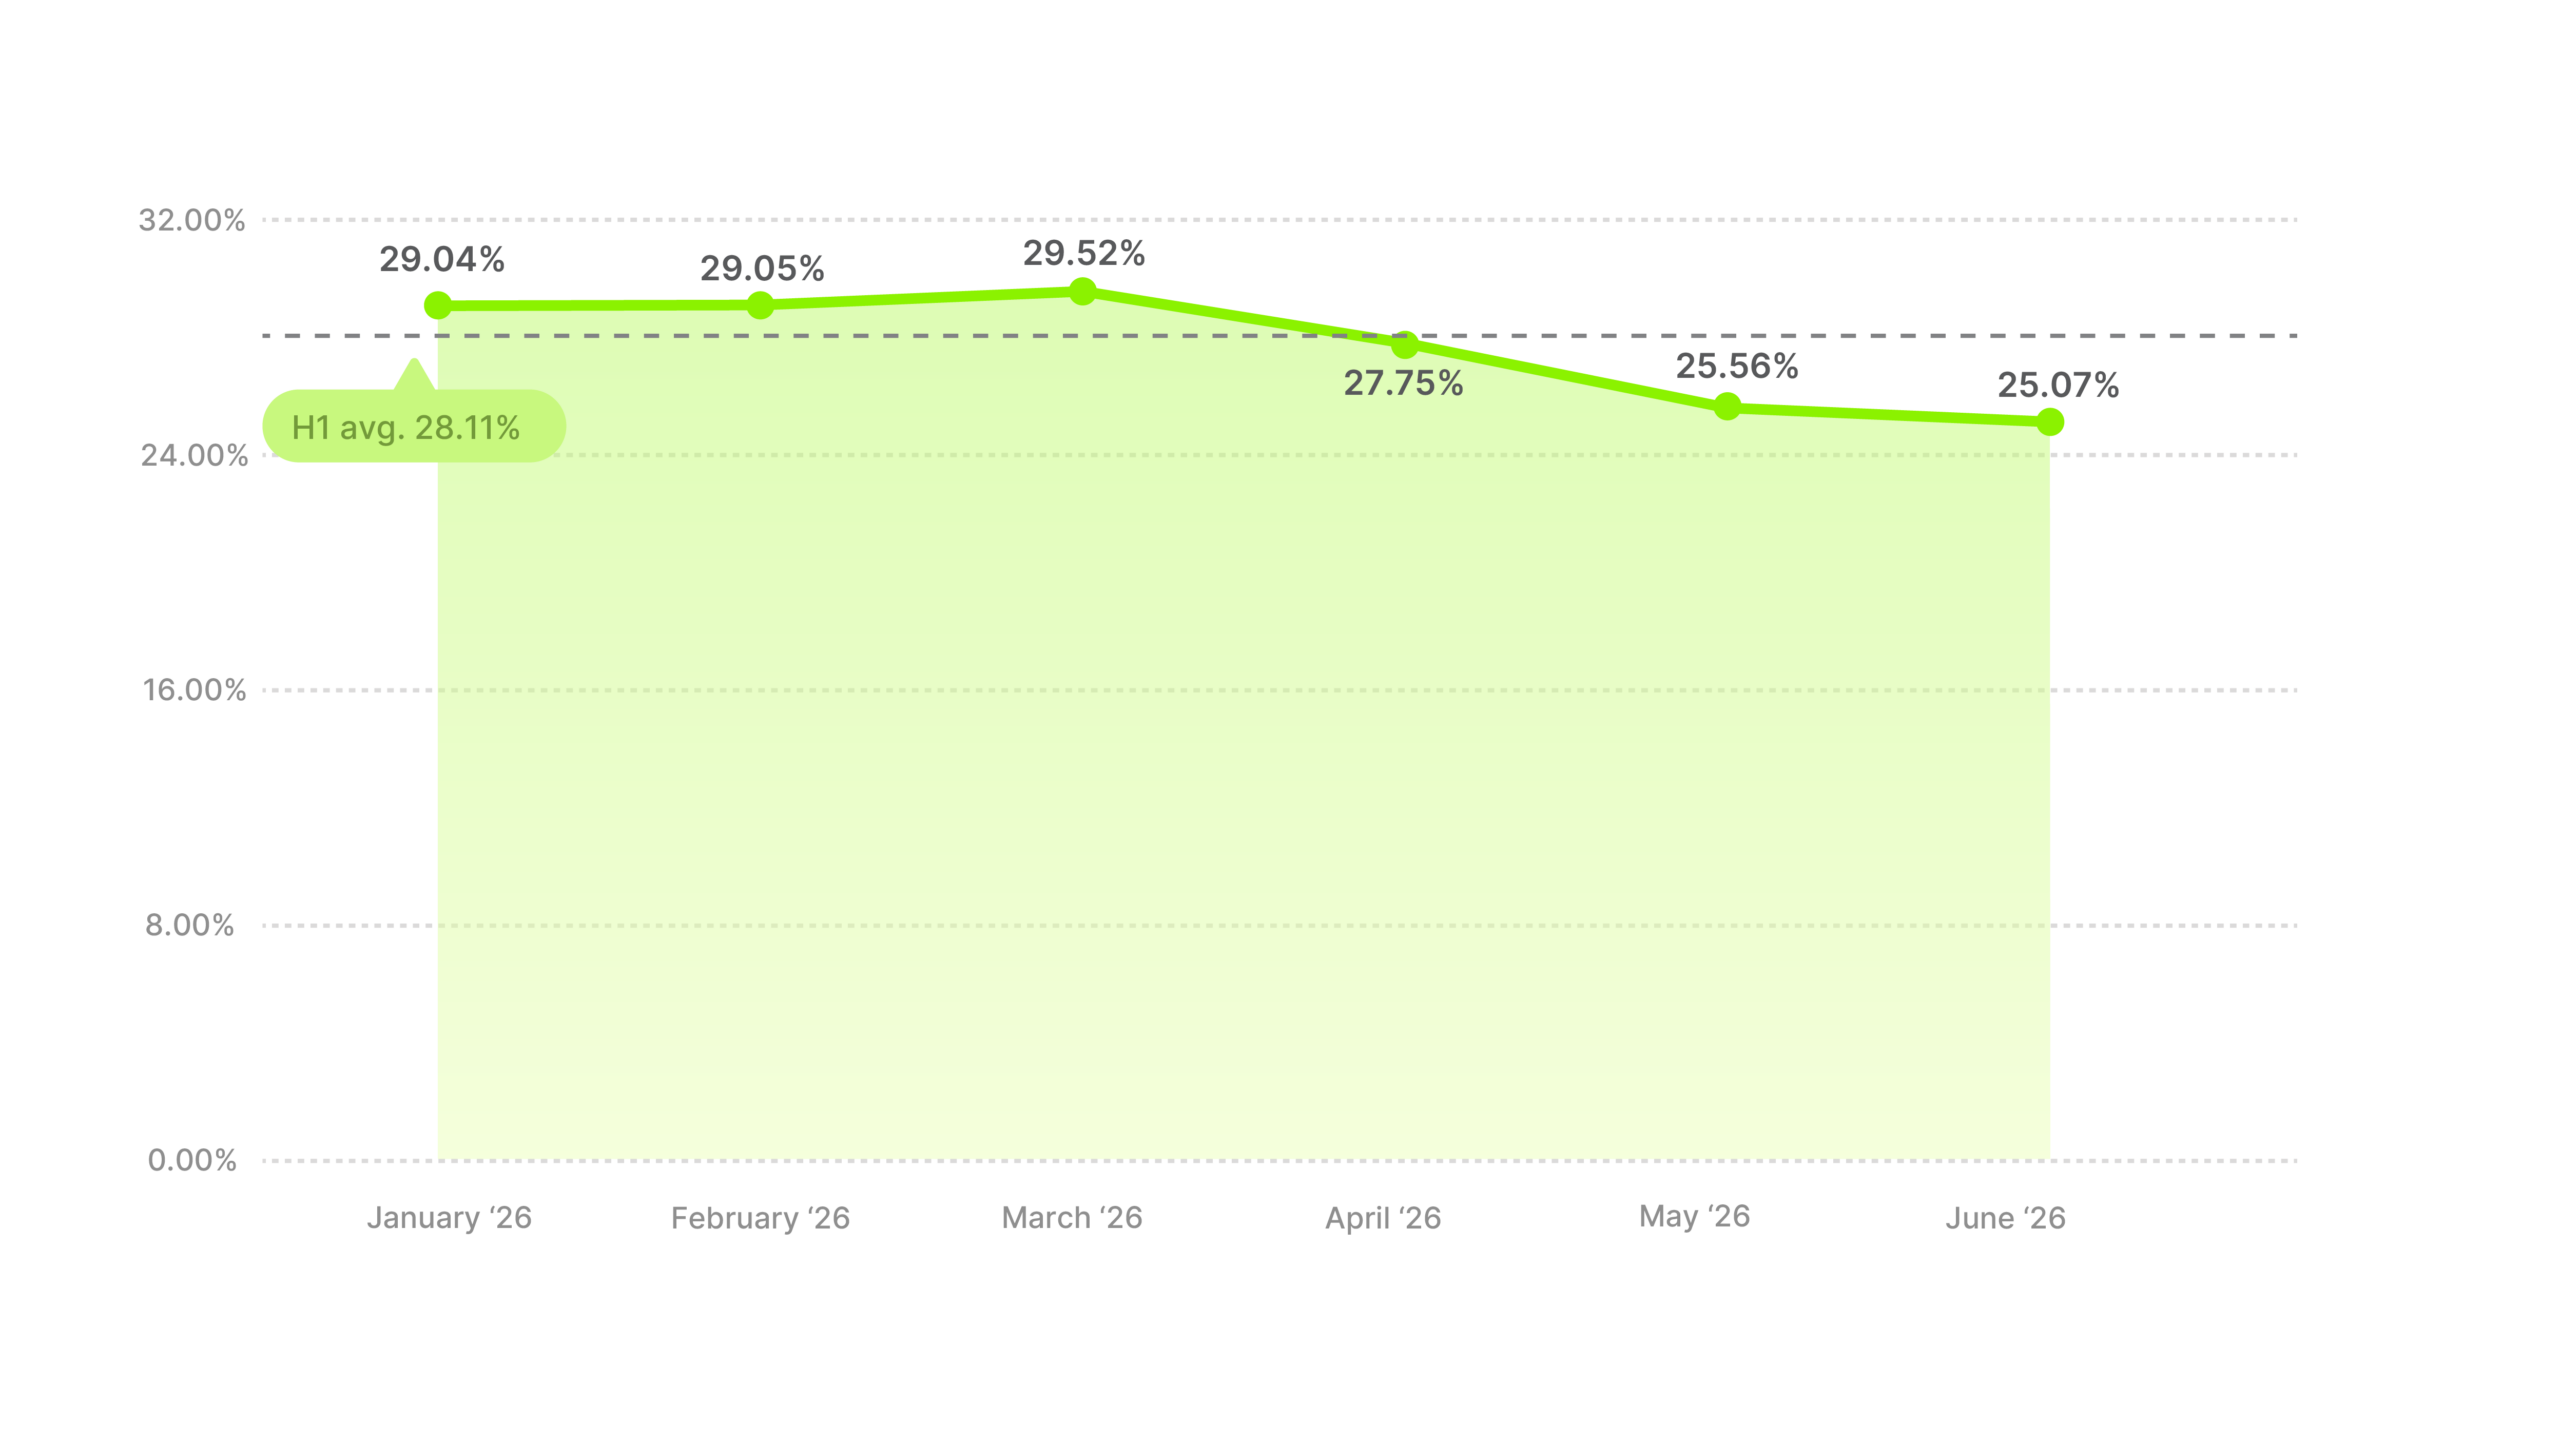
The lead did narrow. Q1 ran near 29%, three and a half points clear of the average in January and February, and by June the category was at 25.07% with barely a point of it left. The rest of the market closed the gap.
Then there’s the contrast with Business & Industrial. Ad volume here fell steeply across the half, the same as it did there. But hook rate fell with it instead of rising.
The headline for this category is unchanged from last half, 28.34% then and 28.11% now: it’s still a leader. The decline into June is the new detail, and it’s worth watching as H2 gets underway.
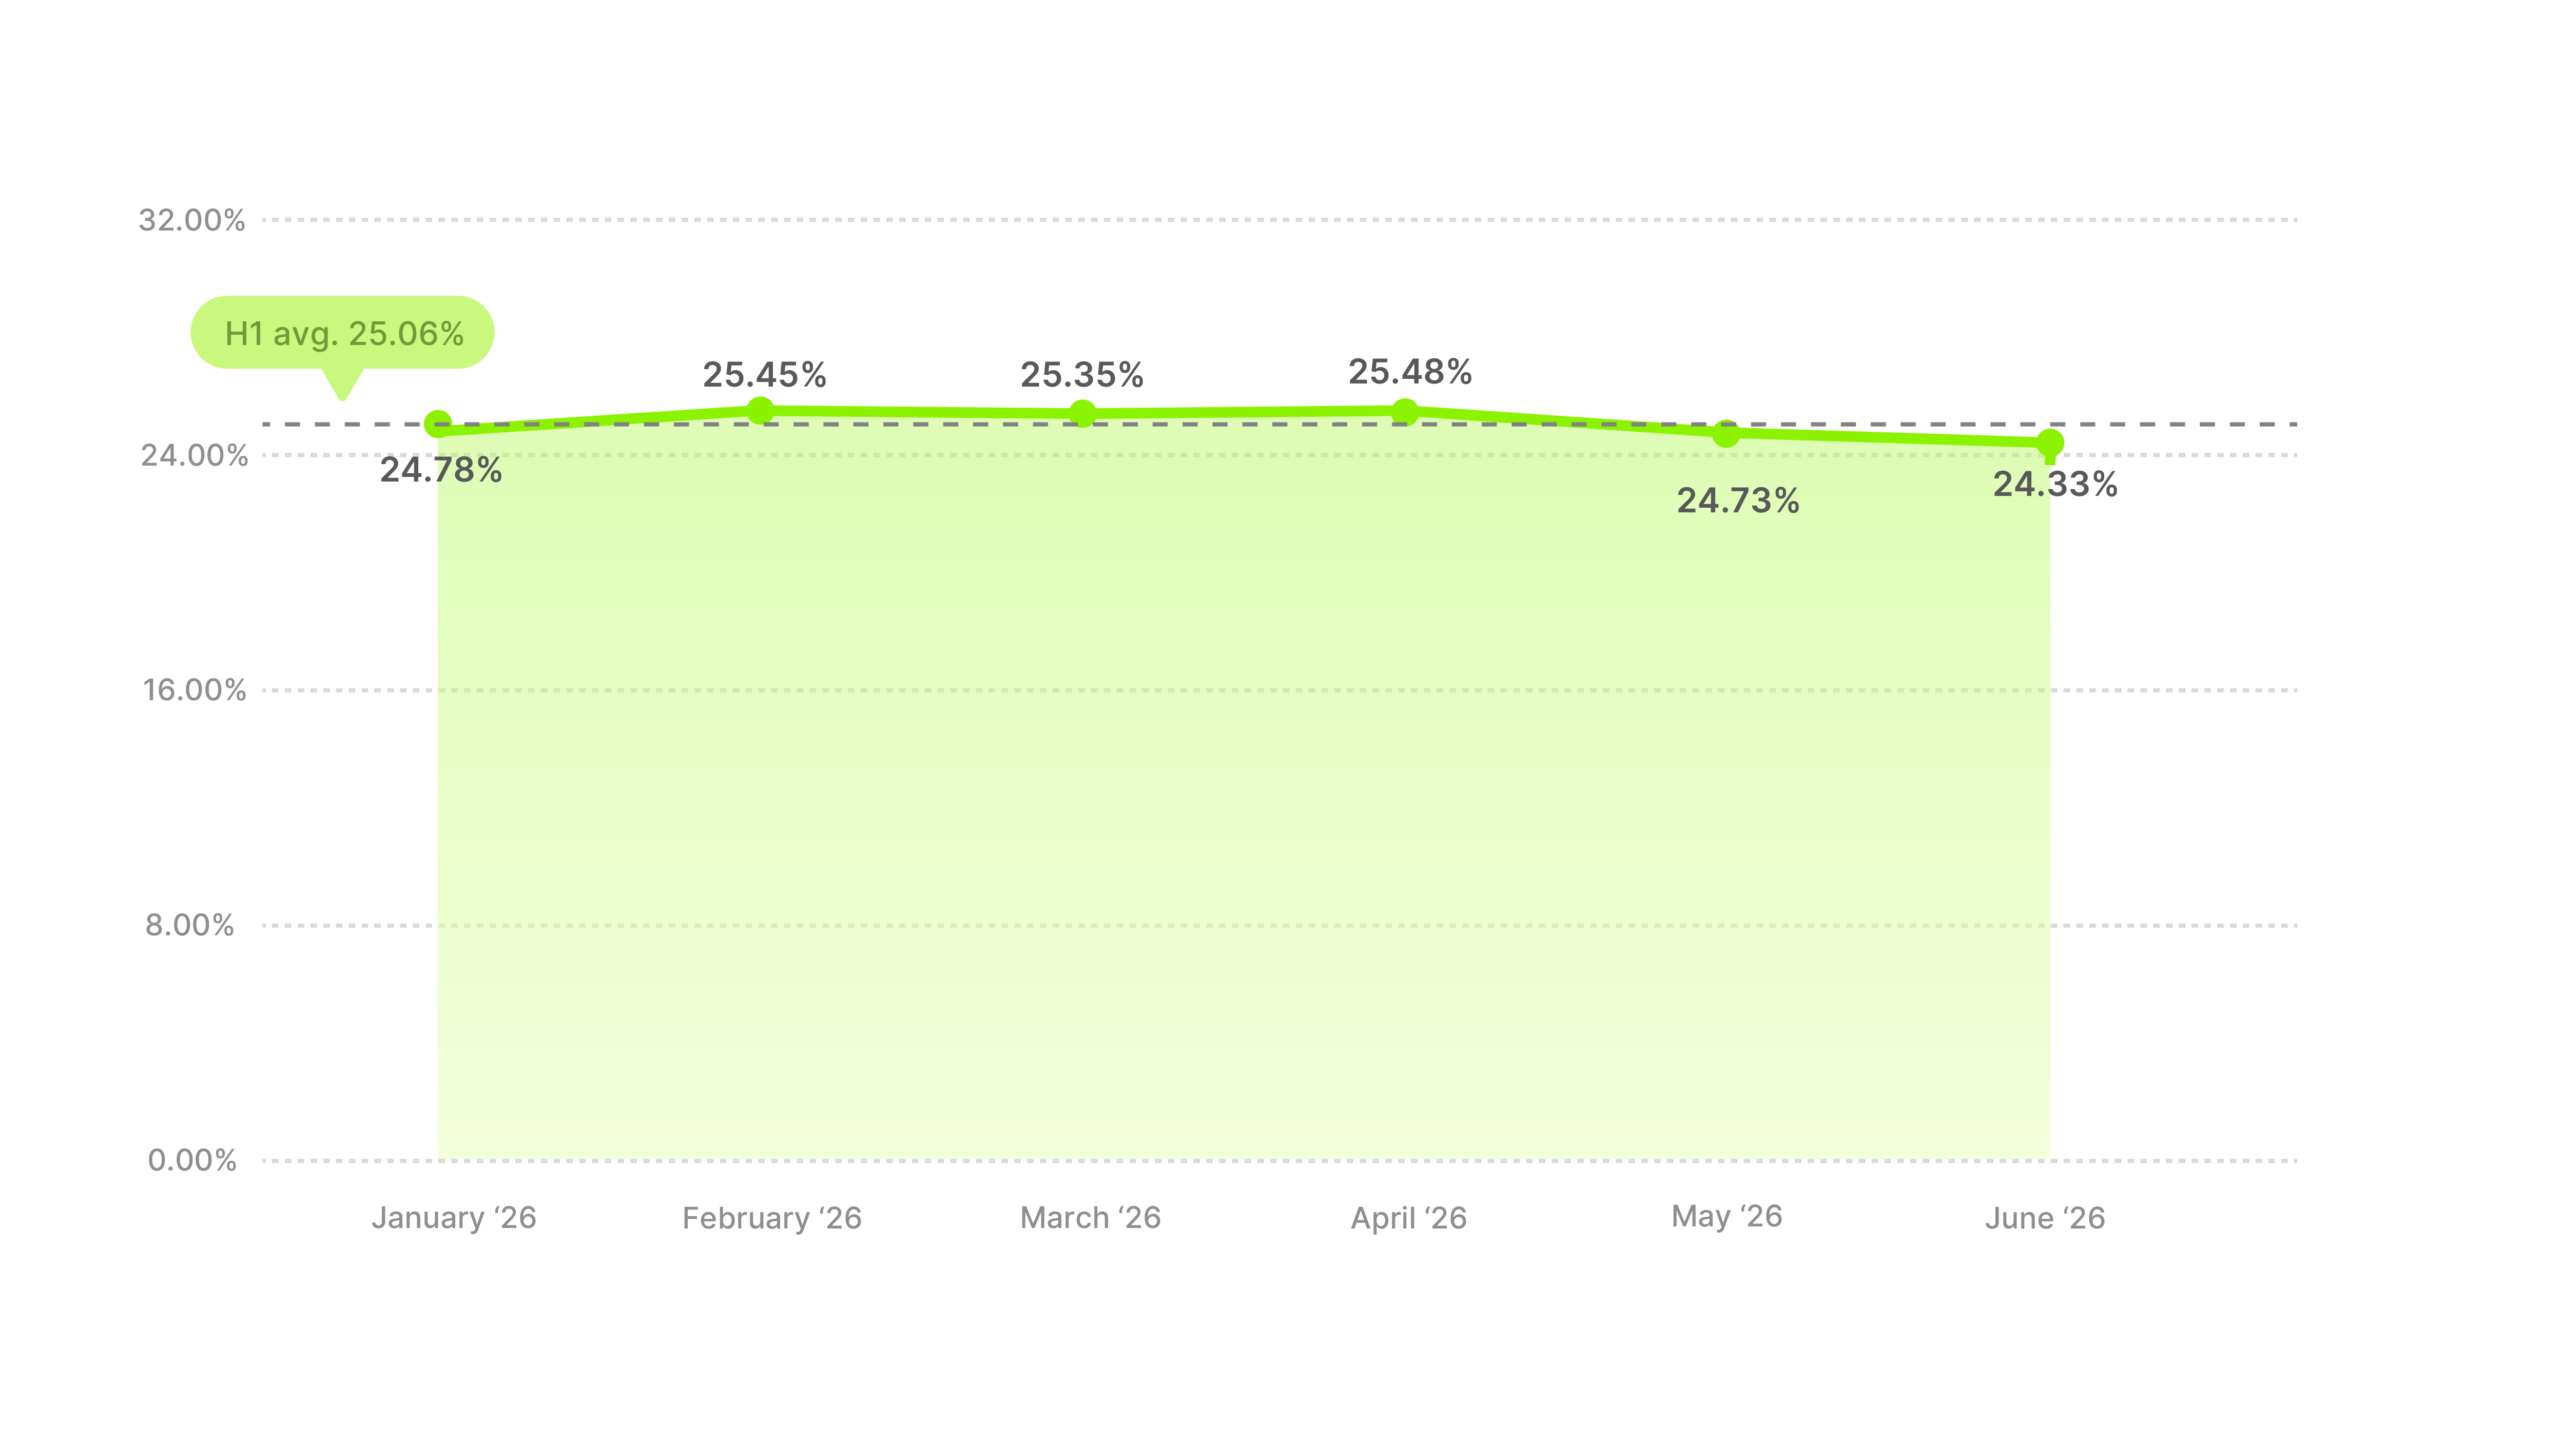
Home & Garden is the closest thing in this report to the average advertiser. Every month was within about a point of the cross-industry average, in both directions.
Industry hook rate average
Distance from all-industry average
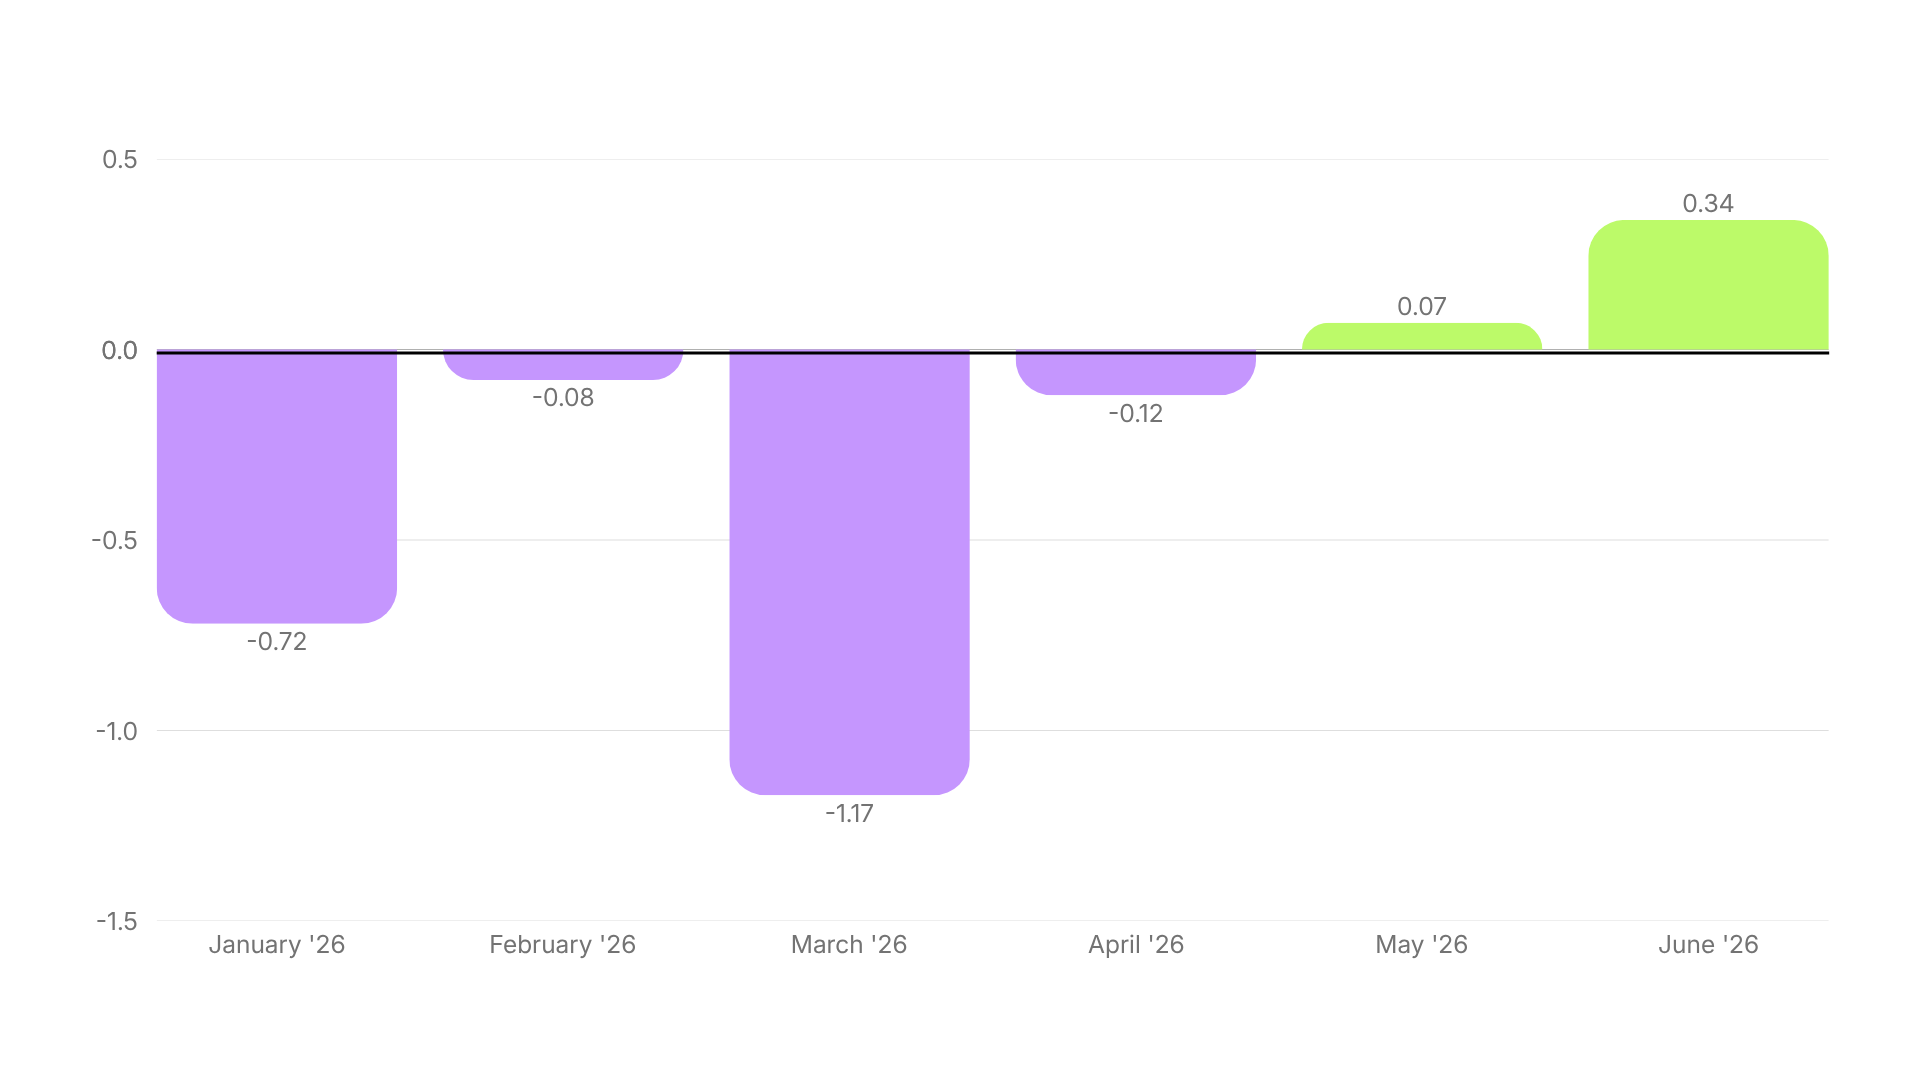
It’s also the flattest category here. April’s 25.48% high and June’s 24.33% low are only 1.15 pp apart, with no trend and no seasonal spike anywhere in between. Breadth explains some of that, since decor, gardening and furniture all sit in the same bucket and average each other out.
Benchmark at 25%, expect few surprises, and spend your planning attention elsewhere. It was the flattest, most average-tracking category last half too. Two halves running makes that a trait.
To go above the average, test out the before-and-after to separate from a category that mostly opens on the after. Try leading with the cluttered corner or the bare patch instead of the styled result. And because it’s the flattest category in the report, you’ll know quickly whether it worked, since there’s no seasonal swing to hide behind.
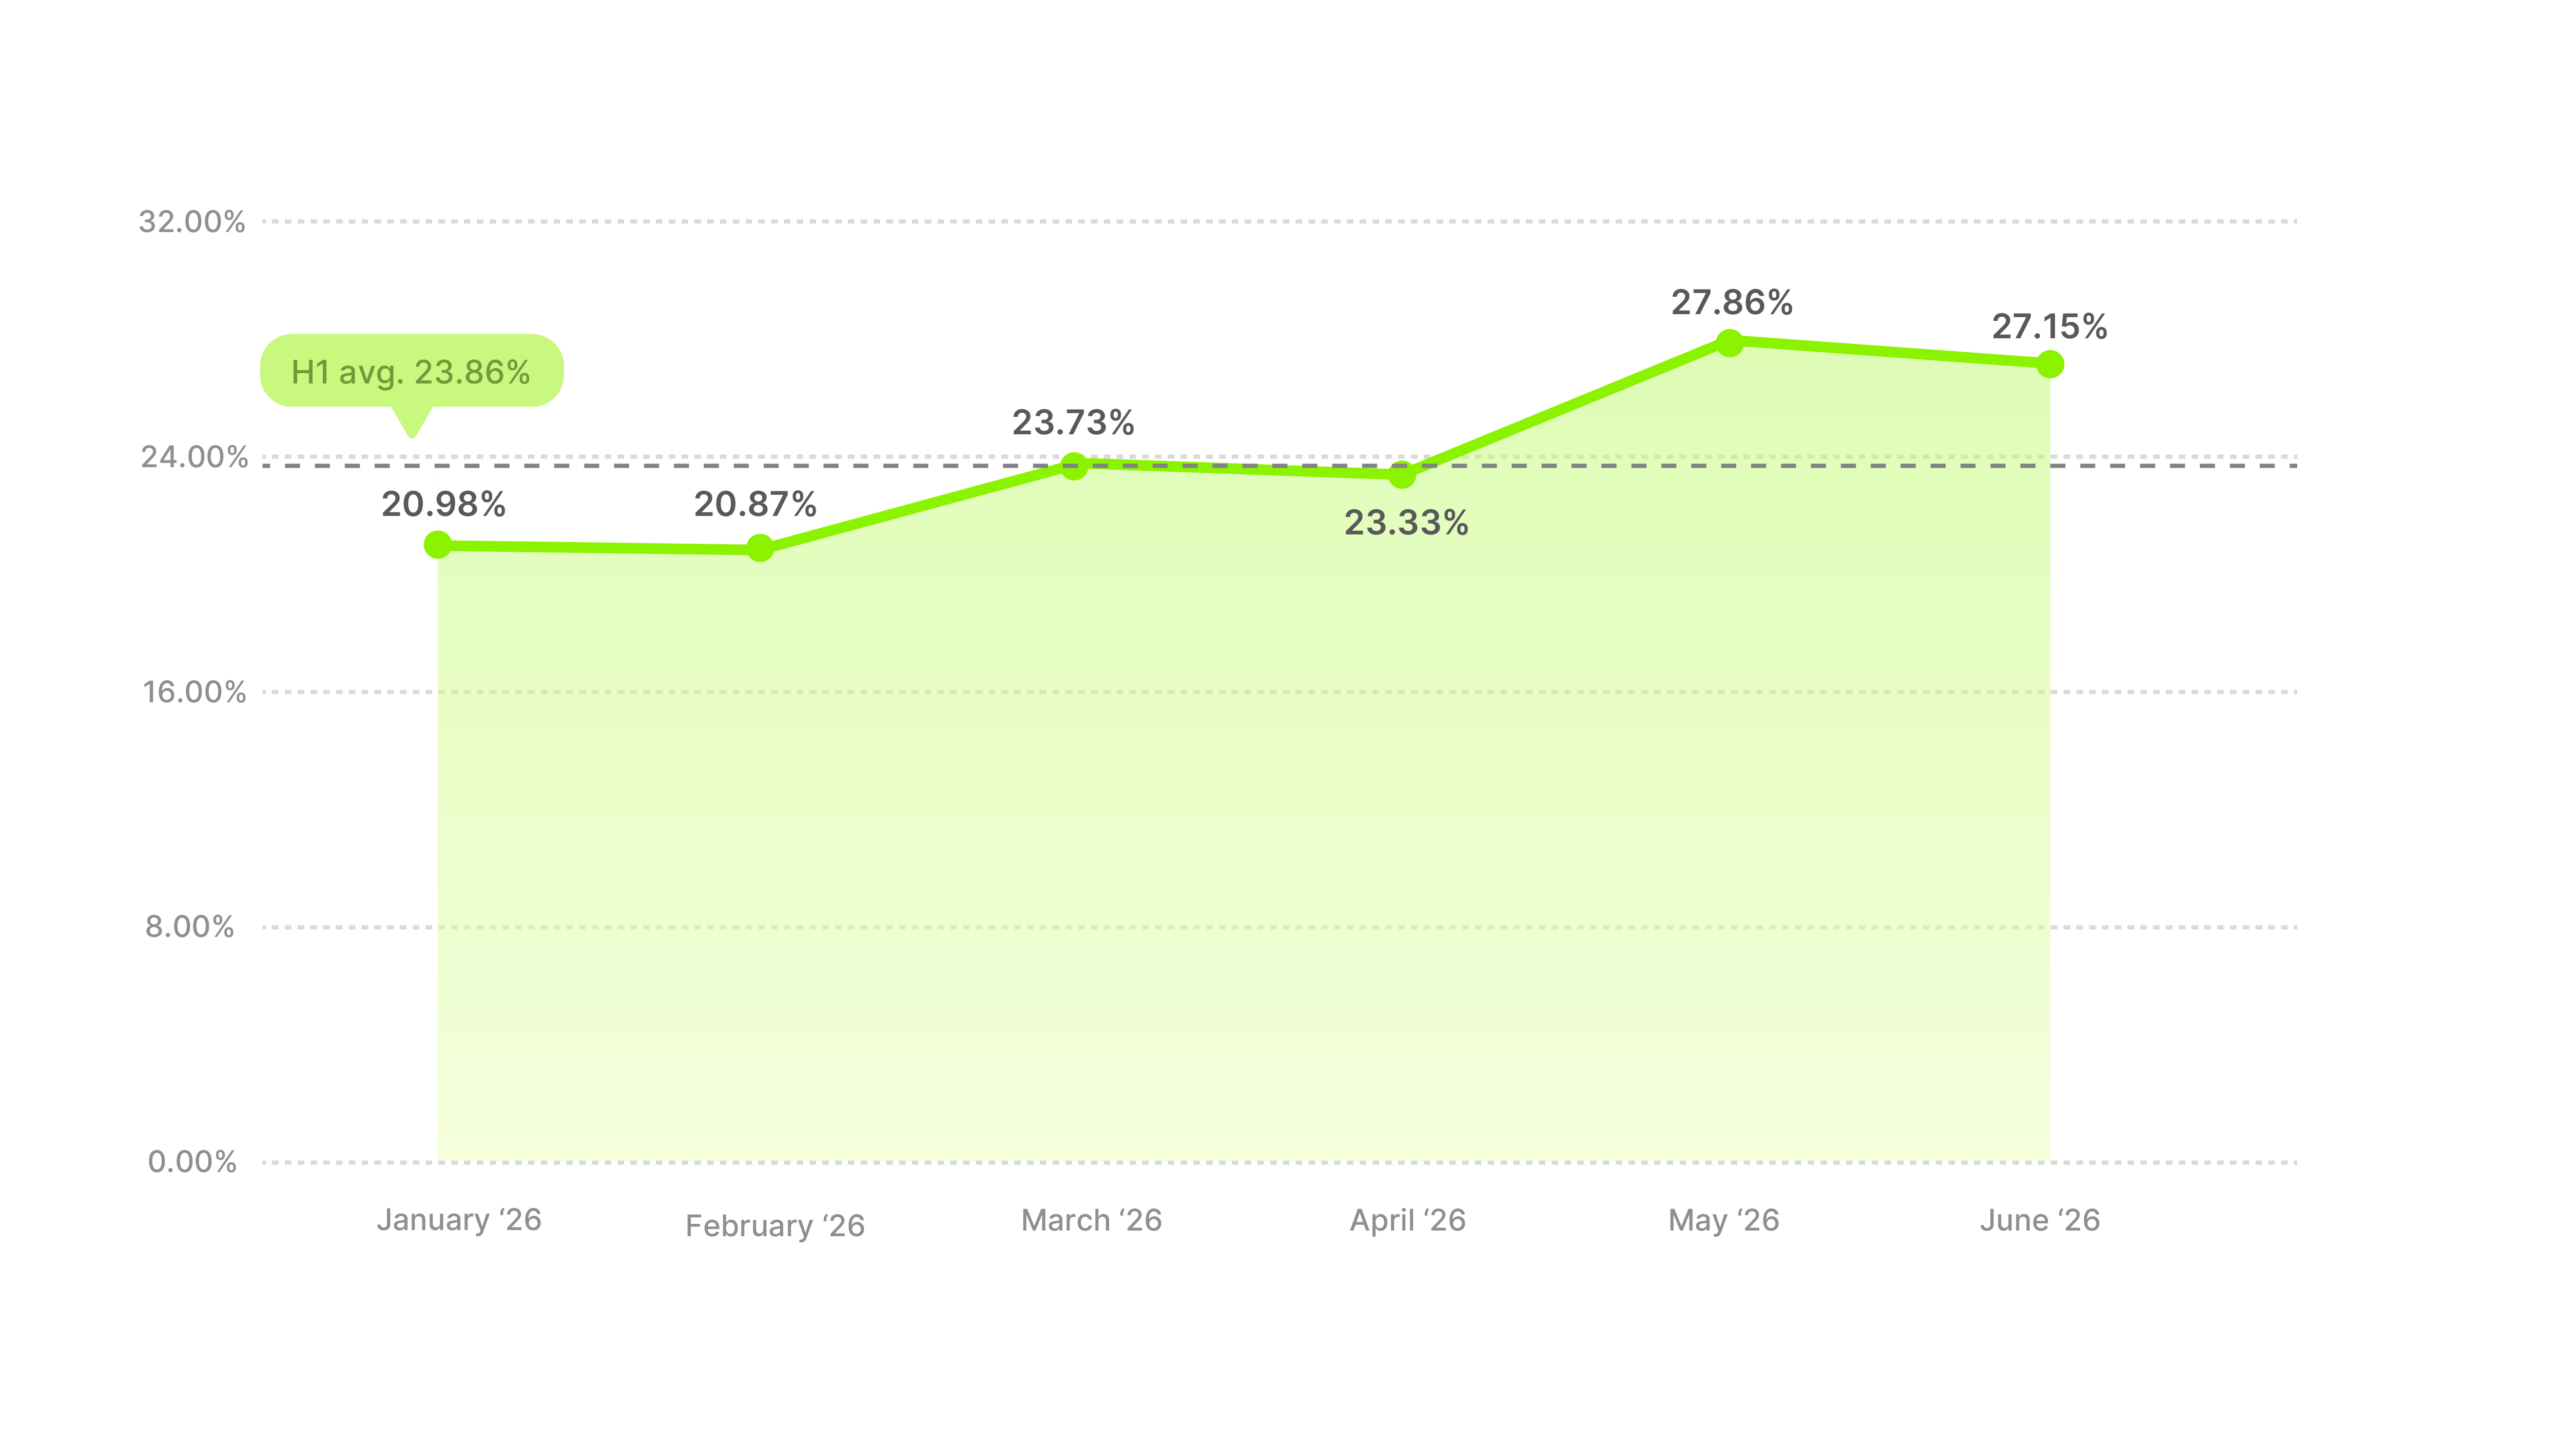
Nothing to demo, nothing to unbox, no product to put on screen. The hook has to be the message, or whoever’s delivering it, which is why this category had sat in the bottom two every half we’d measured. In H1 2026 it improved anyway.
Industry hook rate average
Distance from all-industry average
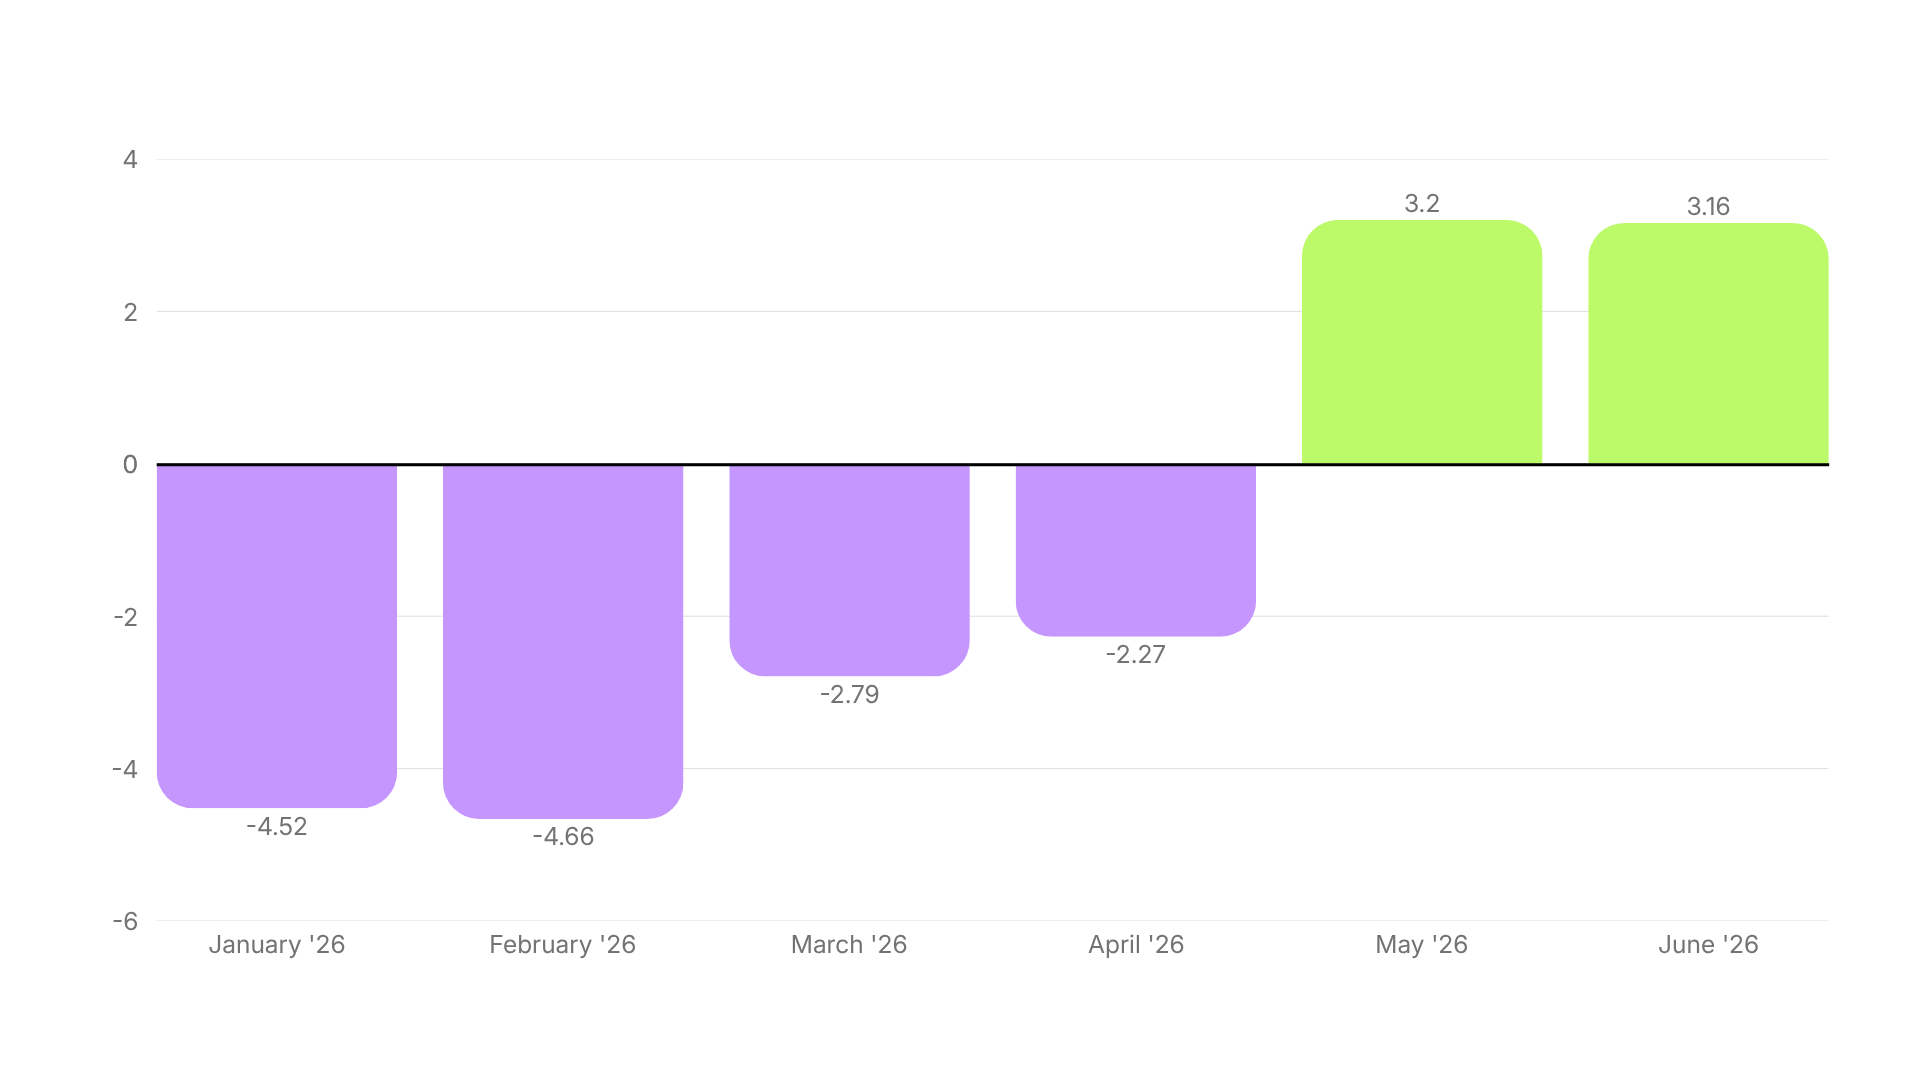
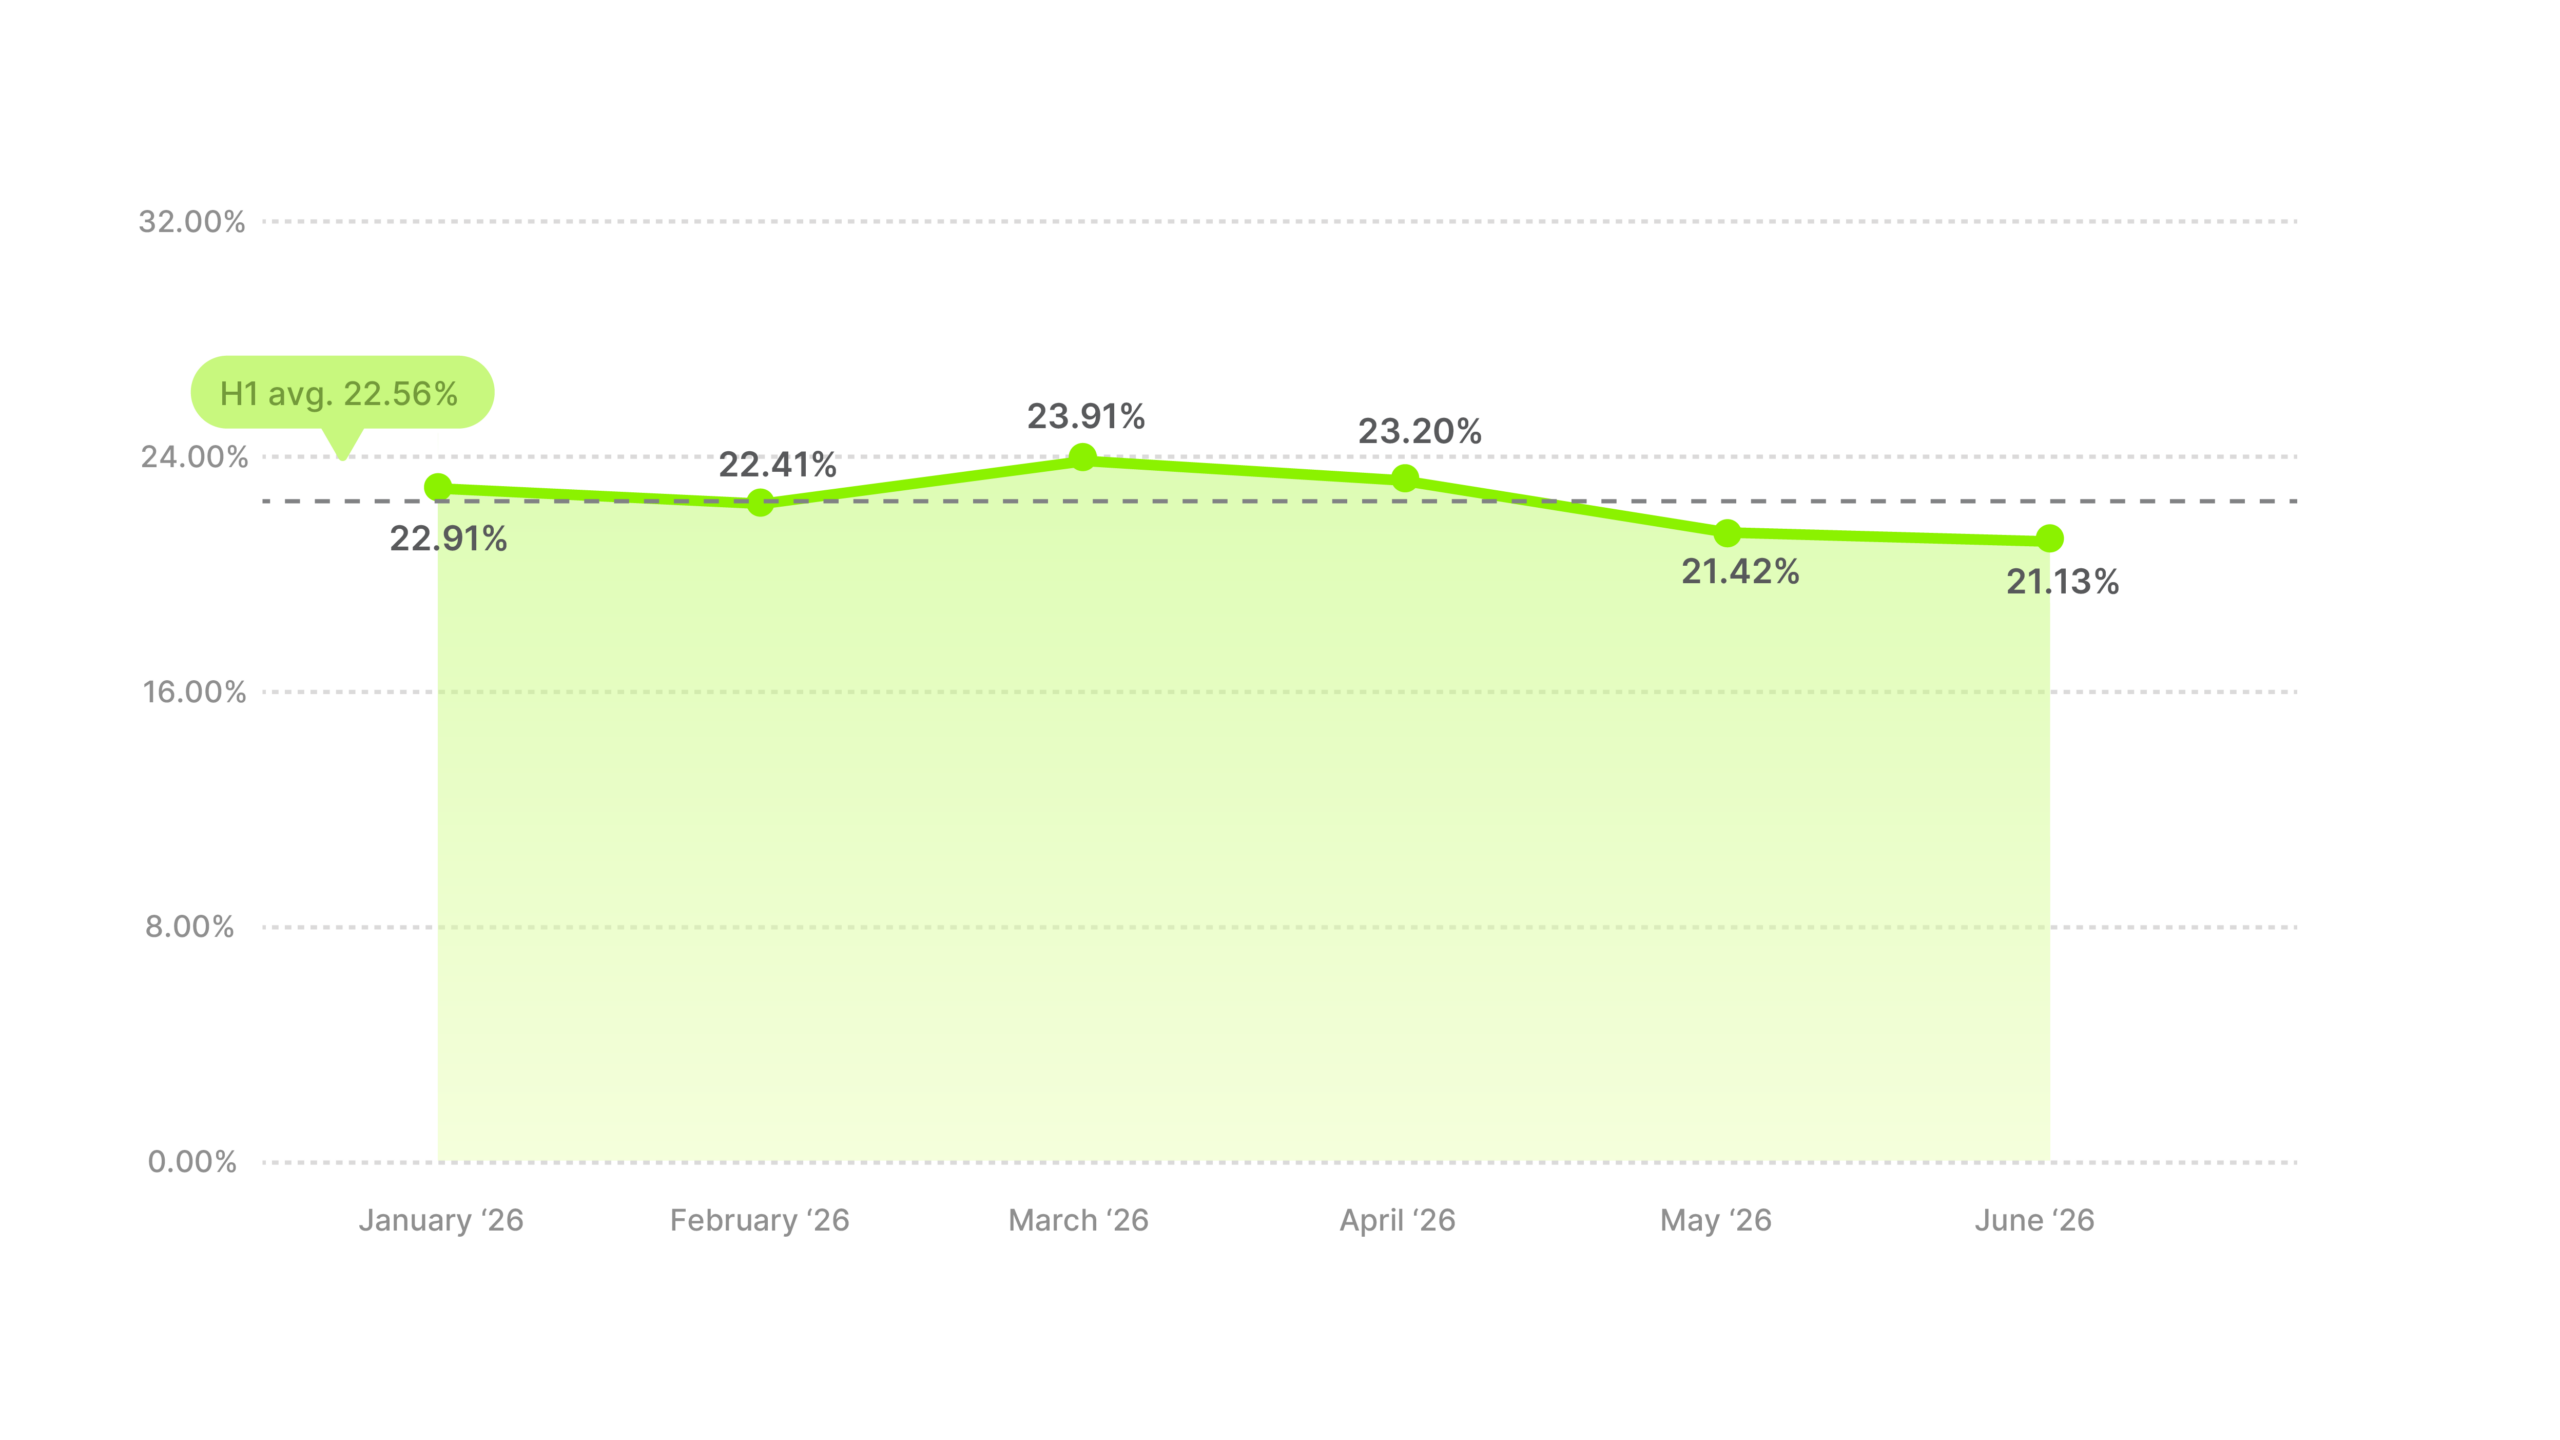
The change is the biggest in the report, just ahead of Sporting Goods. January and February were stuck at the bottom, 20.98% and 20.87%, well below the cross-industry average. March and April rose to the mid-23s. Then May reached 27.86% and June held 27.15%, both above the average, which took the category from the bottom tier to the top half, nearly 7 pp between February and May.
Timing makes it more striking. The increase came in exactly the months the cross-industry average was falling, so the hardest category in the dataset was improving while product categories declined.
Don’t put much weight on any single month, though the rise is big enough and long enough to count as a real shift. Benchmark around 24% for the half, and treat May and June as what’s reachable once the format works.
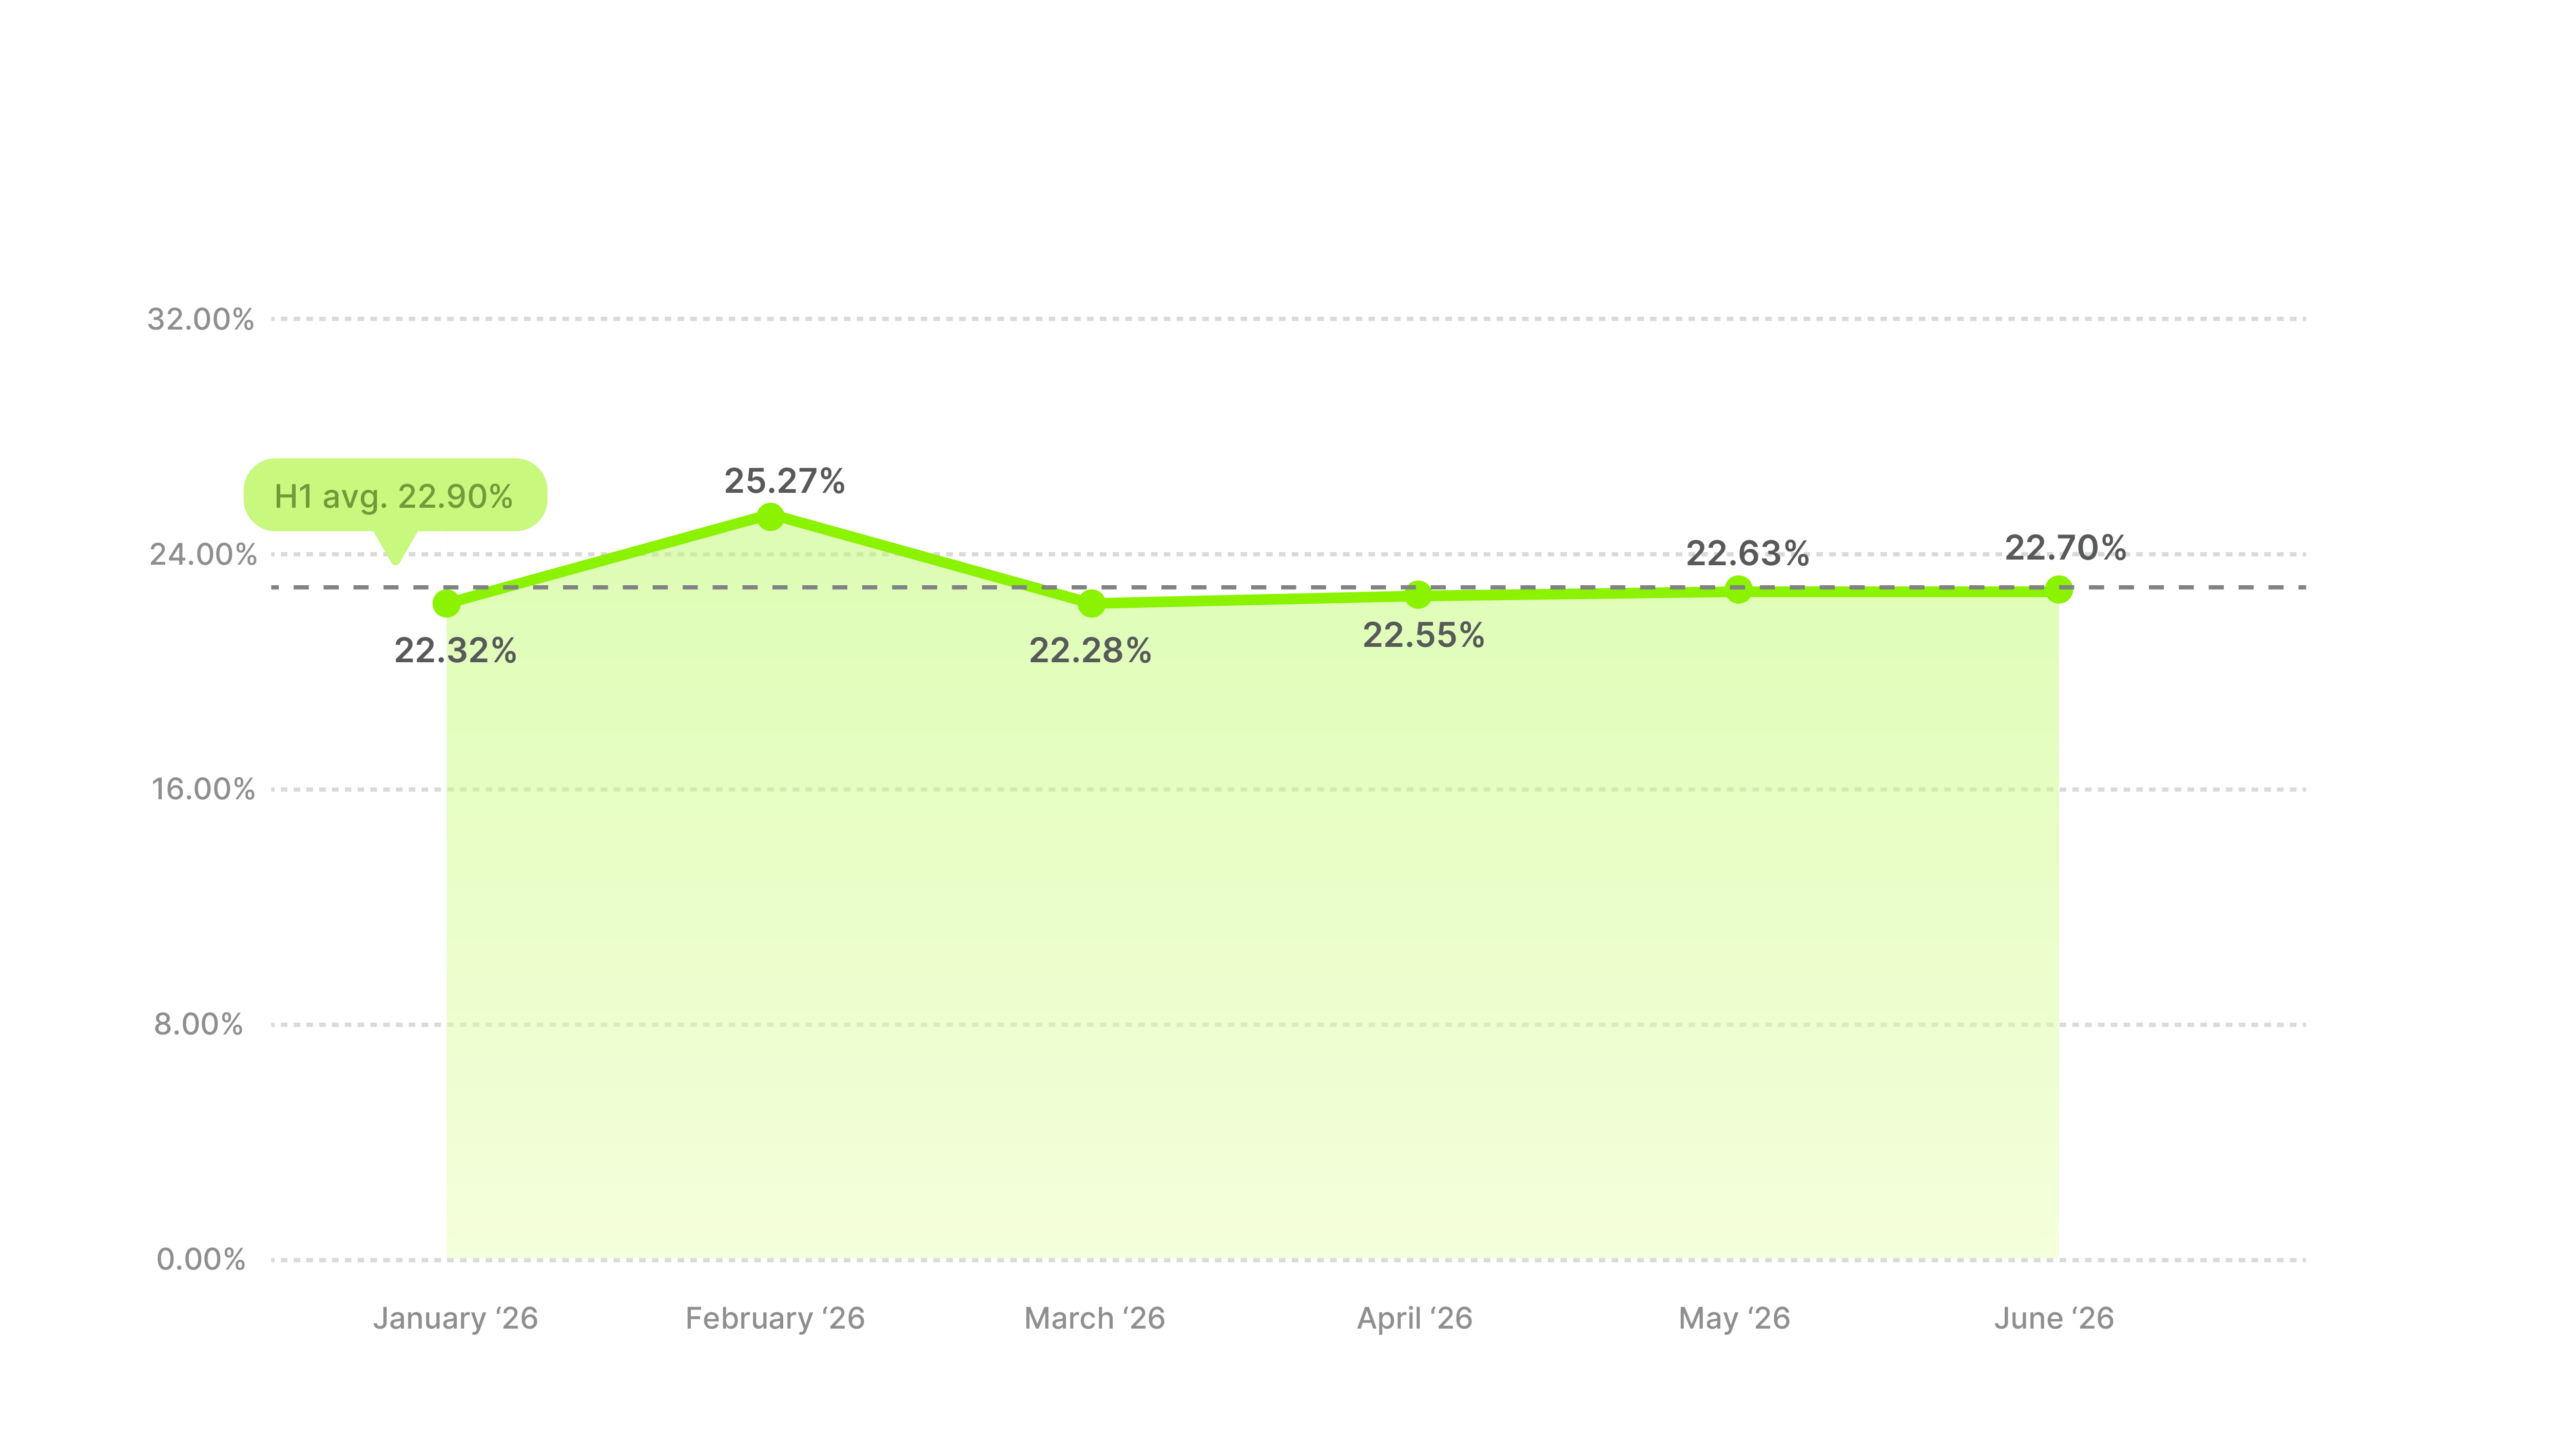
Flat, below the average, and one unexplained month. Five of six months were between 22.28% and 22.70%, all under the cross-industry line. February’s 25.27% appeared and disappeared, and on a sample this size one month is just a curiosity.
Industry hook rate average
Distance from all-industry average
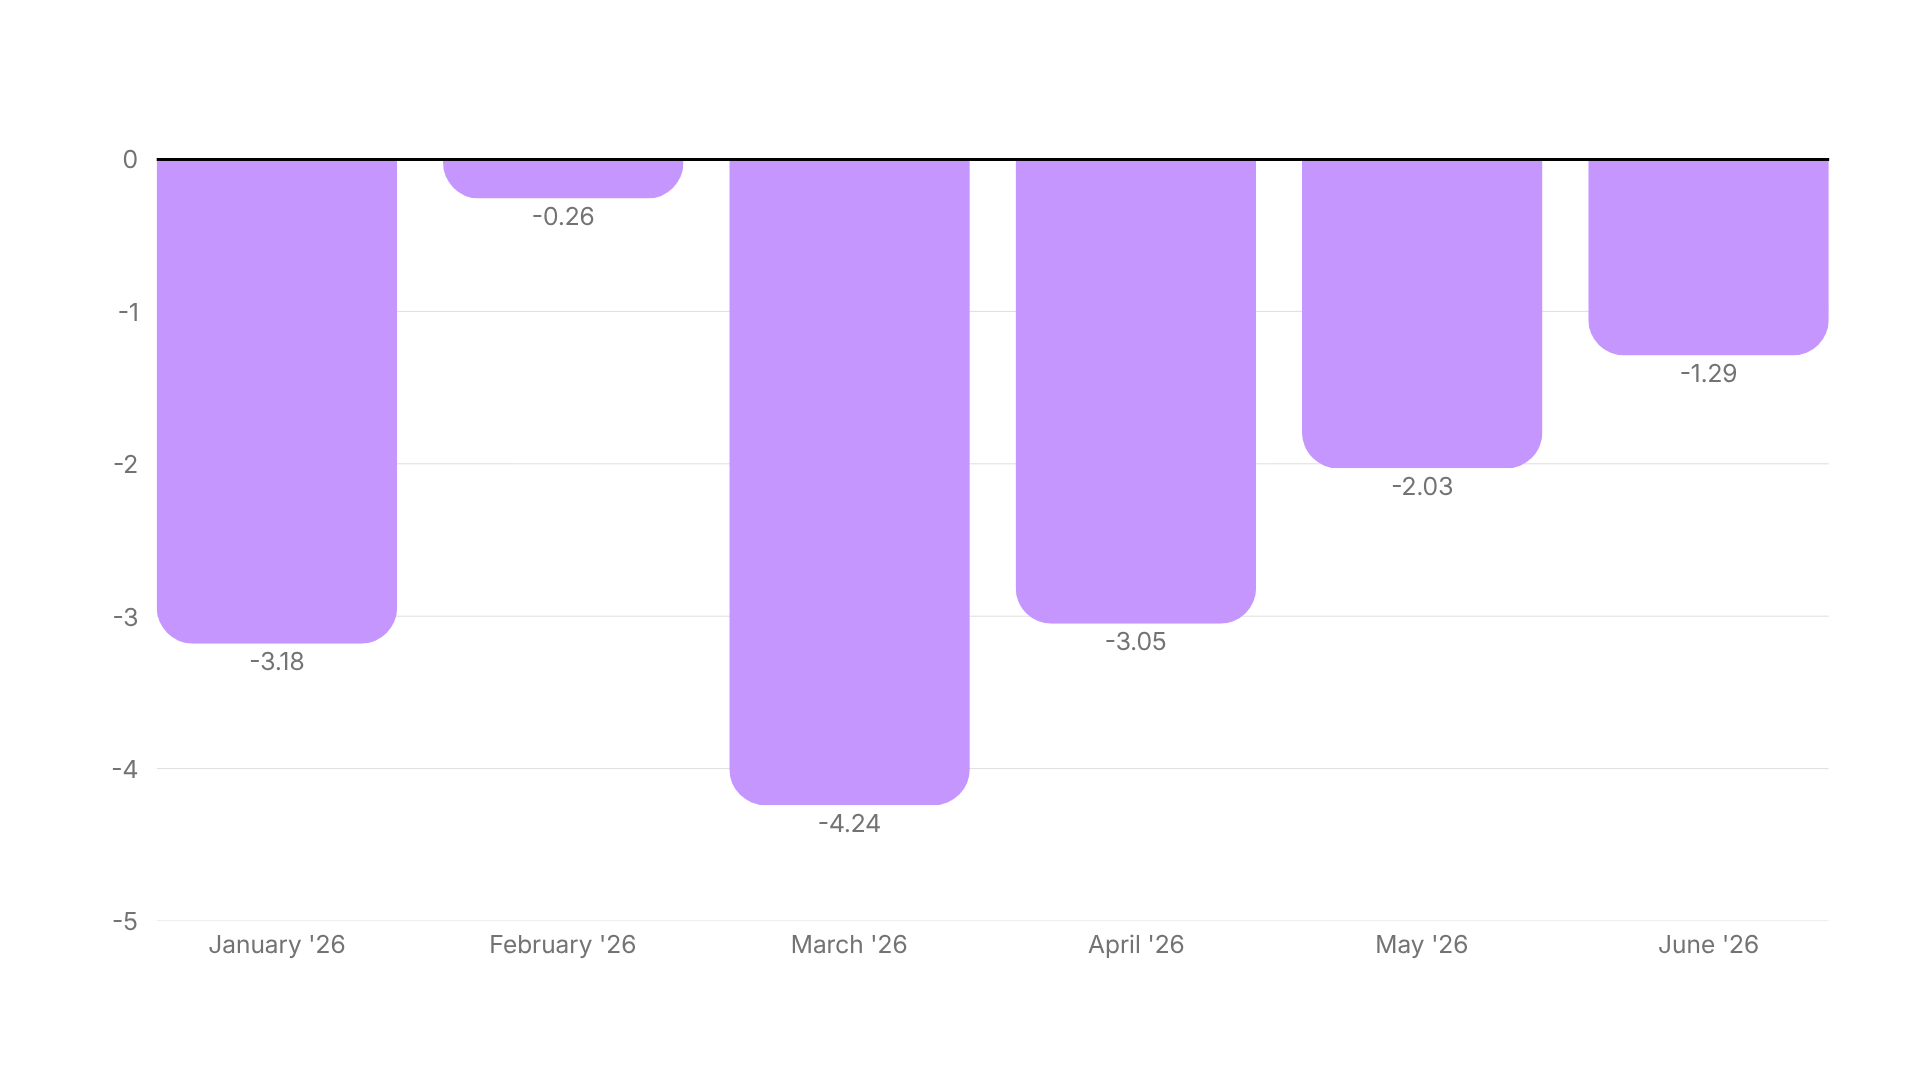
The gap to the cross-industry average closed every month from March onward anyway, from 4.24 pp down to 1.29 pp. Software didn’t earn that. It stayed around 22.6% while the average came down to meet it, the same thing that happened to Food & Beverages, just at a higher level.
The category has no shortage of things worth filming. The afternoon of manual work that collapses into one click, the twelve tabs nobody can navigate, the file that was never where you left it. Too many ads open on a feature rundown instead, explaining what the product is when they could be earning the first three seconds. The material is there but barely anyone’s using it.
Half over half it barely moved, 22.78% then and 22.90% now, and nothing about the creative approach changed with it. Benchmark around 23%, and read a month above 24% as a sign somebody tried something.
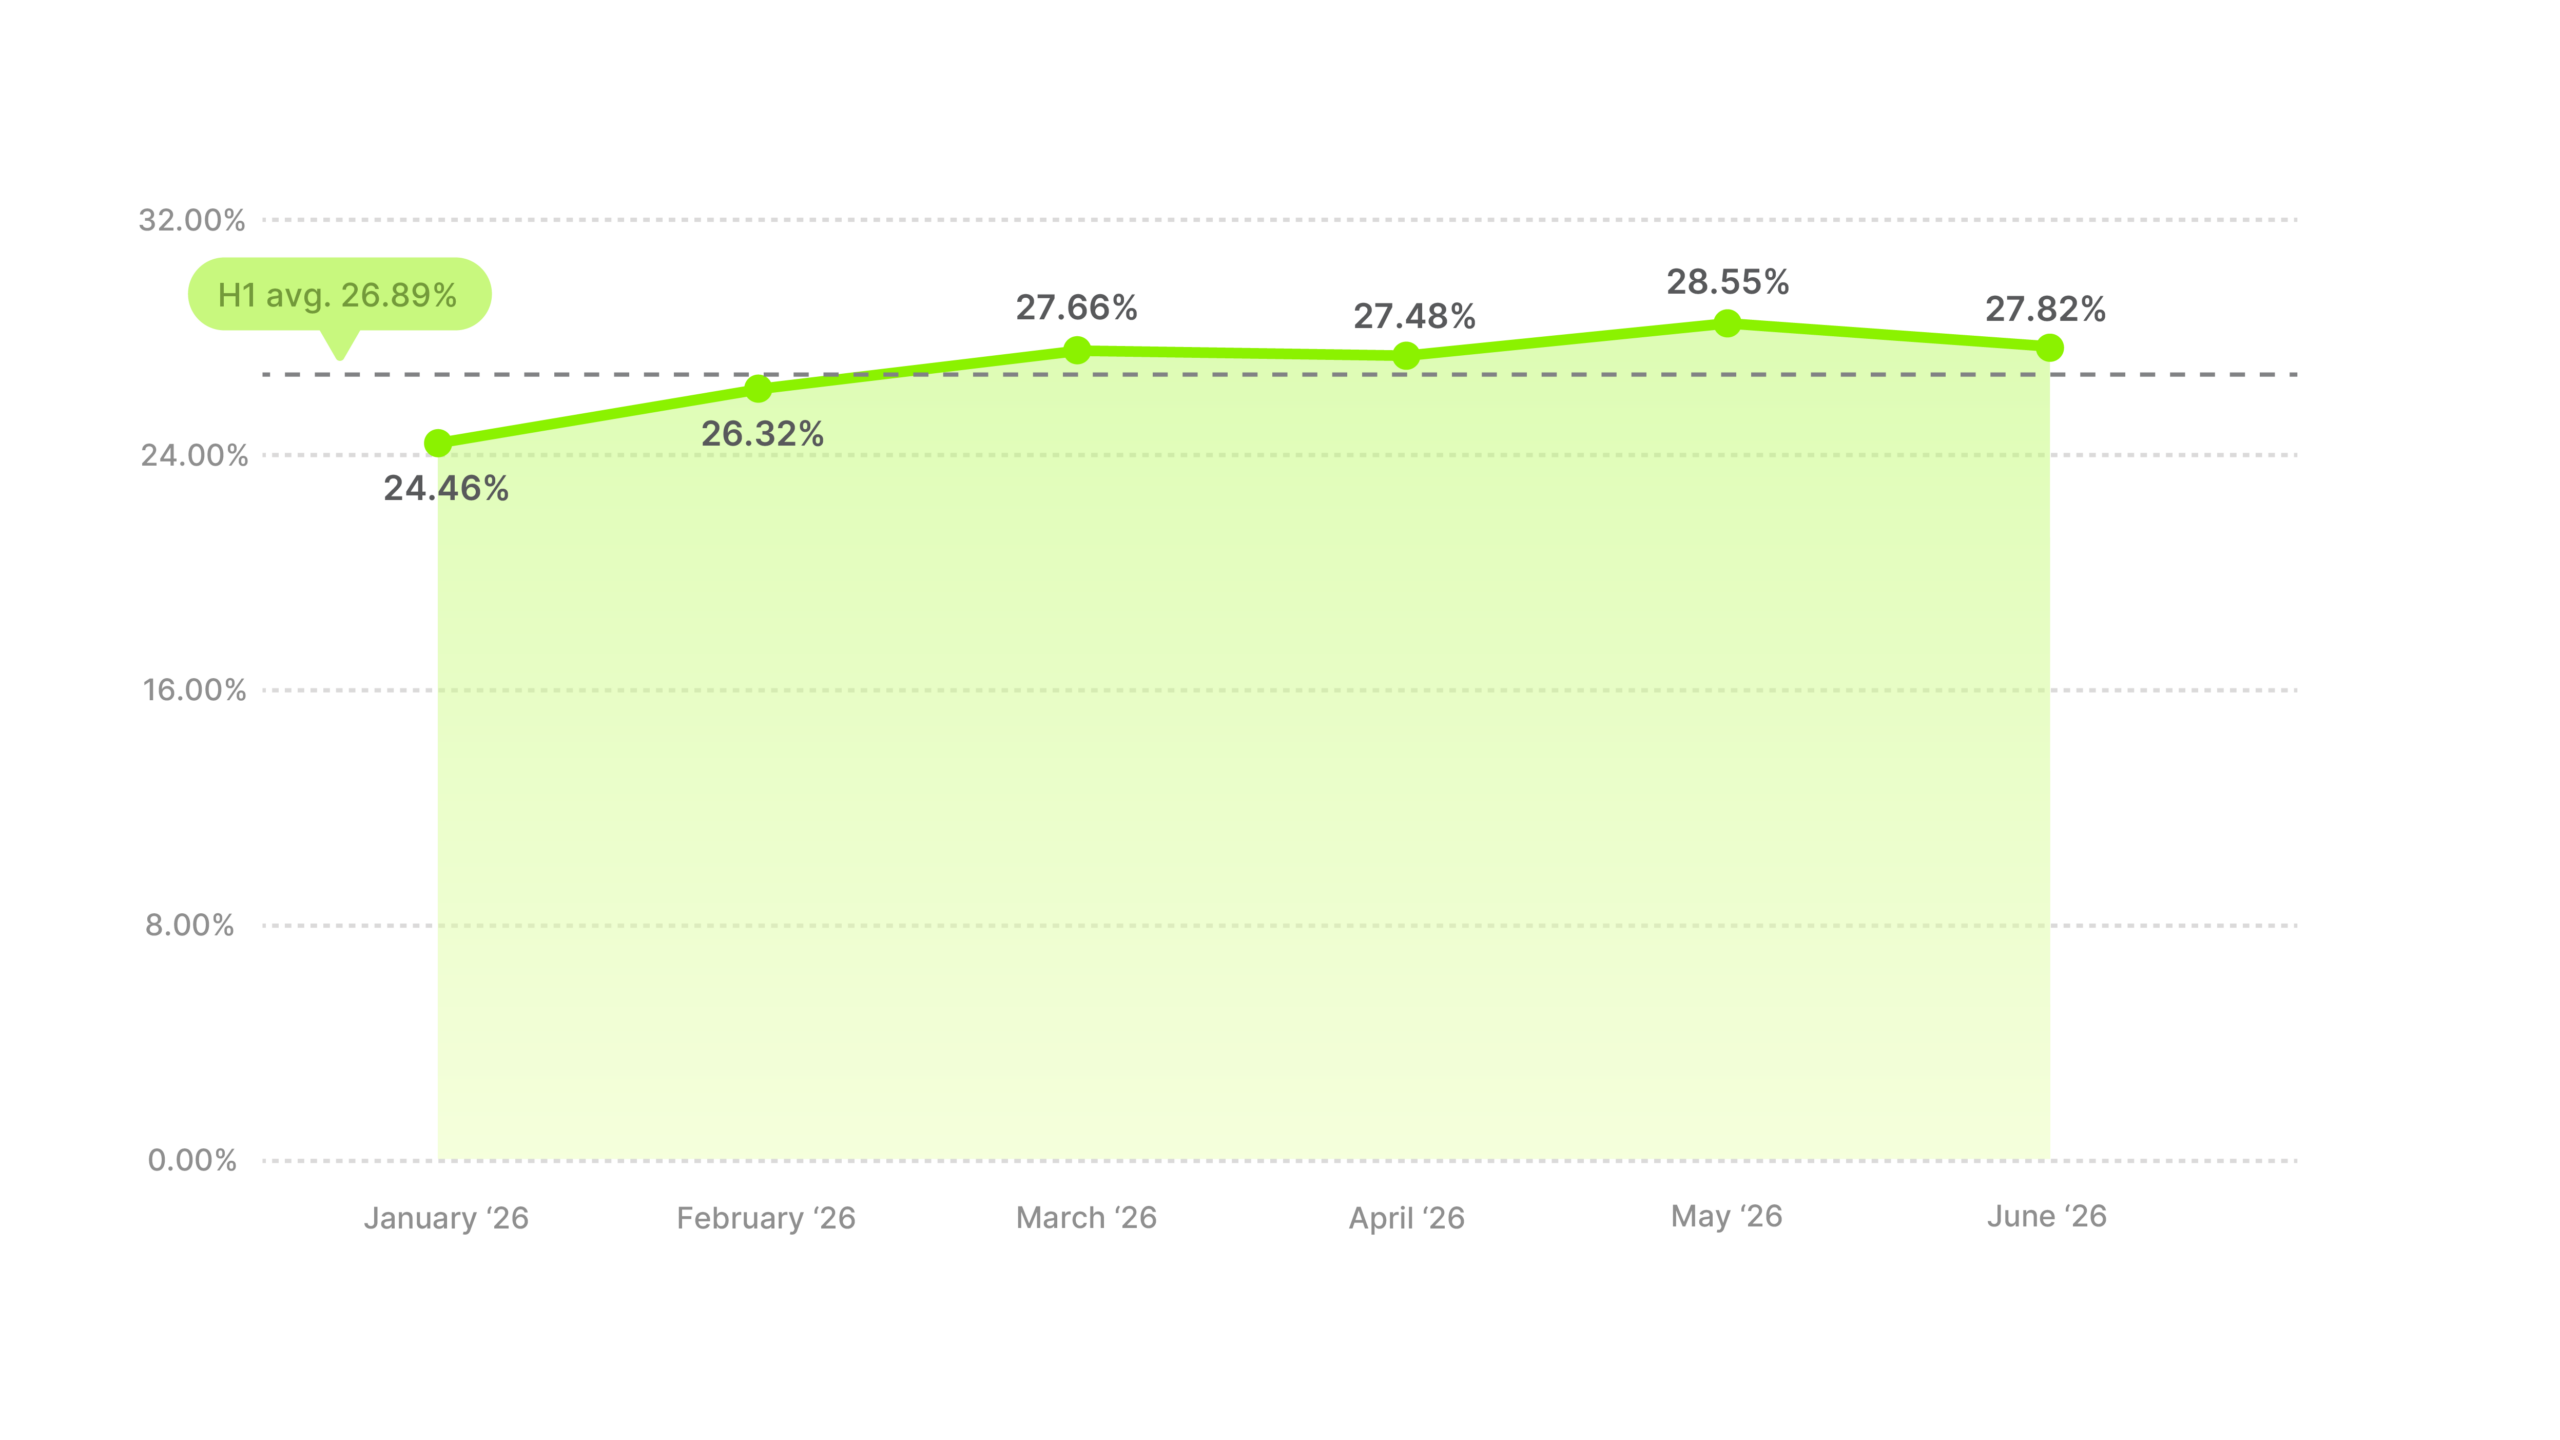
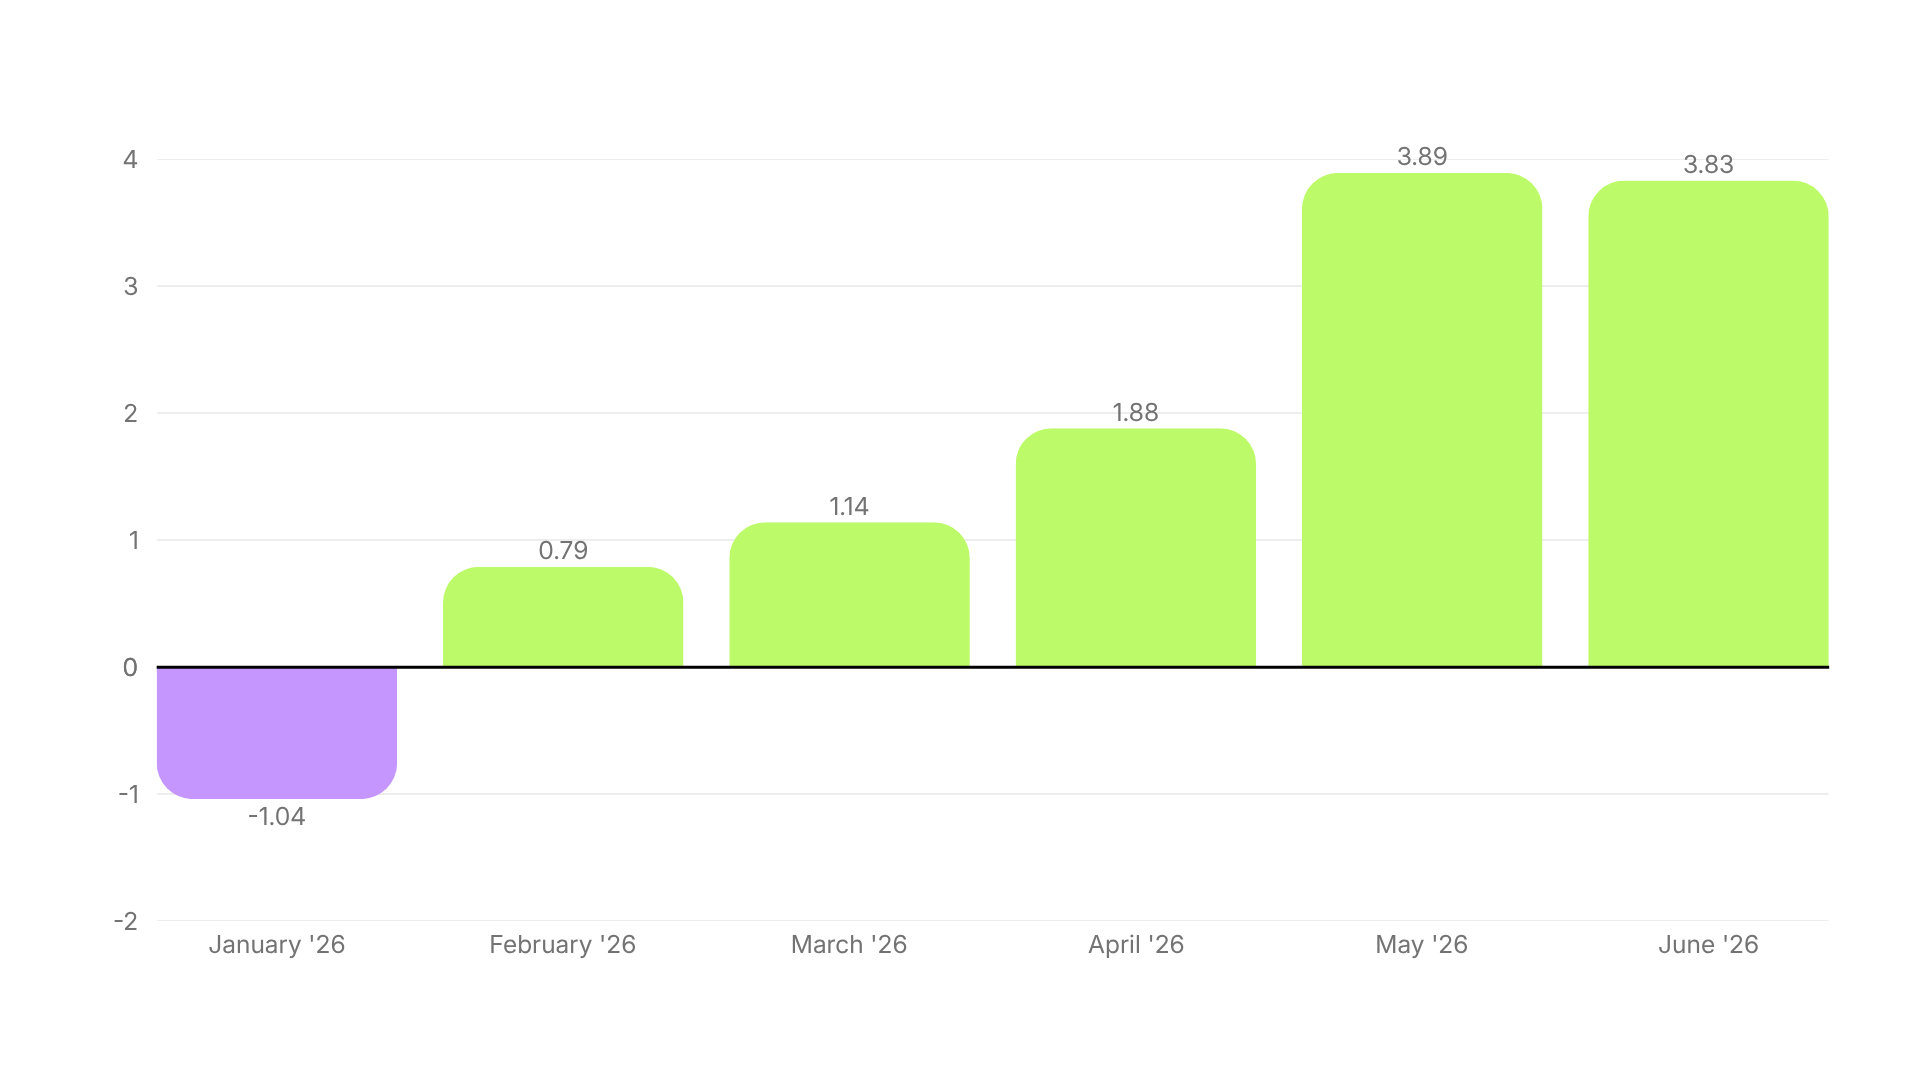
Sporting Goods rose through the half, with only two weaker months. January started below the cross-industry average at 24.46%, and from February on the category ran between 26.3% and 28.6%, finishing nearly 4 pp above the average in May and June.
Industry hook rate average
Distance from all-industry average
Season looks like the reason. H1 covers New Year fitness resolutions, the spring outdoor season, and the start of summer sport, so the audience was already leaning in, and a warmer audience makes even familiar gear footage work better.
That reframes last half’s diagnosis. In H2 2025 the category was flat and below average at 22.99%, and the verdict was sameness, since every ad is someone running or lifting. This half suggests the fix is timing as much as creative. H2 covers July through December and misses New Year resolutions and the spring outdoor season entirely, while H1 covers both. Sporting Goods may not have gotten better at this. It may be the season instead.
Toys & Games had the highest average of the fourteen and stayed above the cross-industry average in every month. Engagement is what does it, through the satisfying demo, the reveal you didn’t expect, the moment you need to see how it ends. Get that into the opening seconds and hook rate reaches a level most categories never see.
Industry hook rate average
Distance from all-industry average
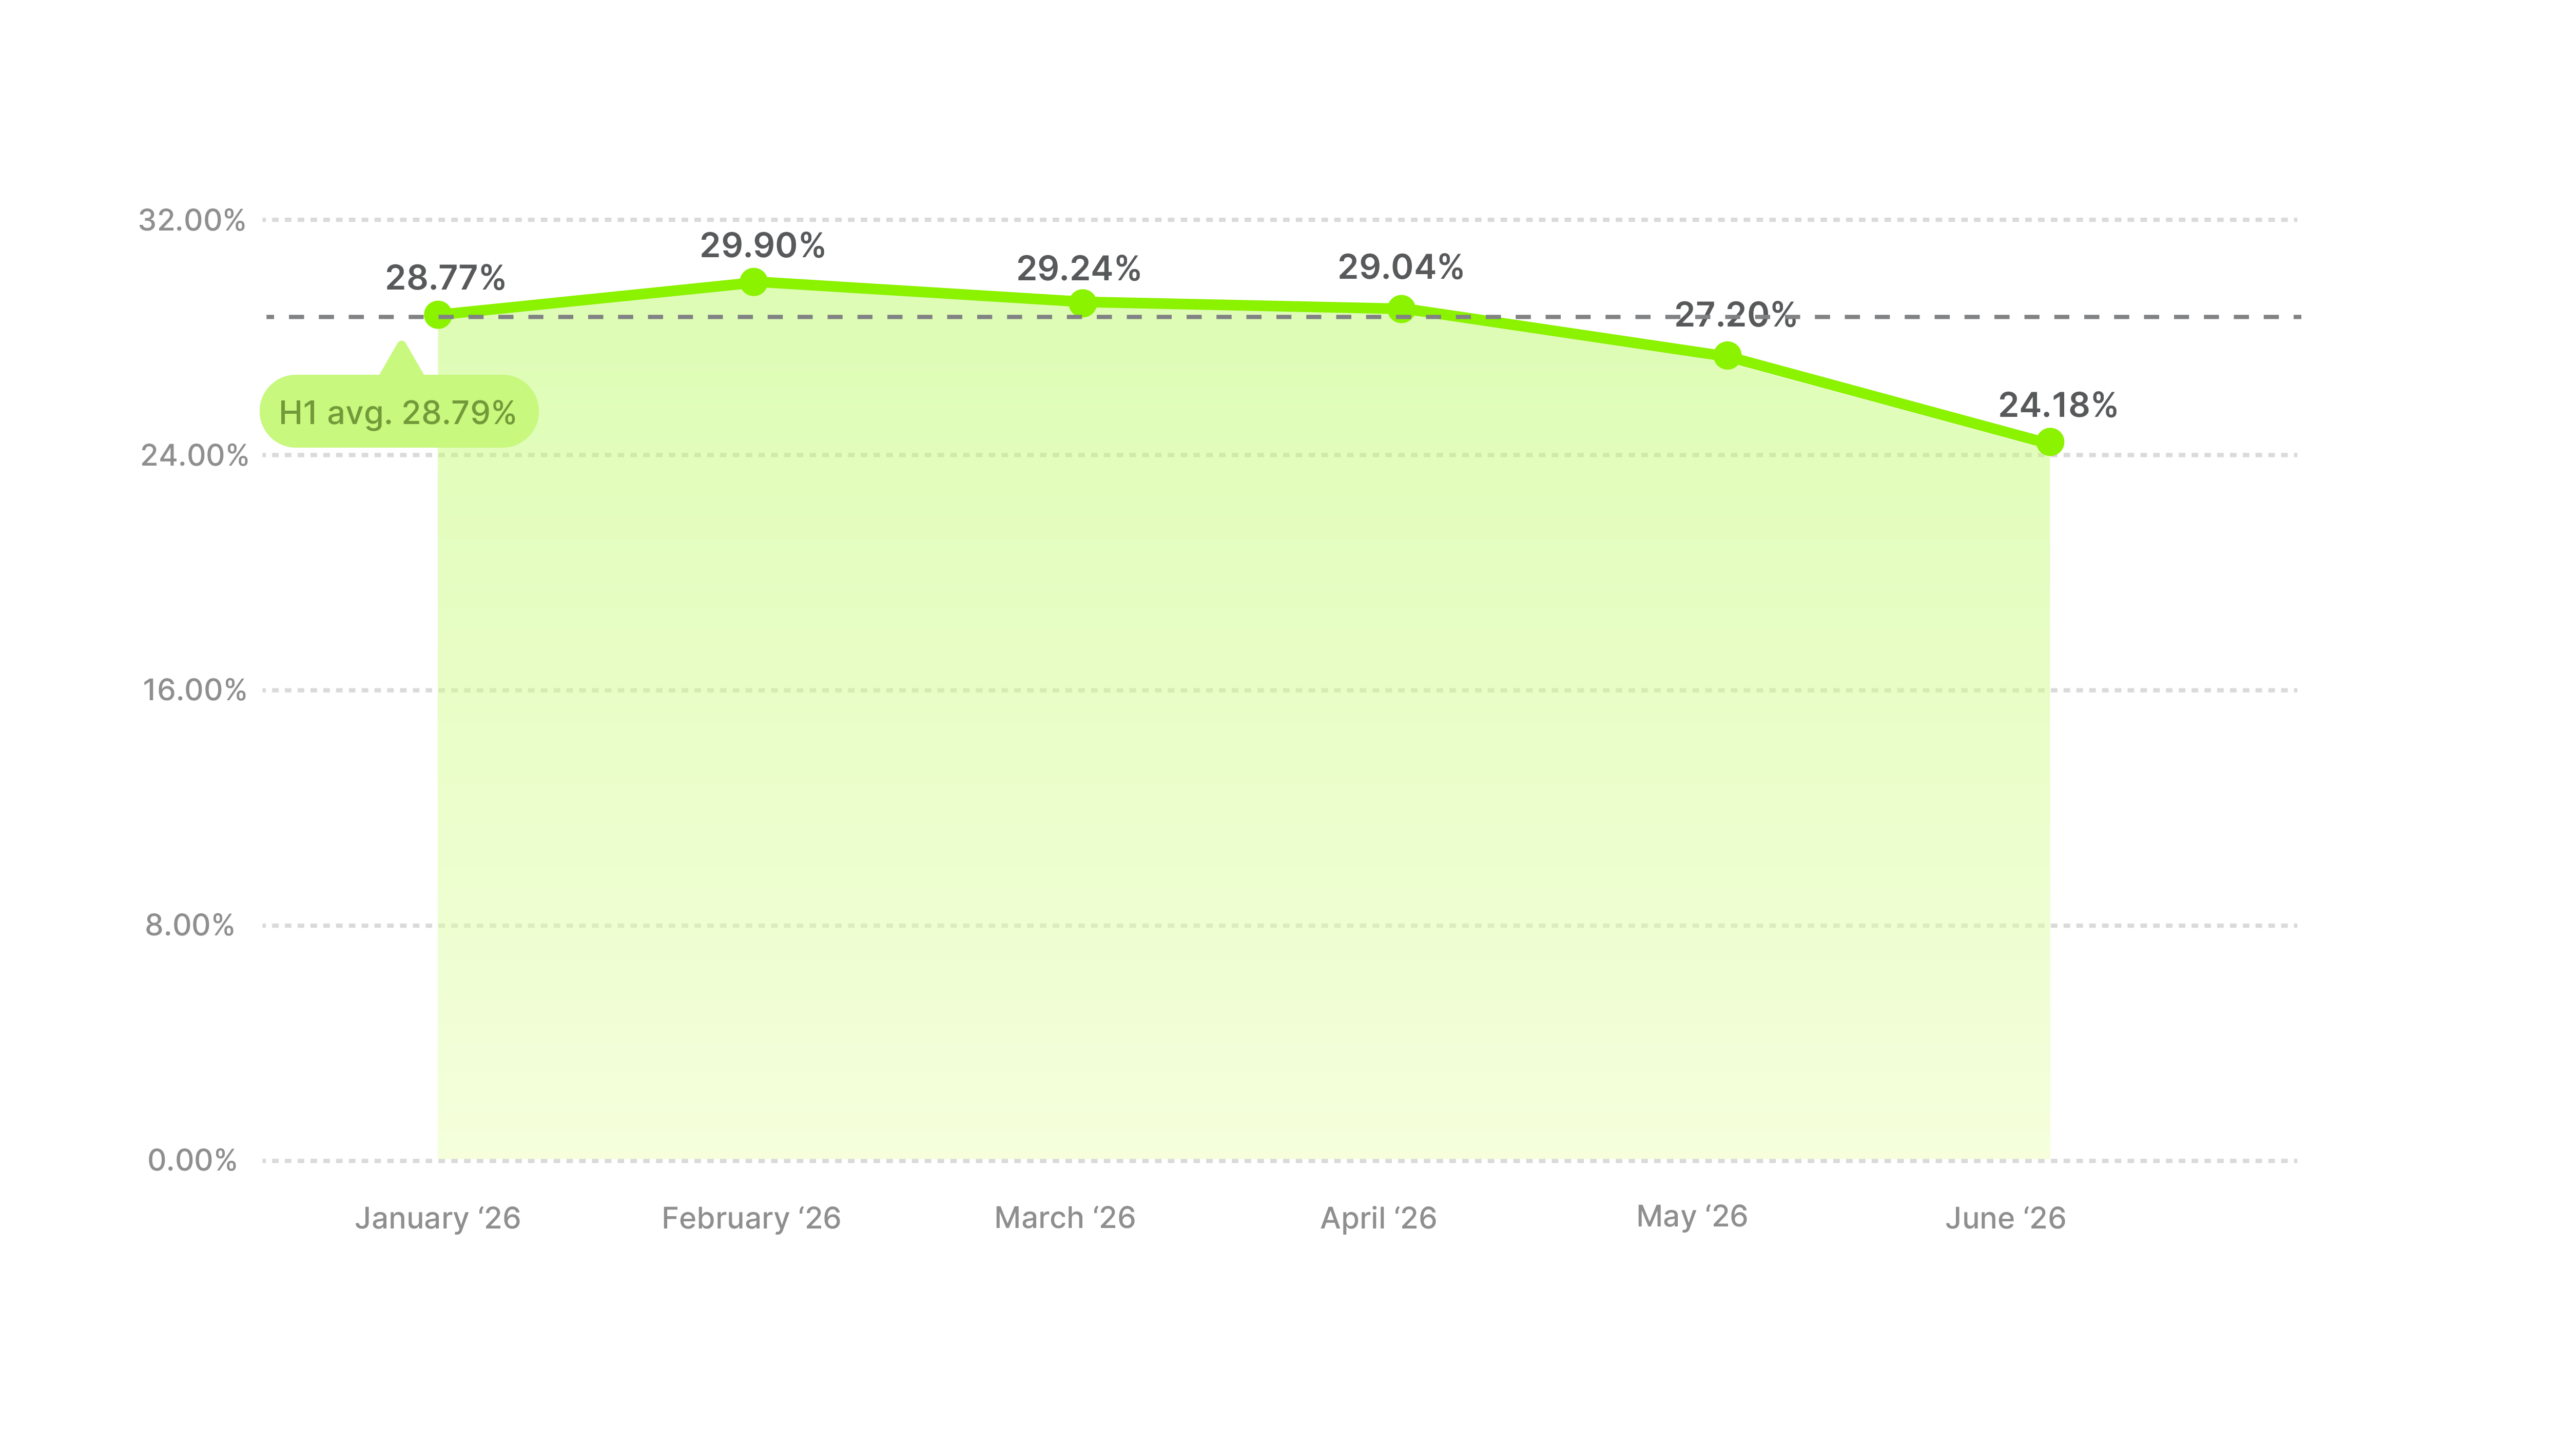
The half split in two, though. January through April stayed between 28.77% and 29.90%, steady at the top. Then May fell to 27.20% and June to 24.18%, and the lead over the cross-industry average all but disappeared. That’s a 5.72 pp range across the half, wider than everything in the report except Services and Business & Industrial, and a real change from last half when the category never dropped below 27.6%.
Second place at 28.23% last half became first at 28.79% this half. Benchmark around 28.8%, and treat a month under 27% as a decline worth investigating.
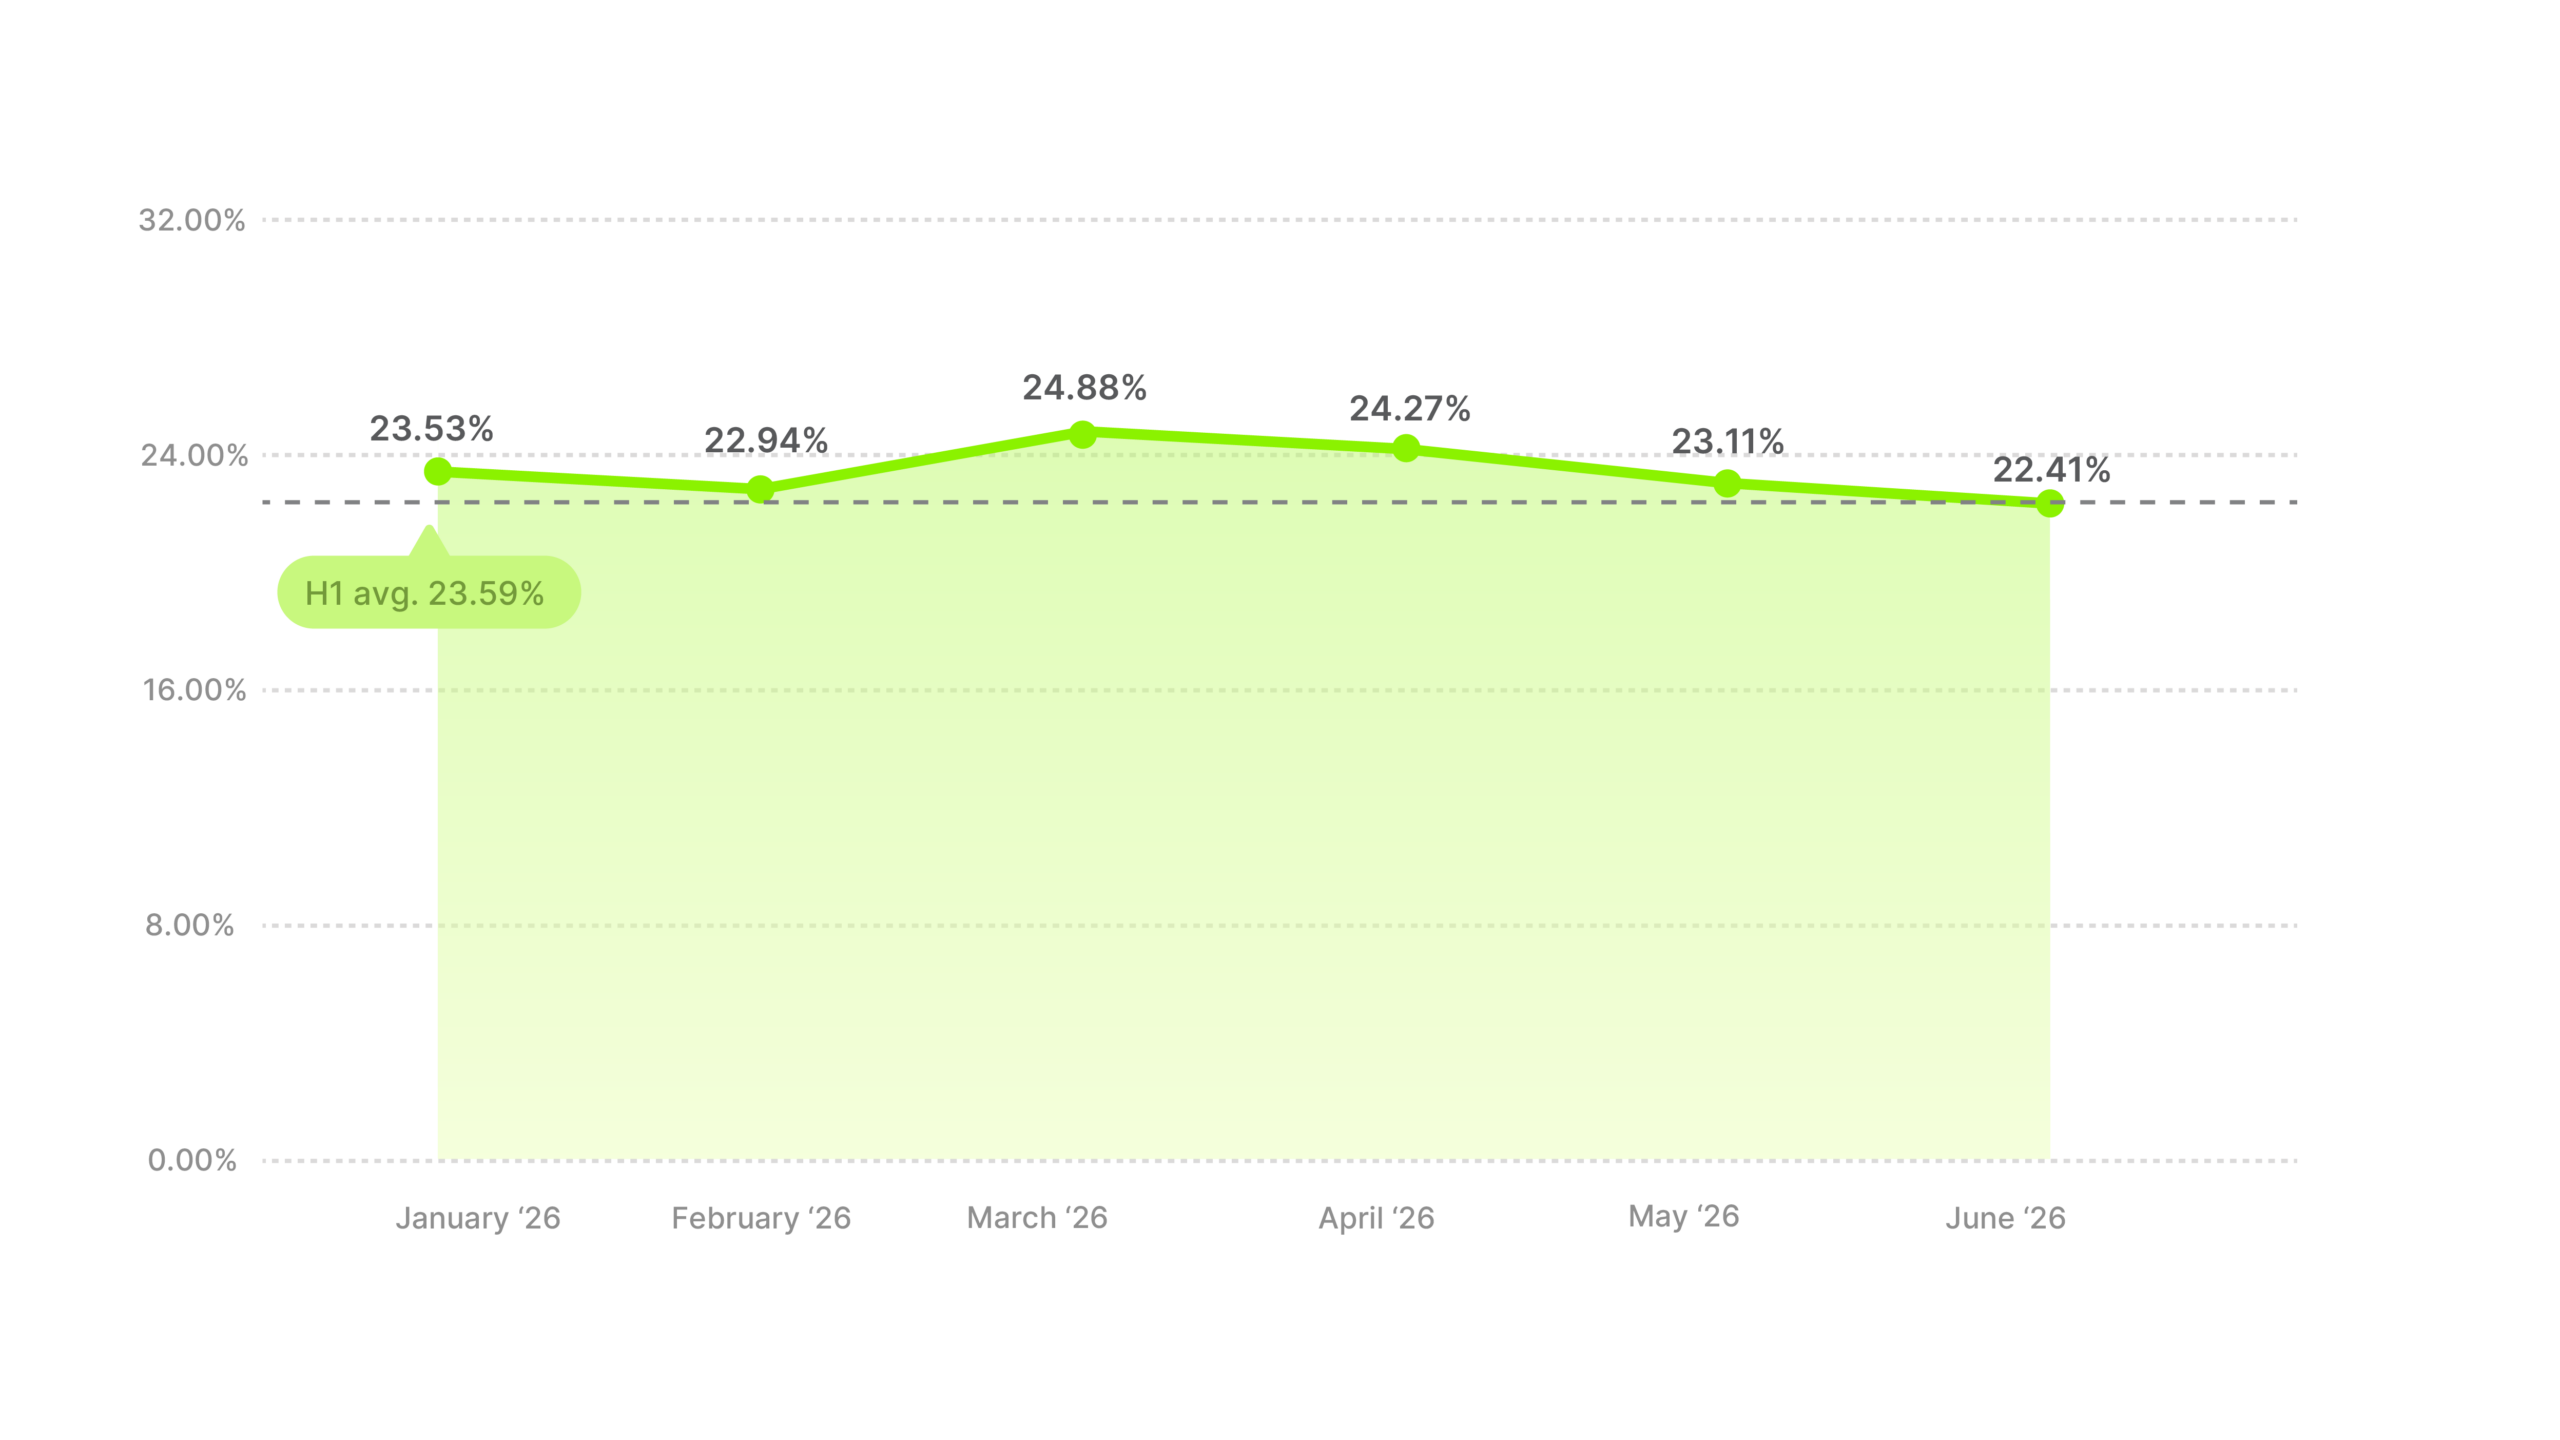
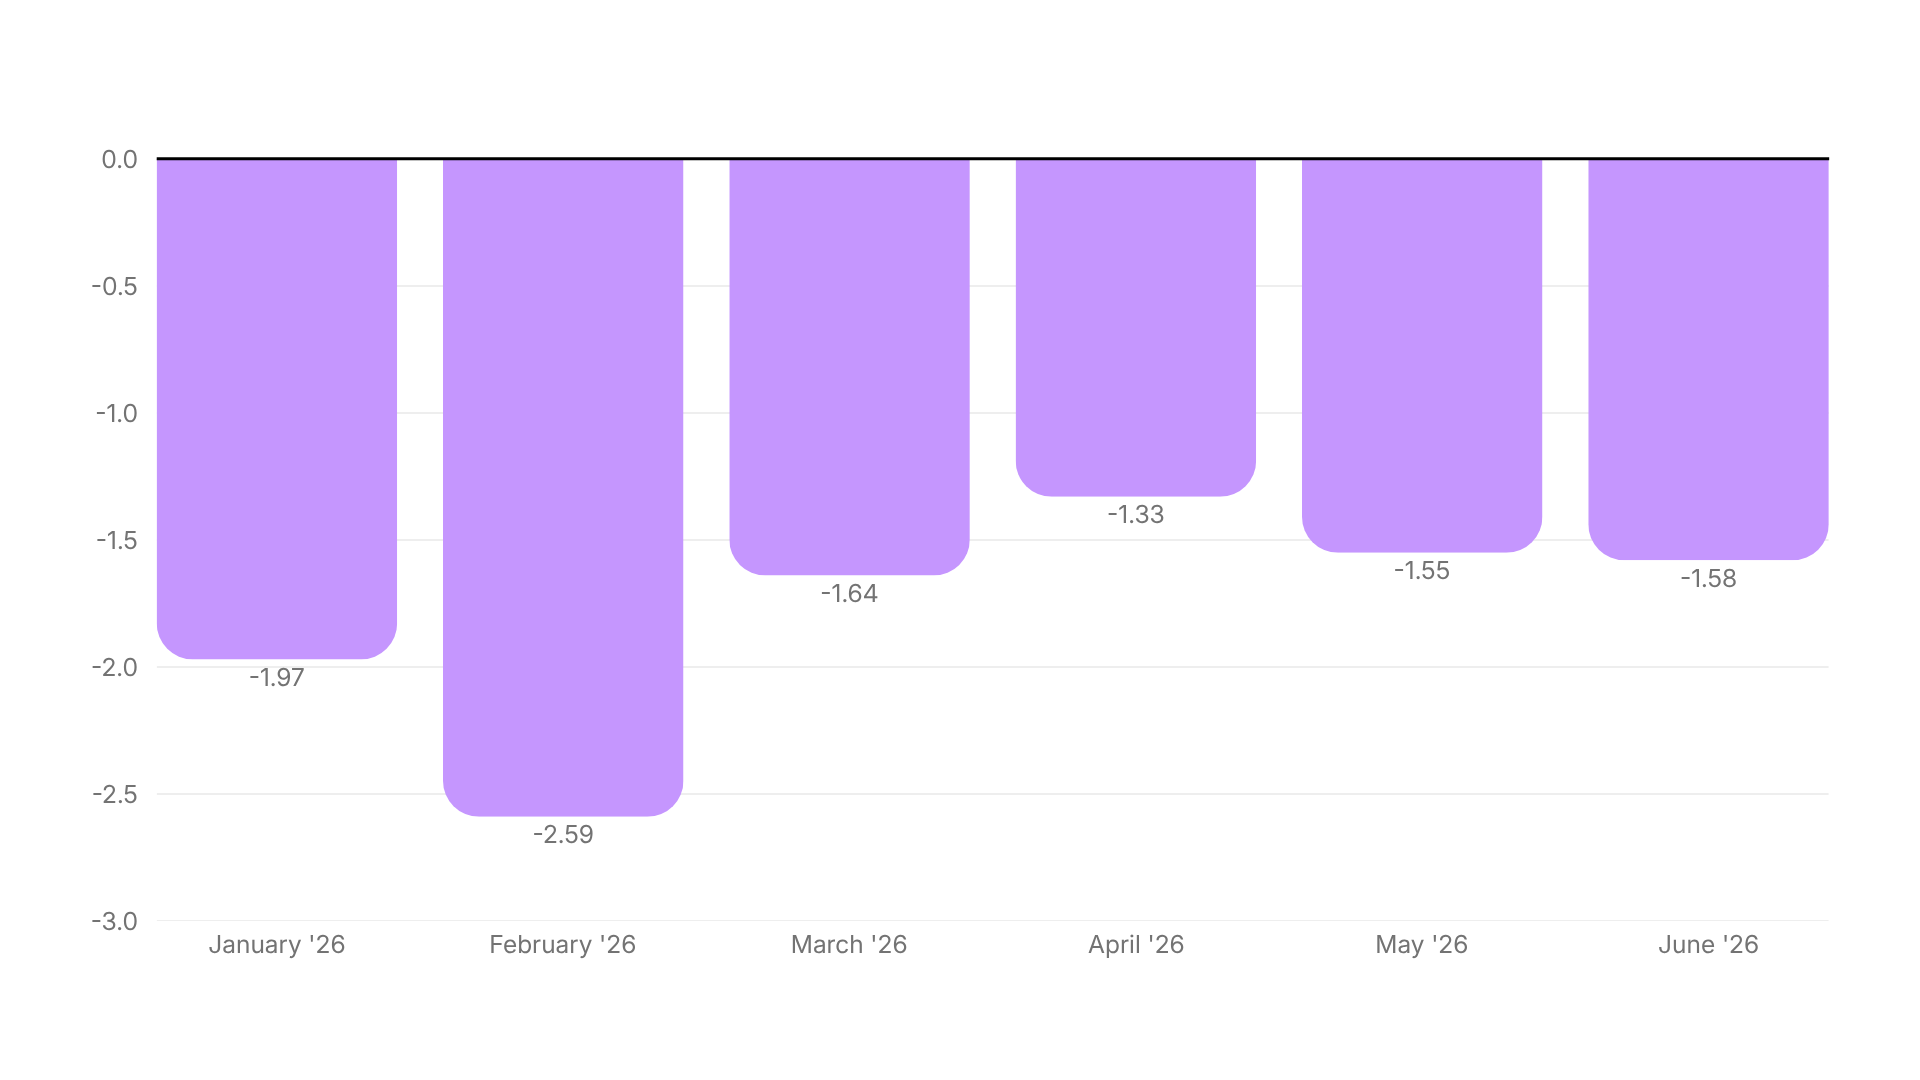
This bucket collects the industries too small to stand alone, so read it as a reference point and not as competition. It ran about 1.8 pp below the cross-industry average, stayed fairly flat, and had a mild March rise in step with the cross-industry trend.
Industry hook rate average
Distance from all-industry average
Composites behave like this. Individual quirks cancel each other out and what’s left looks like the market with the edges filed off. Land in this bucket and your own history is the better benchmark, or the nearest named category above it.
Since you don’t have a defined category, borrow from the top of the table. The two consumer categories that lead it, Toys & Games and Health & Beauty, both open on something happening – a toy mid-play, a before-and-after. Whatever you sell, the first three seconds should show it in action.
Methodology
Data source: 88,329 Meta video ads that ran between January 1 and June 30, 2026.
Inclusion criteria: Sales-objective video ads with reliable metrics and more than 1,000 impressions.
Hook rate definition: 3-second video plays divided by impressions. It’s the share of people who saw your ad and stayed past the opening seconds, and performance marketers use it as the clearest measure of whether an opening is working.
Industry classification: Fourteen categories assigned by advertiser product type. “Other” holds the industries too small to report on their own.
A note on interpretation: These figures describe what happened in H1 2026. They aren’t a forecast or a guarantee. Smaller-sample categories are more sensitive to the behavior of individual advertisers.