H1 2026 video ad benchmarks: what hook rate, CTR & ROAS actually mean for your creative strategy


We just published our H1 2026 video ad benchmarks across the three metrics that determine whether a piece of creative is actually working: Hook Rate, click-through rate (CTR), and return on ad spend (ROAS). The numbers come from 88,329 sales-objective Meta video ads that ran between January and June 2026, spanning 14 industries, $122 million in ad spend, and $212 million in purchase value.
Looked at separately, each metric answers one question. Hook Rate tells you whether the ad stopped the scroll. CTR tells you whether it earned the click. ROAS tells you whether any of that turned into revenue. This half, those three answers pulled apart from each other more than they have in any half we’ve measured, and for a lot of categories, the metric that looked strongest was not the one that made money.
Health & Beauty and Apparel & Accessories show that pattern clearly. Health & Beauty posted the best CTR of any category in the dataset, yet its ROAS still landed in the bottom third. Apparel & Accessories’ ROAS fell every single month of H1, extending a decline that runs back through last half too, a full year now without one month better than the one before it.
We’ve broken this dataset out in full inside the Hook Rate, CTR, and ROAS benchmark reports for H1 2026. This post pulls the pieces that matter most across all three, so the takeaway is what to change in your next brief, not just what moved.
TL;DR
- Cross-industry averages moved in three different directions this half. Hook Rate rose from 24.42% to 25.44%, CTR’s spread between categories widened even as the average ticked up, and ROAS fell about 10%, from 2.41 to 2.17.
- Health & Beauty won the click but not the sale, with the best CTR in the dataset and bottom-third ROAS. Apparel & Accessories’ ROAS has fallen for a full year straight, extending last half’s decline.
- Toys & Games had the best Hook Rate of the 14 industries and still finished 12th on ROAS. Baby & Toddler had the worst CTR and the best ROAS by more than double the average.
- Business & Industrial and Sporting Goods both raised their Hook Rate while their CTR went down, the only two categories in the dataset that split that way.
The headline shifts
Three moves account for most of what changed this half, and each one points at a different part of the funnel.
Business & Industrial reached 33.03% Hook Rate in March, the highest single month any category posted all half. It held above 28% every month from March onward, while the cross-industry average was falling around it. A category with nothing to unbox or demo just posted the strongest attention numbers in the dataset.
Toys & Games kept the best Hook Rate of the 14 industries and finally turned that attention into clicks. Its CTR jumped from 1.30% to 1.89%, the largest gain of any category, after two straight halves of winning the open and losing the click.
Software’s ROAS fell to 1.04, the worst of the 14, and dropped as low as 0.56 in March, the single weakest month any category recorded all half. That closes the half down 40% from last half’s 1.73, and it’s the only category with no strong reading on any of the three metrics.

Reading the three metrics together, not separately
Each metric in this dataset answers a different question, and reading only one of them can point you in the wrong direction. A high number on one metric says nothing about the other two, and this half’s data makes that case clearly.
Toys & Games: best Hook Rate, 12th on ROAS. The category posted the highest Hook Rate of the 14 industries, at 28.79%, but finished 12th on ROAS at 1.62, well below the 2.17 average. The audience that stops for a toy video is not the same audience that’s ready to buy one outside the holiday season.
Baby & Toddler: worst CTR, best ROAS. The category posted the lowest CTR of the 14, at 1.37%, and the highest ROAS by a wide margin, at 4.99, more than double the average. Fewer people clicked, and nearly all of them were parents who were already going to buy.
Put side by side, these two categories show why a single metric can mislead a creative brief. A strong Hook Rate can pull in a broad audience that was never going to convert, and a weak CTR can still describe an ad that’s reaching exactly the right, smaller group of buyers. The number worth building a brief around depends on which stage of the funnel is actually the problem, which is what the next section walks through.
What to do about it
Once you know which combination of metrics you’re dealing with, the fix is specific to that combination, not a generic “make better creative” note.
If Hook Rate is strong and CTR is weak, the ad is probably reaching the wrong slice of a broad audience. Business & Industrial had the second-best Hook Rate of the 14 at 28.74%, and its CTR still slipped from 1.54% to 1.52%. Sporting Goods raised its Hook Rate by nearly four points and watched its CTR fall from 1.47% to 1.44% over the same stretch. In both cases, the opener is stopping plenty of people who were never going to click, so the fix is narrowing who the ad reaches, even if that means accepting a lower Hook Rate in exchange for a better-matched audience.
If CTR is strong and ROAS is weak, the problem usually sits after the click, not inside the ad. Health & Beauty posted the best CTR of the 14 industries at 2.36%, and its ROAS still landed 11th at 1.82, the second half in a row it’s won the click and lost the sale. Reviews, credible before-and-afters, and a clearer reason for the price all target what happens once someone lands on the page. It’s worth testing a narrower ad angle too, since a broad beauty message pulls in clicks from people who were never going to buy in the first place.
If a category is weak on all three metrics, the buying process itself probably doesn’t match how the ad is being measured. Software ranked 11th on Hook Rate, 9th on CTR, and last on ROAS at 1.04, and it’s the only category with no strong reading anywhere. Almost nobody buys software directly off a video ad. Someone starts a trial, somebody else signs off, and the purchase lands weeks later, well after the ad stops getting credit for it. The more useful fix here is tracking sign-ups or trial starts instead of judging the ad on same-window ROAS, and using the creative itself, a screen recording or the product mid-task, to earn the click in the first place.
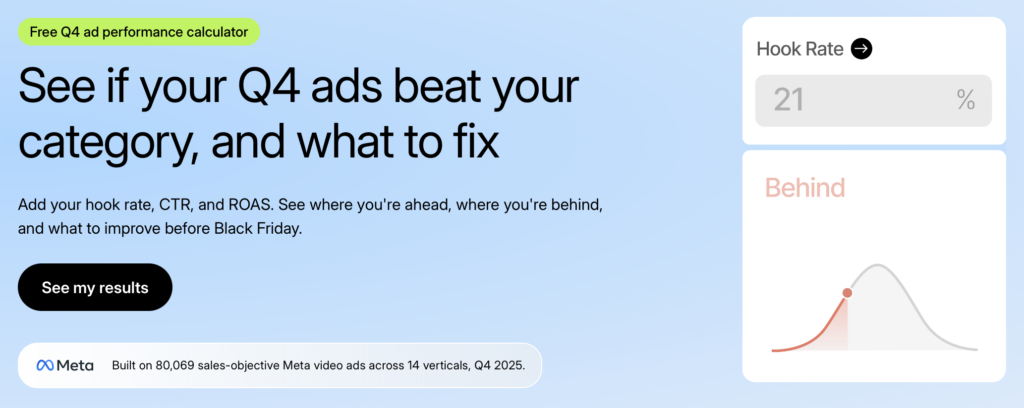
This same read-your-category-first logic carries straight into Q4 planning. Our Q4 Performance Calculator applies it to Black Friday specifically, using last year’s H2 2025 data to show where your category’s Hook Rate, CTR, and ROAS should land heading into BFCM, so you can plan around your own numbers instead of the cross-industry average.
Category call-outs
Four categories tell the most complete stories in this half of data, and two of them, Health & Beauty and Apparel & Accessories, are worth extra attention if they’re core to your own product mix.
Health & Beauty. The category posted the best CTR of the 14 industries overall, but the trend inside the half is the part to watch. February reached 2.67%, the strongest single month in the dataset, and CTR fell almost every month after that, down to 1.74% by June. Its ROAS told the same story a second half in a row, still landing in the bottom third even with clicks this strong. The lead over the rest of the market is narrowing, and it’s worth testing a narrower, single-problem ad angle rather than the broad beauty message that’s been winning the click without winning the sale.
For what that looks like in practice, see the top-performing beauty UGC ads and health UGC ads from the same half, where the strongest hooks name one specific frustration up front.
Apparel & Accessories. ROAS fell every single month of H1, from 2.88 in January to 1.84 in June, and that’s not a Q4-style efficiency trade-off since Hook Rate and CTR both held roughly steady across the same months. Across the twelve months we’ve now measured, spanning H2 2025 and H1 2026, Apparel & Accessories hasn’t had a single month outperform the one before it. Whatever’s driving the decline is happening in what happens after the click, not in the ad itself, which points at pricing, offer, or checkout rather than another round of creative testing.

Baby & Toddler. ROAS more than doubled this half, from 2.48 to 4.99, the largest rise of any category, even as it finished the half with the lowest CTR of the 14 at 1.37%. Its weakest month, 4.18 in April, was still higher than every other category’s full-half average. A baby-gear ad reaches a smaller, more committed audience, and that trade-off is working clearly enough that Hook Rate and CTR are the wrong scorecards for this category.
Software. ROAS opened the half at 1.69 in January, fell to a low of 0.56 in March, and closed June at 1.23, still short of where the year started and down 40% from last half’s 1.73. Nothing about that shape lines up with a normal buying season, which fits a category where a video ad rarely gets credit for a sale that happens weeks later, after a free trial and someone else’s sign-off.
Put the full data to work
The numbers above are the ones that should change how you brief your next round of creative. If you want the complete category-by-category detail, including a vertical that isn’t one of the four covered above, the full Hook Rate, CTR, and ROAS reports linked earlier break out all 14 industries month by month.
Our CreativeOps platform runs on this same benchmark data, matching creators and scripts to whichever metric your next campaign actually needs to move, rather than treating every brief the same way.
If you’re already planning for Q4, our Black Friday benchmarks post applies this same reading to BFCM specifically, using last year’s H2 2025 data. One note if you read both: that post frames Apparel & Accessories’ Q4 ROAS dip as brands trading efficiency for volume. This half’s data suggests the decline runs deeper than a seasonal trade-off, so weigh your own category’s numbers over either framing.
FAQs
How often does Billo update the video ad benchmarks?
What changed most since H2 2025?
How should I use these numbers if my category isn’t listed?

SEO Lead
Passionate content and search marketer aiming to bring great products front and center. When not hunched over my keyboard, you will find me in a city running a race, cycling or simply enjoying my life with a book in hand.
Make creator marketing a data-backed growth channel

Related from Creative Insider

How Billo pricing works: what you pay for UGC videos

Brief Complexity Bonus, now live: price your briefs to match the work
Meta Performance Marketing Summit 2026: Targeting is solved. Meta is coming for creative next.